Research Journal
Volume 11, Issue 2, June 2017, pages 180–186
DOI: 10.12913/22998624/70801 Research Article
A PRESSURE-BUBBLE VACUUM FORMING PROCESS
FOR POLYSTYRENE SHEET
Emil Sasimowski1
1 Lublin University of Technology, Department of Polymer Processing, ul. Nadbystrzycka 36, 20-618 Lublin, e-mail: [email protected]
ABSTRACT
The paper reports the results of a study on the effect of selected conditions of a pres
-sure-bubble vacuum forming for polystyrene sheet on the non-uniformity of wall thickness of finished parts. The investigation was performed using DOE methods. Variables for the tests included temperatures in the external and internal zones of the heaters as well as heating time. The results demonstrate that the heating time and tem
-perature in the internal zone formed by the heater have a statistically significant effect on the finished part’s wall thickness at the measuring points. It has been found that the side walls and bottom of the finished part are uniformly deformed, and thus exhibit the lowest wall thickness non-uniformity at a heating time of 22s (corresponding to the middle of the measuring range). Also, it is observed that the application of low temperatures in both zones of the heater has a positive effect. Due to the use of bubble, the finished parts exhibit a much lower wall thickness non-uniformity compared to those produced without bubble.
Keywords: thermoforming, vacuum assisted drape forming, polystyrene sheet, pres
-sure-bubble vacuum forming.
INTRODUCTION
The forming of thermoplastic films and sheets involves inducing biaxial stresses, which leads to the deformation of a plastic and generation of a non-developable surface. Stretching is a forming process wherein the stresses acting on the walls of a part being formed along both its circumference and the vertical axis are tensile stresses [2]. Ther -moforming is the process which involves heat -ing a plastic sheet or film in a mold until soft to induce tensile stresses leading to its deformation and adherence to the mold cavity, followed by cooling and release of the finished part [13, 14].
Depending on the forming agent, forming can be divided into: forming by low-pressure air (vacuum forming) and forming by high-pressure air (bubble and drape assisted vacuum forming) [3, 4, 9]. Depending on the part of the mold the stretching process takes place, we can distin
-guish: female mold forming, wherein stretching takes place in the mold cavity, and male mold stretching, wherein forming is performed in the male mold [11, 16].
The variations in stresses and deformations in individual regions of finished parts lead to the non-uniformity of their walls, which is one of the gravest problems in stretching [1, 12]. This can particularly be observed in the region between the bottom and walls of finished parts [7, 17].
Since neither the use of vacuum forming nor the use of bubble vacuum forming can ensure producing finished parts with uniform wall thick -ness, the common practice is to combine several methods to this end [6, 10]. One of the solutions is a process which first involves free blow bub -bles [15] leading to relatively uniform deforma -tion of the entire plastic sheet and increase in its dimensions (surface area which is always smaller than that of the mold cavity). This is followed by
vacuum assisted drape forming which consists in forcing the plastic sheet against the male mold at room or higher temperature. The bottom of the finished part corresponds to this part of the male mold which has direct impact on the plastic. After that, the plastic undergoes stretching due to the impact of low-pressure air (vacuum forming), which results in formation of side walls of the fin -ished part which are subjected to free stretching. This paper is devoted to a process which com -bines the above methods. It reports the results of a study investigating the effect of selected condi -tions of pressure-bubble vacuum assisted drape forming for polystyrene sheet on the non-unifor -mity of wall thickness of finished parts.
EXPERIMENTAL
Test stand
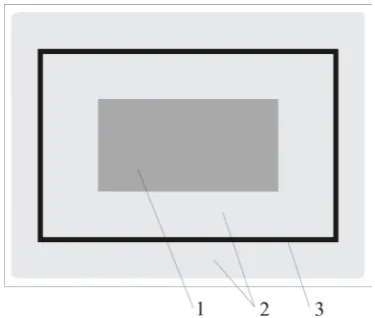
Test samples were produced by pressure-bub -ble vacuum assisted drape forming using the PEX B-3 F test stand for stretching [5]. This test stand comes with a heater with HTS ceramic infrared radiators with a total power of 3.6 kW which form two zones: the external zone comprising the cir -cumferential part of the plastic sheet subjected to heating and the internal zone corresponding to the central part of this region (Fig. 1). The radia -tors are distanced from the surface of the plastic by 130 mm. On the inside circumference of the clamp frame there are reflectors which compen -sate for any heating non-uniformity due to uneven infrared rays penetration of individual regions of the plastic sheet. The tests were performed using a moving MDF male mold in the shape of trun -cated pyramid with a 340x190 mm rectangular
base, a height of 80 mm, and a top of 300x150 mm. The depth-of-draw ratio, k, is 0.53. The test stand is equipped with a 0.75 kW vacuum pump which generates pressure of 2 hPa.
Test methods
The tests were performed on a 0.5 mm thick flat polystyrene sheet manufactured by P.P.H.U Petroplast Ltd.
The investigated process was described by the following variables:
• heating time T, s.
• temperature in the external zone of the heat -er tz , °C
• temperature in the internal zone of the heat -er tw , °C
• Constant parameters included:
• vacuum time – 6 s,
• cooling time – 5 s,
• duration and frequency of compressed air im -pulses for separating the finished part from the male mold – 1s, 2 Hz.
• compressed air pressure in the tool stand –
3.3 bar.
The bubble time was maintained constant at the lowest value possible, i.e. at 1 s. The results of preliminary tests reveled that at higher values of bubble time defects (corrugation) occur in the bottom of the finished part. These defects were ob -served in the entire tested range of other variables.
The wall thickness of finished parts was measured at points marked in Fig. 2. The mea -surements were made with an accuracy of 0.001 mm using an electronic micrometer with a flat or spherical end depending on the measuring point.
The measurements were made in compliance with a rotable central composite design with the star
Fig. 1. Schematic design of the heating design: 1 – internal zone, 2 – external zone, 3 – clamp frame
Fig. 2. Schematic design of the finished part and the measuring points in the longitudinal section A–F and
point distance α set to 1.6818, prepared using Statistica 12. According to the recommendations given in the literature [8], the measurements were repeated six times in the centre point, leading to a total set of 20 runs that are listed in Table 1. The range of independent variables tz, tw and T for the design was determined based on preliminary tests. Regression analysis was used to describe the relationships between the dependent vari -able x and the tested quantity, and the applied independent vari-ables tz, tw, and T by model equation (1).
(1)
The investigated parameters included: the wall thickness of the finished part (g) at the measuring points given in Fig. 2, as well as the distributions of temperatures (tx) and (ty) over the surface of the plastic sheet measured immediately after heating along the lines corresponding to the longitudinal and cross symmetry axes, respectively.
RESULTS AND DISCUSSION
The results of finished parts’ wall thickness at characteristic points demonstrate that the use of bubble has a significant effect on wall thickness of the finished part compared to thermoforming with -out bubble. As a result of bubble, the region of the plastic sheet corresponding to the bottom of the fin -ished part undergoes considerable thinning. In the longitudinal section (Fig. 3) the lowest wall thick -ness is observed at the outside edge (An) and – at longer heating times – in the adjacent region (B). At a short heating time, the smallest wall thickness occurs in the centre of the finished part’s bottom (F). A similar observation was made with respect to the cross section (Fig. 4): with increasing the heat -ing time, wall thickness becomes considerably thin on the outside edge (An’) and the inside edge (Dn’).
The Pareto analysis results demonstrate that wall thickness in the longitudinal section of the finished part at points (A) and (An) is significantly affected
Fig. 3. Wall thickness in the longitudinal section of the finished part at measuring points versus heating time when the temperature of the heater in the external and
internal zones is set to 420°C
Fig. 4. Wall thickness in the cross section of the finished part at measuring points versus heating time
when the temperature in the external and internal zones is 420°C
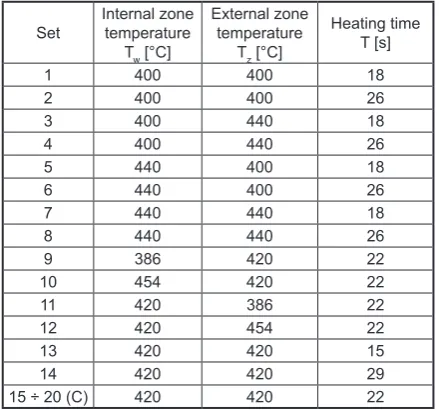
Table 1. Independent variables
Set Internal zone temperature Tw [°C]
External zone temperature
Tz [°C]
Heating time T [s]
1 400 400 18
2 400 400 26
3 400 440 18
4 400 440 26
5 440 400 18
6 440 400 26
7 440 440 18
8 440 440 26
9 386 420 22
10 454 420 22
11 420 386 22
12 420 454 22
13 420 420 15
14 420 420 29
15 ÷ 20 (C) 420 420 22
Fig. 7. Wall thickness of the finished part (g) at point An versus internal zone temperature (tw) and heating
time (T) at tz = 420oC
Fig. 8. Wall thickness of the finished part (g) at point C versus internal zone temperature (tw) and heating
time (T) at tz = 420 oC
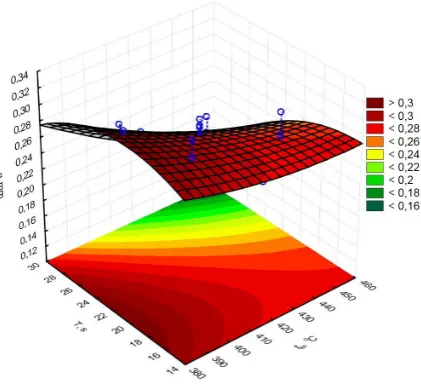
Fig. 9. Wall thickness of the finished part (g) at point E versus internal zone temperature (tw) and heating
time (T) at tz = 420oC
Fig. 10. Wall thickness of the finished part at point F versus internal zone temperature (tw) and heating time
(T) at tz = 420oC
Fig. 5. Pareto analysis results versus wall thickness at
the wall thickness at points (D) and (Dn). The wall thickness of the finished part in the centre of its bot -tom (F) is significantly affected by the internal zone temperature and heating time (Fig. 6).
The effect of the above variables on wall thickness in the longitudinal section of the fin -ished part at selected measuring points is illus -trated in Figures 7 – 10.
At points (A), (An) and (B), the effect of heating time on wall thickness is similar (Fig. 7). The highest wall thickness is observed at the lowest and highest values of the temperature (tw) for the shortest and longest heating time (T), respectively.
A different trend can be observed for the wall thickness at point C located in the centre of the side wall(Fig. 8). The highest value of wall thick -ness can be observed at the highest internal zone temperature (tw) and a heating time of 22s. With increasing the heating time (T), and particularly decreasing it with respect to the internal zone
temperature, the wall thickness decreases. With decreasing the temperature (tw), the wall thick -ness at this measuring point decreases, too.
At point (E), the wall thickness decreases at the lowest and highest temperatures (tw) for the shortest and longest heating time (T), respec -tively (Fig. 9). The highest wall thickness can be observed for the middle range of the internal zone temperature (tw), where the impact of changes to the heating time is low. A similar trend can be ob -served at points (D) and (Dn).
The wall thickness of the finished part in the central region of its bottom (F) is the highest at the lowest internal zone temperature (tw) (Fig. 10). The wall thickness decreases with increasing the heating time (T) and the temperature (tw) at the same time.
A Pareto analysis was also undertaken to in -vestigate the effect of the tested variables on the wall thickness of finished parts in the cross sec -tion. The results demonstrate that the heating time and its interaction with the internal zone temperature have a significant effect on the wall thickness at points A’, An’ and B’ (Fig. 11). The wall thickness at point Dn’ is significantly affect -ed by the internal zone temperature and heating time (Fig. 12), while at point D’ it is addition -ally affected by the interaction between these two factors. One can observe that the internal zone temperature alone has a significant impact on the wall thickness at point E’. However, the
Pareto analysis results do not reveal any signifi
-cant effect of the variables on the wall thickness at point (C).
Fig. 11. Pareto analysis results versus wall thickness at point An’
Fig. 12. Pareto analysis results versus wall thickness at point Dn’
Fig. 13. Wall thickness of the finished part (g) at point An’ versus internal zone temperature (tw) and heating
The effect of the variables on the cross-sec -tional wall thickness at selected measuring points is illustrated in Figures 13 ÷ 15.
At points A’, An’ and B’ in the cross sec -tion, the effect of heating time on wall thickness is similar. The observed relationships are also similar to those observed at the corresponding points in longitudinal section. The highest wall thickness is observed at the shortest heating time and low temperatures (tw) (Fig. 13). With increas -ing the heat-ing time, the wall thickness first de -creases and then begins to increase rapidly again, particularly when the heating temperature (tw) is increased, too.
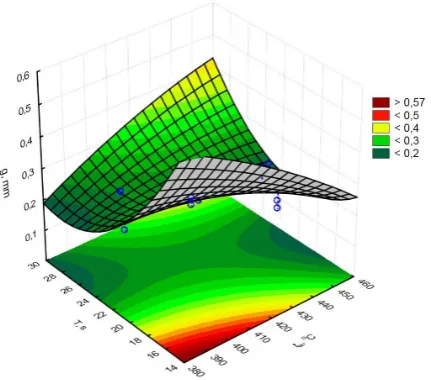
A similar relationship can be observed regard -ing the wall thickness at points D’ and E’ which are adjacent to the edge of the finished part’s bot -tom. A significant reduction in the wall thickness occurs there at the highest values of (tw) and, si -multaneously, at high values of the heating time (Fig. 14). When the heating time is under 22s and the temperature (tw) is lower than 420oC, the wall thickness remains relatively constant.
The relationship observed at point Dn’ is simi -lar to that observed at the adjacent points D’ and E’, yet at Dn’ the variation in the wall thickness can be observed in the entire tested range of (T) and (tw) (Fig. 15). The highest wall thickness can be observed at the shortest heating time. With in -creasing both the heating time and the internal zone temperature (tw), the wall thickness decreases.
CONCLUSIONS
The results of the investigated pressure-bubble vacuum forming for polystyrene sheet demonstrate that heating time and the temperature in the inter -nal zone of the heater have a significant effect on the wall thickness of produced polystyrene finished parts. The effect of the temperature in the heater’s external zone has been found to be statistically insig -nificant, which results from the impact of the above variables on the temperature of the processed plastic which, in turn, affects plasticization and deforma -tion in individual regions of the polystyrene sheet. Another studies demonstrate that the temperature in the external zone of the heater has a limited impact on the distribution of temperature in polystyrene sheet due to location of this zone.
The use of bubble has a positive effect on reducing all thickness non-uniformity between particular regions of the finished part. This results from a significant impact of the plastic sheet’s re -gion corresponding to the finished part’s bottom – in vacuum forming without bubble this region undergoes very little deformation. In the inves -tigated process, the smallest difference in wall thickness amounting to ∆g = 0.186 mm is ob -served for the finished part produced at tw=386oC, tz = 420oC and T = 22s. The highest difference in wall thickness, ∆g = 0.278 mm, is observed for the finished part produced at tw = tz = 420oC and T=15 s. In the process without bubble, the varia -tions in wall thickness of finished part were much higher and ranged from ∆g = 0.279 ÷ 0.465 mm.
The problem of optimization of process con -ditions of vacuum forming with and without bub -ble will be discussed in a separate publication.
Fig. 14. Wall thickness of the finished part (g) at point E’ versus internal zone temperature (tw) and heating
time (T) (at tz = 420oC)
Fig. 15. Wall thickness of the finished part (g) at point Dn’ versus internal zone temperature (tw) and heating
REFERENCES
1. Engelmann, S.: Advanced Thermoforming: Meth
-ods, Machines and Materials, Applications and Automation, John Wiley & Sons, UK. Chichester 2012. DOI: 10.1002/9781118207086.ch31. 2. Haihong Xu H., Kazmer D.O.: Thermoforming
shrinkage prediction. Polymer Engineering & Science 2001, 41, 9, 1553–1563. DOI: 10.1002/ pen.10854.
3. Hosseini H., Vasilivich Berdyshev B.: A So
-lution for the Rupture of Polymeric Sheets in Plug-Assist Thermoforming. Journal of Poly
-mer Research 2006, 13, 329. DOI: 10.1007/ s10965-006-9042-1.
4. Hosseini H., Berdyshev B.V., Mehrabani-Zeinabad A.: Dynamic characteristics of plug-assist thermo
-forming process. Polymer Engineering & Science 2009, 49, 2, 240–243. DOI: 10.1002/pen.21245. 5. http://www.pex.biz.pl, technical documentation
PEX B-3 F.
6. Klein P.W.: Fundamentals of plastic thermoform
-ing, Synthesis lectures on materials engineeer-ing, Morgan & Claypool Publishers, 2009.
7. Min S.C., Zhang H.Q., YANG H.: Thermoformed container wall thickness effects on orange juice quality. Journal of Food Processing and Preserva
-tion 2011, 35, 6, 758–766. DOI: 10.1111/j.1745-4549.2011.00526.x.
8. Montgomery D.C.: Design and Analysis of Experi
-ments 7 th. ed., Wiley&Sons 2009.
9. Nam G.J., Lee J.W., Ahn K.H.: Three-dimensional simulation of thermoforming process and its com
-parison with experiments. Polymer Engineering & Science 2000, 40, 10, 2232–2240. DOI: 10.1002/ pen.11355.
10. Raurí McCool R., Martin P. J.: The role of process parameters in determining wall thickness distri
-bution in plug-assisted thermoforming. Polymer Engineering & Science 2010, 50, 10, 1923–1934. DOI: 10.1002/pen.21718.
11. Schwarzmann P.: Thermoforming - A Practical Guide, Carl Hanser Verlag, Munich 2001.
12. Sykutera D., Pepliński K.: Zastosowanie programu Ansys-Polyflow do wspomagania wytwarzania opakowań formowanych próżniowo. Inż. Ap. Chem 2011, 50, 3, 73-74.
13. Throne J. L.: Technology of Thermoforming, Han
-ser Publishers, Munich, 1996.
14. Throne J. L.: Understanding thermoforming, Han
-ser Publishers, Munich, 2008.
15. Van Mieghem B., Desplentere F., Van Bael A., Iv
-ens J.: Improvements in thermoforming simulation by use of 3D digital image correlation. eXPRESS Polymer Letters 2015, 9, 119, DOI: 10.3144/ex
-presspolymlett.2015.13.
16. Żenkiewicz M., Szach A., Wybrane problemy termoformowania materiałów polimerowych, Po
-limery 2010, 55, 337-350.