ISSN 2319-7625 (Online) (An International Research Journal), www.chemistry-journal.org
Metal Complexes as Ligand : Binuclear Ni(II) and Cu(II)
Metal Chelates of p-Methylisonitrosoacetophenone
with Alkali Metal Salts
O. P. Gupta and Avinash Kumar
Department of Chemistry, M J K College, Bettiah, Bihar, INDIA.
Email Id :-omprakashgupta794@gmail.com, avinashatishay@gmail.com.
(Received on: January 31, 2015)
ABSTRACT
A number of new binuclear complexes have been synthesised by interaction of stable Ni(II) and Cu(II) metal chelates of
p-Methylisonitro-acetosophenone with Alkali metal salts having general formula[Ma
(p-MeINAP)2MbL] where Ma=Ni(II) or Cu(II),MeINAP = deprotonated
p-Methylisonitrosoacetophenone, Mb= Na+ or K+, L = deprotonated
1-nitroso-2-naphthol and 8-hydroxyquinoline . The IR Spectral studies suggest that the Ni(II) and Cu(II) metal chelates act as ligand and coordination towards alkali metal salts takes place through oxygen atom of oximino group. The diffuse reflectance electronic spectra and magnetic moment values of the metal chelates and binuclear complexes with alkali metal salts indicate the change in geometry during complex formation.
Keywords: p-Methylisonitrosoacetophenone, 1-nitroso-2-naphthol and 8-hydroxyquinoline.
INTRODUCTION
70
In view of the above, it was decided to extend the investigation by a systematic examination of the complexes of Ni(p-MeINAP)2andCu(p-MeINAP)2 with alkali metal salts,
which may be useful in understanding the transport and absorption mechanism of alkali metal ions from soil to plant.
EXPERIMENTAL
Ourusual method of synthesis was to take Ni(p-MeINAP)2 or Cu(p-MeINAP)2 in an
absolute ethanol and to add alkali metal salts to it in 1:1 stoichiometry ratio, usually slight excess of alkali metal salts were taken. The reaction mixture was refluxed with constant stirring on hot plate for about 3 to 4 hours at 600 C. The whole substance went in to solution and subsequently the adducts were precipitated in hot condition during the process of refluxing. They were filtered, washed several times with absolute ethanol and then dried in oven at 800 C.
RESULT AND DISCUSSION
The adducts are stable under dry condition, but decompose on exposure to moisture, as such they were kept in a desiccator over anhydrous Cacl2. The colour, decomposition
temperature and analytical values of these complexes are given in table 1.
INFRARED SPECTRA
Detailed discussion of Infrared spectra, magnetic properties and electronic spectra of binuclear alkali metal adducts have been done to establish their structure and bonding Infrared spectral measurements were made in Nujol mull/KBr disc in the region between 4000-200 cm-1. pertinent IR data for the metal chelates as well as the adducts have been recorded in table 2.
It is evident from the reported19 trinuclear alkali metal adducts with Ni(DMG)2 and
Pd(DMG) that C=N and N-O frequencies of the metal chelates got appreciable shift on the adduct formations.
The C=N frequency of Ni(DMG)2 at 1576cm
-1
shifts to 1580-1590 cm-1 in the alkali metal adducts, and the corresponding C=N frequency of Pd(DMG)2 at 1552cm-1 again shows
the upward trend in its adducts, and are observed at 1560-1572cm-1.
The N-O band of Ni(DMG)2 at 1241 cm-1 shows a downward trend in the alkali
metal adducts (between 1214-1230 cm-1). Similar trend has also been observed for Pd(DMG)2; the ligand N-O vibration at 1259cm-1 shows up at 1206-1212 cm-1 in the
corresponding alkali metal adducts. The other ligand N-O band at 1103cm-1 for Ni2+ and 1091cm-1 for Pd2+, are also slightly changed on their corresponding alkali metal adducts.
of the Ni(SAO)2 observed at 1558 cm -1
in the trinuclear alkali metal adducts and the corresponding C=N of Cu(SAO)2 it 1548 cm
-1
again shows the upward trend in its adducts and are observed at 1560-1580 cm-1. The characteristic absorption of C-O stretching vibration observed at 1020cm-1 and 1030cm-1 in Ni(SAO)2 and Cu(SAO)2 respectively, show
upward shift in the range of 1035 to 1040cm-1 in The alkali metal adducts. The N-O stretching vibration observed at 1220 and 1202cm-1 in Ni (SAO)2 show upward shift to
1230-1245 cm-1 and the corresponding N-O of Cu (SAO)2 at 1193cm-1 also shifts to 1210
-1220cm-1 in the trinuclear alkali metal adducts of the chelates. Table-2 shows the infrared absorption observed in Ni (p-MeINAP)2 and Cu(p-MeINAP)2 metal chelates and its
binuclear derivatives.
The band near 1588 , 1552, and 1170cm-1 in Ni(p-MeINAP)2 and 1588, 1545, and
1174cm-1 in Cu(p-MeINAP)2 have been assigned to the vC=o ,vC=N and vN-o
stretching frequency .In the alkali adducts of metal chelates of Ni(p-MeINAP)2 ,the C=N
frequency shifts to 1565-1595cm-1 and the corresponding C=N frequency of Cu(p-MeINAP)2
shows the same trend in its adducts and are observed at 1555-1590cm-1.
The N-O stretching frequency shows significant higher shift to 1173-1180cm-1 and 1195-1205cm-1 respectively in the binuclear adducts of Ni(p-MeINAP)2 and
Cu(p-MeINAP)2, suggesting the involvement of oxygen atom of N-O group in coordination with
alkali metal ion. Slight change in vc=o absorption band has also been observed in the complexes probably due to change in stereochemistry viz trans from to cis form.
Further, in the low frequency region, the band observed at 486 and 395cm-1 in Ni(p-MeINAP) 2 and 502 and 385 in Cu(p-MeINAP) 2 are assigned to v(M-N) and v(M-O). The
appearance of the additional bands around 375-250cm-1 are probably due to the bridging oxygen metal band and cis-isomeric form of the metal chelates of Ni(p-MeINAP) 2 and Cu(p-MeINAP) 2 in their adducts. These evidences clearly show that adduct
formation is taking place through oxygen atom of N-O group.
Further , in the adducts of alkali metal thiocyanate, the thiocyanate peak appears at 2060 cm-1. The shifting of the vc=N to higher frequency(for KSCN i.e. 2020) suggest coordination. The medium intensity peaks in the region at 1080-1185 cm-1 show that band at region1100 cm-1 has split into two peaks. An extra peak at region 930-935 cm-1has also been spotted. These evidences clearly indicate the presence of coordinated perchlorate in the adducts of alkali metal perchlorate.
MAGNETIC PROPERTY
72
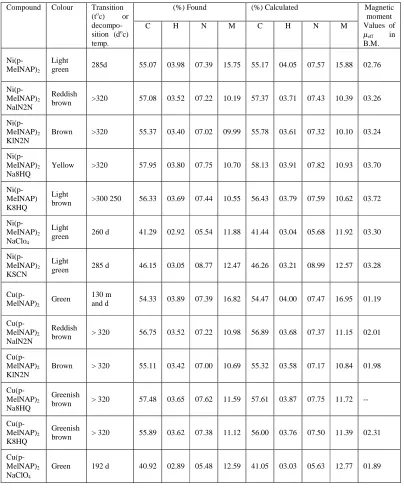
Table 01
Compound Colour Transition (toc) or decompo-sition (doc) temp.
(%) Found (%) Calculated Magnetic moment Values of
ߤeff in
B.M. C H N M C H N M
Ni(p-MeINAP)2
Light
green 285d 55.07 03.98 07.39 15.75 55.17 04.05 07.57 15.88 02.76
Ni(p-MeINAP)2 NalN2N
Reddish
brown >320 57.08 03.52 07.22 10.19 57.37 03.71 07.43 10.39 03.26
Ni(p-MeINAP)2 KlN2N
Brown >320 55.37 03.40 07.02 09.99 55.78 03.61 07.32 10.10 03.24
Ni(p-MeINAP)2 Na8HQ
Yellow >320 57.95 03.80 07.75 10.70 58.13 03.91 07.82 10.93 03.70
Ni(p-MeINAP) K8HQ
Light
brown >300 250 56.33 03.69 07.44 10.55 56.43 03.79 07.59 10.62 03.72
Ni(p-MeINAP)2 NaClo4
Light
green 260 d 41.29 02.92 05.54 11.88 41.44 03.04 05.68 11.92 03.30
Ni(p-MeINAP)2 KSCN
Light
green 285 d 46.15 03.05 08.77 12.47 46.26 03.21 08.99 12.57 03.28
Cu(p-MelNAP)2 Green
130 m
and d 54.33 03.89 07.39 16.82 54.47 04.00 07.47 16.95 01.19
Cu(p-MelNAP)2 NalN2N
Reddish
brown > 320 56.75 03.52 07.22 10.98 56.89 03.68 07.37 11.15 02.01
Cu(p-MelNAP)2 KlN2N
Brown > 320 55.11 03.42 07.00 10.69 55.32 03.58 07.17 10.84 01.98
Cu(p-MelNAP)2 Na8HQ
Greenish
brown > 320 57.48 03.65 07.62 11.59 57.61 03.87 07.75 11.72 --
Cu(p-MelNAP)2 K8HQ
Greenish
brown > 320 55.89 03.62 07.38 11.12 56.00 03.76 07.50 11.39 02.31
Cu(p-MelNAP)2 NaClO4
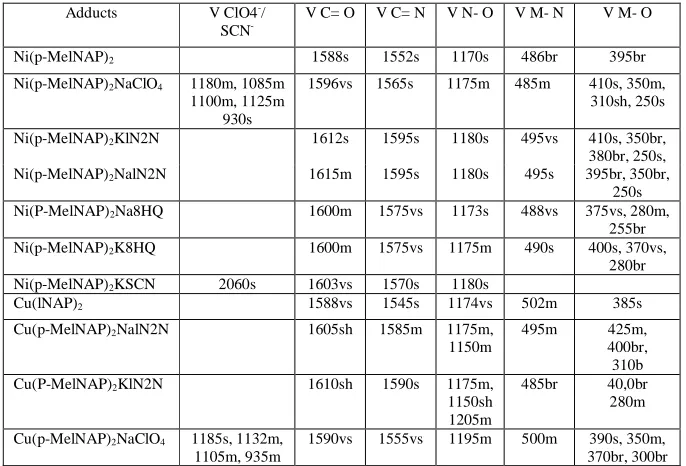
Table 2
IR absorption bands in cm-1
Adducts V ClO4-/
SCN- V C= O V C= N V N- O V M- N V M- O Ni(p-MelNAP)2 1588s 1552s 1170s 486br 395br Ni(p-MelNAP)2NaClO4 1180m, 1085m
1100m, 1125m 930s
1596vs 1565s 1175m 485m 410s, 350m, 310sh, 250s
Ni(p-MelNAP)2KlN2N 1612s 1595s 1180s 495vs 410s, 350br, 380br, 250s, Ni(p-MelNAP)2NalN2N 1615m 1595s 1180s 495s 395br, 350br,
250s Ni(P-MelNAP)2Na8HQ 1600m 1575vs 1173s 488vs 375vs, 280m,
255br Ni(p-MelNAP)2K8HQ 1600m 1575vs 1175m 490s 400s, 370vs,
280br Ni(p-MelNAP)2KSCN 2060s 1603vs 1570s 1180s
Cu(lNAP)2 1588vs 1545s 1174vs 502m 385s Cu(p-MelNAP)2NalN2N 1605sh 1585m 1175m,
1150m
495m 425m, 400br, 310b Cu(P-MelNAP)2KlN2N 1610sh 1590s 1175m,
1150sh 1205m
485br 40,0br 280m
Cu(p-MelNAP)2NaClO4 1185s, 1132m, 1105m, 935m
1590vs 1555vs 1195m 500m 390s, 350m, 370br, 300br
74
geometrical isomers varying proportions. Thus, a large number of Ni(II), complexes display anomalous magnetic moment values. Haldar et al.34 reported the µeff value 2.76 at 293
o
k for the complex, Ni(INAP)2, which are very close to the spin any value for two unpaired
electrons in octahedral Ni(II) complexes.
They also showed that the magnetic moment of the Ni(INAP)2,complex vary from
2.76 B.M. at 293ok to 1.98 B.M. at 80ok, indicating antiferromagnetic interaction. The temperature independent paramagnetism (Nα) was also calculated and on the basis of above observations, the dimeric nature of the Ni(II) complex was proposed. A similar behaviour was also observed by Lintvedt et al.35
In the present investigation, the binuclear alkali metal adducts of Ni(p-MeINAP)2
possess room temperature magnetic moment values between 3.24 and 3.70 B.M., which are higher than the reported values for most of the octahedral Ni(II) complexes, but occur in the range of µeff values reported for tetrahedral complexes.
The majority of the copper(II) complexes display magnetic moment values in the range of 1.75 to 2.20 B.M., while the magnetic moment values of some Cu(II) complexes are substantially below the spin only values (1.73 B.M.) and remarkably temperature dependent.
The complexes, which have magnetic moment values lower than the spin only value, are termed as magnetically subnormal complexes. In such complexes, the pairs or copper(II) atoms are held together by bridging halogens, hydroxo and carboxylate groups or ligand molecules36-37. In the extreme cases, copper(II) ions are so closely coupled that the dimers become diamagnetic37-38. In such dimers the unpaired electron of each copper(II) atom interacts with the other and the interaction is so effective that almost pure α bond results between the two copper atoms, rendering negligible magnetic moment contribution to those copper(II) complexes. Polymeric copper(II) complexes also display subnormal magnetic moment values for the same reason. Copper(II) complexes whose magnetic moment values lie between 1.75 and 2.2 B.M. are termed as magnetically dilute complexes and their magnetic moment values are independent of temperature. A qualitative picture of the geometries, emerging from the range of magnetic moment valves of the planar Cu(II) complexes is not always valid. The magnetic moment valves of the planar complexes occur in the vicinity of spin only value(1.73 B.M.), while the room temperature magnetic moment valves of tetrahedral and octahedral copper(II) complexes occur between 1.88 and 2.2 B.M.
In the present investigation the magnetic moment of Cu(p-MeINAP)2 has been found
to be 1.19 B.M. at room temperature. Which is markedly lower than the spin only value of 1.73 B.M.
Similar subnormal value was also observed by Natrajan et al.39 and
suggested that this lower magnetic moment value is due to antiferromagnetic interaction and this may arise through molecular associations involving oxobridges. The binuclear alkali metal salt adducts of Cu(p-MeINAP)2 display magnetic moment values between 1.89 to 2.31
ELECTRONIC SPECTRA
All diffuse reflectance electronic spectra were recorded on SHIMADZU UV-VIS-160A spectrophotometer in Nujol mull/Paraffin solvent. The bands observed in electronic spectra of Ni(p-MeINAP)2 and Cu(p-MeINAP)2 and their adducts are given in Table – 3.
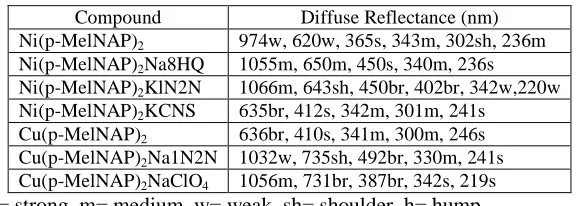
Table - 3
Major diffuse reflectance bands (nm) for Ni(p-MelNAP)2/Cu(p-MelNAP)2
Complex and its alkali metal adducts.
Compound Diffuse Reflectance (nm)
Ni(p-MelNAP)2 974w, 620w, 365s, 343m, 302sh, 236m
Ni(p-MelNAP)2Na8HQ 1055m, 650m, 450s, 340m, 236s
Ni(p-MelNAP)2KlN2N 1066m, 643sh, 450br, 402br, 342w,220w
Ni(p-MelNAP)2KCNS 635br, 412s, 342m, 301m, 241s
Cu(p-MelNAP)2 636br, 410s, 341m, 300m, 246s
Cu(p-MelNAP)2Na1N2N 1032w, 735sh, 492br, 330m, 241s
Cu(p-MelNAP)2NaClO4 1056m, 731br, 387br, 342s, 219s
br= broad, s= strong, m= medium, w= weak, sh= shoulder, h= hump
The electronic spectra of Ni(p-MeINAP)40 complexes in Nujol display bands in region 236-365 nm due to charge transfer. The band at 620nm and 970nm are assigned to the first and second spin allowed transition 3A2g->
3
T1g(F) and 3
A2g-> 3
T2g(F) respectively,
characteristic of Ni(II) in an octahedral environment. The 3A2g(F)->3T1g(P) transition could
not be observed owing to a very strong charge transfer band tailing into the visible region41. The spectra of binuclear adducts are different in nature and the band usually observed in the region 635-650nm may be assigned 3T1 (F) ->
3
T1(P) transition 42
. Lower energy bands due to the transition 3T1 (F) ->3A2(F) and3T1 (F) could not be recorded in few cases due to
limitations of the instrument. Hence the nature of absorption band of alkali metal adducts suggests that octahedral structure of Ni(p-MeINAP)2 has probably been converted into
tetrahedral structure, this fact is also supported by magnetic moment studies.
The electronic spectra of the Cu(p-MeINAP)2 complexin chloroform exhibit a broad
envelope centred in the region 636 nm. This may arise from a combination of at least two transitions for tetragonal complexes of Cu(II)43. Charge transfer bands also appear in the region 246-410nm.
Sacconi and Ciampolini44 have examined the spectra of a number of Cu(II) complexes and found that the ligand field absorption bands in the region 600-1250nm, shift to higher wave length as the environment about the copper atoms, tends from octahedral/tetragonal/planar to tetrahedral.
1032-76
CH3
CH3
1056nm. Hence, the change in the position and intensity of the absorption bands indicates the adduct formation as well as change in the geometry from tetragonal to tetrahedral.
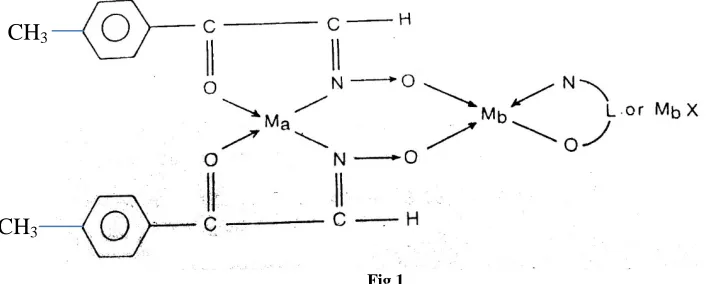
CONCLUSIONS (STRUCTURE AND BONDING)
On the basis of elemental analysis, the molecular formula of binuclear alkali metal adducts has been suggested as [Ma(p-MeINAP)2 .MbL] and [Ma(p-MeINAP)2.Mbx] for alkali
metal adducts where Ma is Ni ++
or, Cu++ and Mb =Li +,
Na+, K+,L is deprotonated l-nitroso-2-naphthol and 8-hydroxyquinoline, X=ClO-4, SCN-.
The infrared spectral studies of these adducts, suggest that Ma(p-MeINAP)2 acts as a Lewis base to the Lewis acid (alkali metal salt); coordination is through hard oxygen atoms.
The bonding between the bis-p-Methylisonitrosoacetophenonato complexes, Ma
(p-MeINAP)2 and the alkali metals, most likely occur by dative bonding via the oximino
oxygen atoms of the ligand which has been supported by the I.R. spectra.
The magnetic properties and electronic spectral studies also support the change in stereochemistry in the adducts of alkali metal salts. The structure and bonding of the newly prepared bridged complexes is shown in fig. 1 .
Fig 1
Where Ma = Cu ++
, Ni++ Mb=Li +
, Na+, K+ L = deprotonated 8HQ or IN2N X=CIO-4, SCN -
ACKNOWLEDGEMENT
REFERENCES
1. Esinn and CM Harris. Coord Chem. Rev. 4, 391(1969).
2. S J Gruber, Esinn and CM Harris. Inorg. Chem. 7, 268 (1968). 3. S J Gruber, Esinn and CM Harris. Inorgnucl Chem. 30, 1805 (1968). 4. C Floriani et al. J. Chem Soc (Dalton), 2310 (1976).
5. L G Armstrong H C Lip, L F Lindoy, M McPartlin& P A Tasker. J Chem Soc., 1771 (1977)
6. C Floriani et al. Inorg. Chem 18, 3469 (1979).
7. D E Fenton & S E Gayda. J. Chem Soc. (Dalton), 2095 (1977). 8. D E Fenton et al. J. Chem. Soc. Commun, 39 (1979).
9. N B O Bryan, D O Mainer, I C Paul and R S Drago. J. Am Chem Soc 95, 6640 (1073). 10. D L Hughes et al. J. Chem. Soc (Dalton), 1239 (1982).
11. A K Banerjee, Dharmbir Prasad, & S K Roy. J. Indian Chem. Soc 59, 1303 (1982). 12. A K Banerjee, Monojit K Ghosh, S K Sinha & S K Roy. J. Indian Chem. Soc 62, 272
(1985).
13. A K Banerjee, BasadiMahapatra, & S K Roy. J. Indian Chem. Soc 62, 778 (1985). 14. A K Banerjee, Sheo Satya Prakash, & S K Roy. J. Indian Chem. Soc 62, 818 (1985). 15. A K Banerjee, Sheo Satya Prakash, & S K Roy. J. Indian Chem. Soc 63, 515 (1986). 16. A K Banerjee, Sheo Satya Prakash, & S K Roy. J. Indian Chem. Soc 64, 53 (1987). 17. A K Banerjee, Sheo Satya Prakash, & S K Roy. J. Indian Chem. Soc 64, 09 (1987). 18. A K Banerjee, Sheo Satya Prakash, & S K Roy. J Indian Chem. Soc 65, 378 (1988). 19. S. S. Prakash. Ph.D Thesis Patna University (1977).
20. M K Ghose . Ph. D Thesis PatnaUniversity(1990).
21. B. N. Figgis and R. S. Nyholm. Prog. Inorg. Chem. Ed. F. A. Cotton., P. 37 (1964). 22. G. Maki. J. Chem. Phys., 29, 162, 1129 (1959).
23. F. A. Cotton & G. Wilkinson. Advance inorg. Chemistry, Willey Eastern Private Ltd., P. 881 (1972).
24. Y. K. Bhoom. Indian J. Chem., 22A, 430 (1983).
25. S. L. Holf, Jr., R. J. Bouchard and R. K. Carloin. J. Amer. Chem. Soc., 86, 519
(1964).
26. F. A. Cotton & J. P. Fackler. J. Amer. Chem. Soc., 83, 2818, 3775 (1961). 27. M. Ciampolini. Inorg. Chem., 5, 35, 41, 45, (1966).
78
36. R.L. Martin & H. Waterman. J. Chemsoc., 2545 (1967).
37. M. Mishita, M.inoue and M.kubo. Inorg. Chem., 3,237,239(1964). 38. Norita. Soumen., Kem., 33,161(1960).
39. C. Natarajan and A. Nazeer Hussain. Indian J. Chem. Sect. A, 22A (6), 527 (1983). 40. T. Masuda, M. Tamaki and K. Sinha. Bull Chem. Soc. Japan, 42, 157 (1969). 41. A. B. Lever, J. Lewis. J. Chem. Soc., 4761 (1964).
42. B. N. Figgis. Introduction to Ligand Filed, Willey Eastern Limited, Page 241. 43. I. Collamati & G. Ercolani . J. Chem. Soc. A, 1541 (1969).