INTRODUCTION
Environmental Geo-technology is emerging as an interdisciplinary science, aiming at fore-casting, analyzing and solving the geotechnical pro-blems involving the influence of environmental factors1. Absorption of gaseous pollutants released during volcanic eruptions and industrial exhausts reduces the pH2. Although the H+ content of acid rain falling for a short duration is very low yet its influence on the physical, chemical and engineering properties of soil will be alarming in near future as ever growing industrialization/
Effect of the Intensity of the Acid Rain on the
Geotechnical Properties of Soils of Diferent Plasticity
P. SHARMA¹*, S. VYAS¹, M. KAUSHAL², N.V.MAHURE¹,
N. SIVAKUMAR¹ and M. RATNAM¹
¹Central Soil and Materials Research Station, Olof Palme Marg, N. Delhi - 110 016 (India). ²Department of Civil Enginnering Singhania University, Rajasthan (India)
*Corresponding author: E-mail: [email protected]
(Received: November 20, 2011; Accepted: December 27, 2011)
ABSTRACT
Acidification of rain is caused by air pollutants like sulfur dioxide and oxides of nitrogen etc. which reduces its pH as low as 4. Although the H+ concentration of acid rain falling for a short
duration is very low in comparison to cation exchange capacity of soil yet its effect on the physical, chemical and engineering properties of soil cannot be ignored. Ever growing industrialization/ pollution will increase frequency, persistence and intensity of acid rain. This will certainly enhance the rate of leaching of cations from the soil to a great extent. Absorption of H+, SO
4 2-, NO
3 - and CO
3
2-by the soil particles will alter its physical, chemical and engineering properties. Therefore it is imperative to examine the properties of soils eroded due to acid rain in order to augment understanding of its influence on geotechnical engineering particularly when used in fields, embankment or in earthfill dams. Objective of this study was to find degree of variation in the texture, physico-chemical and the engineering properties of soil of different plasticity when exposed to acid rains having different pH. Soil samples were collected and acidified with varying probable simulated strength of acid rain equivalent to normality 0.005N, 0.01N, 0.02N and 0.04N of H2SO4 or HNO3. The consistency, strength and chemical characteristics of the samples were determined for the soil fraction passing 425 µm sieve. The acidification causes de-flocculation of soil particles which directly affects the consistency as well as strength properties of the soil. The paper presents the observed degree of variation in these properties under varying strengths of acid rain.
Key words: Environment, Consistency, Physico-Chemical, Angle of internal resistance, Cation exchange capacity.
pollution will keep on substantially decreasing its pH. The enhanced rate of leaching of cations and absorption of H+, SO
4 2-, NO
3
- and CO 3
EXPERIMENTAL Materials
The soil samples used in this study were obtained from Indore, M.P. (Sample A) and Nagpur, Maharashtra, (Sample B). The samples were oven dried & sieved using 4.75 mm IS sieve. The down size material was used for further experimental work. The consistency, strength and chemical characteristics of the samples were determined for the soil fraction passing 425 µm sieve. The results are summarized in Table 1.
Experimental Methods
1 kg of each soil sample was separately shaken for 8 hours with 1 liter of H2SO4 and HNO3 of 0.005N, 0.01N, 0.02N and 0.04N strengths as detailed in table 2. These samples were then kept undisturbed over night. The treated samples were then filtered and air dried. These samples were then used to find their consistency, strength and chemical properties as per Bureau of Indian Standards5-7.
RESULTS AND DISCUSSION Soil Texture
The soil samples were analyzed before and after acid treatment using scanning electro microscope (SEM) for finding the texture of the soil crystals. The SEM observation for the original samples A & B are presented in Fig. 1. The SEM observation for Sample A & B treated with 0.005N H2SO4 & HNO3 are presented in Fig. 2. It is observed that angularity of the particles is increased which
can be attributed to leaching of the cations and subsequent deflocculation. The degree of variation increases as the strength of acid rain increases.
Mechanical Analysis
The results of mechanical analysis of the soil samples before and after acid treatment are presented in Table 3. The results clearly show that as intensity of acidification increases the deflocculation of soil particles which predominantly increase the percentage of silt and clay size particles.
Table 2: Details of sample designation
S. No. Description Strength of acid Designation
1. Original Soil Sample + 1 lit Distilled Water (DW) DW A B
2. 1 kg Soil + 50 ml 0.1 N H2SO4 + 950 ml DW 0.005 N AS-1 BS-1
3. 1 kg Soil +100 ml 0.1 N H2SO4 + 900 ml DW 0.01 N AS-2 BS-2
4. 1 kg Soil + 200 ml 0.1 N H2SO4 + 800 ml DW 0.02 N AS 3 BS 3
5. 1 kg Soil + 400 ml 0.1 N H2SO4 + 600 ml DW 0.04 N AS-4 BS-4
6. 1 kg Soil + 50 ml 0.1 N HNO3 + 950 ml DW 0.005 N AN-1 BN-1
7. 1 kg Soil + 100 ml 0.1 N HNO3 + 900 ml DW 0.01 N AN-2 BN-2
8. 1 kg Soil + 200 ml 0.1 N HNO3 + 800 ml DW 0.02 N AN-3 BN-3
9. 1 kg Soil + 400 ml 0.1 N HNO3 + 600 ml DW 0.04 N AN-4 BN-4
Table 1: Characteristics of original samples A and B
Characteristic Sample
A B
Liquid limit (WL ) % 67.30 37.50
Plastic limit (WP ) % 26.39 20.30
Plastic Index (Ip) % 40.91 17.20
Shrinkage limit % 6.18 15.29
Free Swell Index % 66.57 48.62
Particles finer than 0.002mm % 22.90 13.20 Particle 0.002mm-0.075mm % 47.70 57.50 Particle 0.075mm-0.425mm % 26.10 23.80 Particle 0.425 mm-2.00 mm % 2.20 3.40 Particle 2.00 mm - 4.75 mm % 1.10 2.10
pH 7.11 6.80
Organic Matter % 0.70 0.54
Effective Cohesion c (kg./cm2) 0.45 0.31
Table 3: Results of Grain size Analysis of soil before and after acid treatment
Soil Particle Size (mm)
Sample Below 0.002 0.002 to 0.075 0.075 to 0.425 0.425 to 2.0 2.0 to 4.75
(%) (%) (%) (%) (%)
A 22.90 47.70 26.10 2.20 1.10
AS - 1 24.00 53.60 20.80 1.10 0.50
AS - 2 25.30 57.40 14.60 1.80 0.90
AS - 3 26.40 57.80 13.70 1.30 0.80
AS - 4 26.70 59.10 12.30 1.10 0.80
AN - 1 25.80 51.40 20.90 0.90 1.00
AN - 2 26.60 57.40 13.30 1.80 0.90
AN - 3 27.40 59.50 10.30 1.90 0.90
AN - 4 28.60 57.90 10.90 1.80 0.80
B 13.20 57.50 23.80 3.40 2.10
BS - 1 14.10 60.30 20.60 3.10 1.90
BS - 2 15.80 61.50 18.20 2.90 1.60
BS - 3 16.30 63.90 15.90 2.60 1.30
BS - 4 17.00 65.70 14.20 2.00 1.10
BN - 1 14.60 60.50 19.90 3.00 2.00
BN - 2 16.20 62.60 16.80 2.60 1.80
BN - 3 17.10 64.20 14.90 2.40 1.40
BN - 4 17.60 65.30 13.80 2.10 1.20
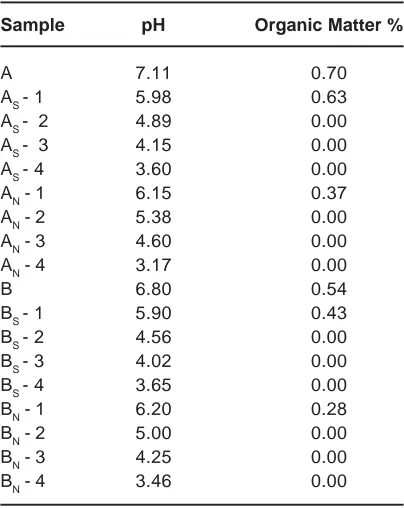
Table 4: Physico-Chemical Properties of soil samples before and after acid treatment
Sample pH Organic Matter %
A 7.11 0.70
AS - 1 5.98 0.63
AS - 2 4.89 0.00
AS - 3 4.15 0.00
AS - 4 3.60 0.00
AN - 1 6.15 0.37
AN - 2 5.38 0.00
AN - 3 4.60 0.00
AN - 4 3.17 0.00
B 6.80 0.54
BS - 1 5.90 0.43
BS - 2 4.56 0.00
BS - 3 4.02 0.00
BS - 4 3.65 0.00
BN - 1 6.20 0.28
BN - 2 5.00 0.00
BN - 3 4.25 0.00
BN - 4 3.46 0.00
Physico-Chemical Properties
On treating the soil samples with different concentrations of H2SO4 or HNO3 the physico-chemical properties of the soil samples got changed. The results are presented in Table 4. The pH of the samples reduced as the concentration of the acid increased. On acid treatment, the organic matter got digested and thereby its percentage reduced.
Consistency Characteristics
Table 5: Results of Consistency Characteristicsof soil samples before and after acid treatment
Sample WL,% WP% Ip% Shrinkage limit,% Free Swell Index%
A 67.30 26.39 40.91 6.18 66.67
AS - 1 61.00 24.70 36.30 8.11 53.00
AS - 2 59.20 23.40 35.80 8.30 52.00
AS - 3 56.20 23.20 32.98 9.20 51.00
AS - 4 55.40 22.27 31.30 9.58 49.00
AN - 1 65.80 25.80 40.00 6.11 60.00
AN - 2 62.80 24.60 38.20 7.30 58.00
AN - 3 56.80 23.30 33.50 8.40 54.00
AN - 4 54.20 22.00 32.20 10.20 52.00
B 37.50 20.30 17.20 15.29 48.62
BS - 1 34.20 19.10 15.10 17.22 42.60
BS - 2 33.80 18.90 14.90 18.10 41.20
BS - 3 31.80 17.60 14.20 19.30 40.40
BS - 4 30.60 17.00 13.60 19.90 39.60
BN - 1 34.60 19.60 15.00 19.41 41.90
BN - 2 33.10 18.60 14.50 20.40 38.70
BN - 3 31.90 17.90 14.00 21.20 35.20
BN - 4 30.60 17.10 13.50 21.90 33.80
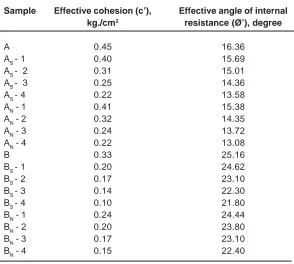
Table 6Strength Characteristicsof soil samples before and after acid treatment
Sample Effective cohesion (c’), Effective angle of internal kg./cm2 resistance (Ø’), degree
A 0.45 16.36
AS - 1 0.40 15.69
AS - 2 0.31 15.01
AS - 3 0.25 14.36
AS - 4 0.22 13.58
AN - 1 0.41 15.38
AN - 2 0.32 14.35
AN - 3 0.24 13.72
AN - 4 0.22 13.08
B 0.33 25.16
BS - 1 0.20 24.62
BS - 2 0.17 23.10
BS - 3 0.14 22.30
BS - 4 0.10 21.80
BN - 1 0.24 24.44
BN - 2 0.20 23.80
BN - 3 0.17 23.10
Sample A Sample B
Fig. 1: SEM Observation for original sample A and B
Sample AS-1 Sample AN-1
Sample BS-1 Sample BN-1
Sample AN-1 Sample AN-2
Sample AN-3 Sample AN-4
Fig. 3: SEM Observation for Sample A treated with 0.005N, 0.01N, 0.02N and 0.04N HNO3 in values of shrinkage limit is attributed to increase
in inter particulate distances due to reduction in the forces between soil particles.
Strength Characteristics
The strength characteristics of soil are affected extensively by soil’s internal structure and interaction between soil particles. The strength of soil originates mainly from the soil skeleton and electric attractive force between the electric charges absorbed by the soil particles. The results of the effective cohesion (c’), kg/cm2 and Effective angle of internal resistance (Ø’), degree for untreated and acid treated soil samples is presented in Table 6. The values of effective cohesion (c’) and Effective angle of internal resistance (Ø’) are observed to be
lesser for acid treated soil samples. This is mainly due to reduction in the electric forces as concentration of exchangeable cations reduced on acid treatment.
Further research
CONCLUSION
Acid rain results in changes in physico-chemical characteristics of soil due to cations exchange. pH of the soil decreases while the concentration of absorbed H+ and SO
4
2- increases. Grain size distribution of the soil will shift towards finer fractions when subjected to acid rain. Acid rain affects the consistency properties of different soils. Leaching of cations will reduce the attractive forces between the soil particles which will lower the overall strength of the soil. The data obtained during the experiments is useful in gauging the damages to the soil that could occur due to the acid rain in
future. However the magnitude of the deterioration will depend on persistence and strength of acid rain.
ACKNOWLEDGEMENTS
The authors extend their sincere thanks to Dr. R.K. Parashar, Associate Prof. NCERT and Mrs. Abha Sharma for valuable suggestions extended by them. Timely help extended by Sh. Devender Singh and Sh. Anil Vashisht of CSMRS are gratefully acknowledged. We also extend our sincere gratitude to all the authors whose publications provided us directional information from time to time.
REFERENCES
1. Manassero M and Deangeli C, Education in Environmental Geotechnics, Proceedings of Indian Geotechnical Conference, Vol. 2, Allahabad, India, 840–848 (2002). 2. Chandrawanshi C K, Patel V K and Patel K
S, Acid Rain in Korba City of India, IJEP 17(11): 656-651 (1997).
3. Kamon Masashi, Ying Changyun and
Katsumi Takeshi, Effect of acid rain on physico-chemical and engineering properties of soils, Japanese Geotechnical Society, 37(4): 23-32 (1997).
4. Yamaguchi H, Ui M, Fukuda M and
Kuroshima I, Change in environmental
properties of soils taking acid rain into consideration, Tsuchi-to-Kiso, 41(6): 47-52 (1993).
5. IS 2720 Part 3 to Part 17 and Part 21 to Part 27, Methods for Testing of Soils.
6. S.P. 36 (Part I) — Bureau of Indian Standards, Compendium of Indian Standards on Soil Engineering - Laboratory Testing of Soils for Civil Engineering Purposes, pp. 23–350 (1987).