ISSN: 2306-9007 Hung, Zhaojun & Thang (2014) 2070
I
www.irmbrjournal.com December 2014I
nternationalR
eview ofM
anagement andB
usinessR
esearchVol. 3 Issue.4
R
M
B
R
Moving Average Trading Rules: Are They Trending Following
Devices? Evidence from the Vietnamese Stock Market
NGUYEN HOANG HUNG
School of Finance and Statistics, Hunan University, China
Department of Finance and Banking, Industrial University of Ho Chi Minh City, Vietnam
Email: subhoanghung@yahoo.com
YANG ZHAOJUN
Professor of Finance and StatisticsSchool of Finance and Statistics, Hunan University, China
LE DUC THANG
School of Finance and Statistics, Hunan University, China
Department of Finance and Banking, Industrial University of Ho Chi Minh City, Vietnam
Abstract
A moving average is essentially, by its nature, a trend-following device; therefore, it works well only in a market where a trend is clear. We consider two issues in this paper. One is whether moving average trading rules can be applied to Vietnamese stock market data to forecast stock price movements and to outperform a simple buy-and-hold strategy. The other is whether the predictability of variable moving average (VMA) trading rules is stronger in a trending market than in a non-trending one. We show that in the frontier market like Vietnamese market, technical trading rules are not only substantially profitable, but, unlike some prior studies on the emerging markets, they are also effective to generate excess returns for investors – even after taking transaction costs into account. Notably, we found arguments that explain why VMA rules perform better in a trending market than they do in a non-trending one.
Key Words: Variable Moving Averages, Technical Trading Rules, Excess Returns, Transaction Costs,
Trading Range Breakout.
Introduction
Since the mid-1980s, through the “Doi Moi” reform period, the Vietnamese economy has quickly integrated into the global economy. Over that period, Vietnam has experienced rapid growth, became a leading agriculture exporter and served as an attractive destination for foreign investment in Southeast Asia. According to a forecast by Goldman Sachs (2005), the Vietnamese economy will become the 16th largest economy and rank 14th in the world for nominal GDP per capita by the year 2050(1). Similarly, a forecast by PricewaterhouseCoopers (2008) predicts that Vietnam may be one of the fastest growing emerging economies by the year 2050, with a potential average annual growth rate of approximately
ISSN: 2306-9007 Hung, Zhaojun & Thang (2014) 2071
I
www.irmbrjournal.com December 2014I
nternationalR
eview ofM
anagement andB
usinessR
esearchVol. 3 Issue.4
R
M
B
R
8.8%(2) in real dollar terms, which would increase the size of the economy to 70%(3) of that of the U.K., in PPP terms. With the economy’s impressive growth rate, the Vietnamese equity market was established in
2000 when the Ho Chi Minh Stock Exchange (HOSE) began with two listings(4). Since then, it has grown
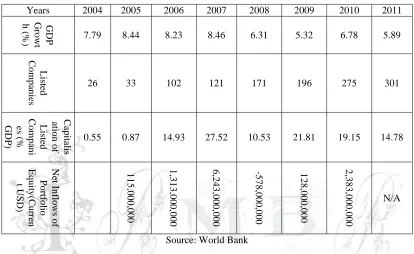
tremendously, surging to 650 listings and a market capitalisation in excess of $30 billion in 2012(5). Table 1 highlights some primary economic indicators of the Vietnamese economy from 2004 to 2011.
Table 1: Vietnamese Market Indicators
Source: World Bank
According to table 1, the economic indicators of Vietnam have improved tremendously. Along with a very high economic growth rate of approximately 7% per annum since the mid-1980s, the number and the capitalisation of listed companies skyrocketed from 26 to 301 and from 0.55% to 14.78% of GDP, respectively. Consequently, the net inflows of portfolio equity into Vietnam reached an impressive record of more than $6 billion in 2007. Although the economy’s growth has fluctuated slightly, it has remained at
the 7% average and even reached 8.46% in 2007, which was the second highest in the region after China.(6)
The numbers of listed companies increased annually and reached 301 in 2011. However, the aggregate capitalisation of the Vietnamese market, as a percentage of GDP, did not have a similar increase. This was because the Vietnamese market had been bearish between 2007 and 2011. Specifically, the aggregate capitalisation of the market grew from 0.55% of GDP in 2004 to a peak of 27.52% in 2007 and then suddenly dropped to 10.53% of GDP in 2008, followed by a rebound back to 21.81% of GDP in 2009. After 2009, the capitalisation of listed companies slowly fell to 19.15% of GDP in 2010 and 14.78% in 2011.
2 PricewaterhouseCoopers, The World In 2050, P.20, table 5.
3 PricewaterhouseCoopers, The World 2050, P.9, table 1, Calculated.
4 Two listings are GMD and REE.
5
Available at http://www.vietnamam.com/vietnam/vietnam-overview
6 China’s growth rate was 14.2% in 2007. Source: World Bank.
Years 2004 2005 2006 2007 2008 2009 2010 2011
GDP Gr o wt h (
%) 7.79 8.44 8.23 8.46 6.31 5.32 6.78 5.89
L is ted C o m p an
ies 26 33 102 121 171 196 275 301
C ap italis atio n o f L is ted C o m p an i es ( % GDP)
0.55 0.87 14.93 27.52 10.53 21.81 19.15 14.78
ISSN: 2306-9007 Hung, Zhaojun & Thang (2014) 2072
I
www.irmbrjournal.com December 2014I
nternationalR
eview ofM
anagement andB
usinessR
esearchVol. 3 Issue.4
R
M
B
R
The net inflows of portfolio equity had impressively climbed from USD 115 million in 2004 to a high of over USD 6.2 billion in 2007. However, net inflows were negative in 2008 (USD 578 million in outflows). The negative inflows implied that capital left the country in that year. Fortunately, equity inflows returned back to a positive USD 128 million in 2010 and over USD 2.3 billion in 2011. Despite the recent substantial growth of the Vietnamese stock market, its institutional structure has led some to questions regarding whether it is as informatively efficient as its U.S., European or Asian counterparts. The Vietnamese market has still been a frontier market and dominated by some companies with ownership concentrated in the hands of a small number of investors. The likelihood of insider trading is relatively high. Additionally, the requirements for financial disclosures are less stringent, leading to a scarcity of publicly available information. Finally, the Vietnamese market is characterised by relatively low trading volume and thin trading.
In this paper, we investigate how well variable moving average (VMA) rules predict the Vietnamese market during different trending periods. By definition, VMA rules work well only in a trending market; therefore, we will test whether this specification is true in a real market using Vietnamese data. A considerable amount of research on the predictability of technical trading rules in the emerging markets has been conducted for decades; however, there are no papers examining specially the Vietnamese market which is a frontier one. This paper will be the first in the field. The results of this paper show that the application of VMA trading rules in short-term forecasts is extremely economical in the Vietnamese market. Furthermore, we prove that the technical trading rules function much better in a trending market than in a less or non-trending one. Finally, unlike other research, we have discovered that applying the VMA rules to forecasts in Vietnamese market can help traders create enormous excess returns – even after including trading costs.
The remainder of this paper is set out as follows: section 2 describes the literature in this area, and section 3 includes our data and methodology. The analysis and results are presented in section 4. Finally, our conclusions are described in section 5.
Literature Review
Early studies on developed stock markets indicated support for the random walk hypothesis (Roberts, 1959, and Brealey, 1969). Similarly, research was conducted that investigated the weak form of the efficient market hypothesis, which was based on tests of how well different trading rules could generate returns in identical markets. The evidence from these studies generally indicated that strategies based on exploiting apparent trends in historic share prices did not yield returns that were superior to a buy-and-hold strategy, even before transaction costs were taken into account.
Later published articles, using long series of price histories, provided novel evidence on the predictive ability of technical trading rules in the developed market, see Brock et al. (1992) and Hudson et al. (1996), among others. Both studies employed two of the simplest and most popular classes of technical trading rules: moving average and trading range breakout (TRB) rules. The general conclusion that emerged from the two studies was that these technical trading rules have predictive ability if sufficiently long data are considered. Buy signals offer positive returns, whereas sell signals offer negative returns.
buy-and-ISSN: 2306-9007 Hung, Zhaojun & Thang (2014) 2073
I
www.irmbrjournal.com December 2014I
nternationalR
eview ofM
anagement andB
usinessR
esearchVol. 3 Issue.4
R
M
B
R
hold strategy. Fama and Blume (1966) and Jensen and Benington (1970) showed that once trading costs are considered, technical trading rules do not provide abnormal profits in the U.S. equity market, other studies on the U.S. market contended that potential profits depended on the level of transaction costs, see Sweeney (1988) and Brock et al. (1992), among others. The recent literature has concluded that technical trading rules have predictive ability in the emerging market context. Hendrik Bessembinder and Kalok Chan (1995) found the technical trading rules to be quite successful in the emerging markets of Malaysia, Thailand and Taiwan, using a methodology similar to Brock et al. (1992). However, the rules are far less explanatory in more developed markets such as Hong Kong and Japan. Similarly, Abeyratna Gunasekage and David M.Power (2001) indicated that technical trading rules have predictable ability in the South Asian markets (i.e., the Bombay Stock Exchange, the Colombo Stock Exchange, the Dhaka Stock Exchange and the Karachi Stock Exchange) and rejected the null hypothesis that the returns to be earned from studying moving average values are equal to those achieved from a simple buy-and-hold strategy. The employment of technical trading techniques generates excess returns to investors in the South Asian markets.
Lai Ming-Ming and Lau Siok-Hwa (2006) examined the technical trading rules of VMAs and TRBs on nine popular daily Asian market indices. The test results provided strong support for applying VMA rules in the Hong Kong, Korean and Indonesian markets. The lengths of 20 days and 60 days appeared to be the most profitable for VMA rules. In addition, Kristin Beck and Elizabeth Goldreyer (2002) made a comparison of returns from a naïve buy-and-hold strategy with those from using VMA rules in the Thai stock market. The authors used spreadsheets to model VMA rules and showed that technical trading rules yielded better returns even after taking transaction costs into account.
However, Hao Yu et al. (2013) provides evidence that the technical trading rules have stronger predictive power in Malaysia, Thailand, Indonesia and the Philippines than in the more developed stock market in Singapore. The short-term variants of technical trading rules have better predictive ability than long-term variants. However, the rules are not profitable after factoring in transaction costs. Notably, the most recent paper published by Nguyen Hoang Hung and Yang Zhaojun (2013) concludes that using VMA rules can make excess returns for investors in the Vietnamese market, before factoring in trading costs.
The moving average is, by its nature, essentially a trend following device. Its purpose is to identify and signal that a new trend has begun or that an old trend has ended. Thus, it works well only in a trending market. The contribution of this paper to the finance literature is that we prove the profits earned from applying VMA trading rules in a trending market are considerably greater than the profits that would be earned in a neutral market.
Data and Methodology
Our data set is daily local closing prices of the Ho Chi Minh stock exchange index (HOSE), which is represented as the Vietnamese national security index. The data sample is the longest daily series available in Vietnam, from August 2000 to October 2013. The data were available to download from
www.vietstock.vn(7). In addition to the full sample, to avoid the problem of data snooping(8), results are presented for two sub-samples: July 28th, 2000 to December 31st in 2008 and January 2nd, 2009 to Oct 31th, 2013. Especially, these sub-samples have very different trending specifications. The first sub-sample is a highly trending market with many long phases created between peaks and troughs. In contrast, the second
7www.vietstock.com is one of the most popular financial service providers in Vietnam
8 According to White (2000, p, 1097), data snooping occurs when a given set of data is used more than
ISSN: 2306-9007 Hung, Zhaojun & Thang (2014) 2074
I
www.irmbrjournal.com December 2014I
nternationalR
eview ofM
anagement andB
usinessR
esearchVol. 3 Issue.4
R
M
B
R
sub-sample is prototypical non-trending market with primarily sideways trending prices throughout the period. We will observe the results of VMA trading rules on both sub-samples as well as the primary data sample.
Data Statistics
Table 2 contains summary statistics for daily returns for all sub-samples and the full sample of Vietnamese stock data. ρ(i) is the estimated autocorrelation at lag i for each series. Serial correlations are generally small with the exception of a few relatively large values at the fourth and the fifth lags in the full sample. The returns are computed as log differences of the level of the index. The market indices display negative skewness for the full sample and the all sub-samples, whereas the returns are leptokurtic for the primary sample and the two sub-samples.
Table 2: Descriptive Statistics for Daily Returns
Statistics
Full sample 07/28/2000-10/31/2013
First-sub sample
07/28/2000-12/31/2008
Second-sub sample
02/01/2009-10/31/2013
N 3141 1933 1206
Mean 0.000332 0.000755 0.00049
Standard Deviation 0.246 0.0179 0.0151
Skewness -21.6* -0.29* -0.025*
Kurtosis 876.8* 4.3* 0.78*
ρ(1) 0.146* 0.346* 0.214*
ρ(2) 0.18* 0.055* 0.011*
ρ(3) 0.09* 0.029* -0.001*
ρ(4) 0.54* 0.124* 0.062*
ρ(5) 0.54* 0.142* 0.050*
Note: Number marked with * are significant at 5% level for a Chi-Square test
Technical Trading Rules
(9):
Technical analysis is based on the idea that prices move in trends that are determined by the changing attitudes of investors towards a variety of economic, monetary, political and psychological forces. The goal is to identify a trend reversal at a relatively early stage and ride it until the evidence shows that the trend has reversed. Technical analysis can be broken down into three general areas: sentiment, low-of-funds and market-structure indicators (Kristine Beck & Elizabeth Goldreyer, 2002). Sentiment indicators monitor the actions and beliefs of different market participants. Flow-of-funds indicators analyse the financial position of various investor groups in an attempt to measure their potential capacity for buying or selling stocks.
The type of technical trading that we will be modelling in this paper, moving averages, falls into the third category – market structure indicators. This area monitors the trends of various price indices, market breadth, cycles, volume, etc. to evaluate the health of the prevailing trend. There are three general types of moving average (MA): simple, weighted and exponential. The simple MA is by far the more widely used model. The latter two apply more weight to more recent data. We discuss a version of simple MA, the
9
ISSN: 2306-9007 Hung, Zhaojun & Thang (2014) 2075
I
www.irmbrjournal.com December 2014I
nternationalR
eview ofM
anagement andB
usinessR
esearchVol. 3 Issue.4
R
M
B
R
VMA, in this paper. A VMA consists of comparison of two simple moving averages, one long and one shorter. Signals are generated by the short-term MA crossing above or below the long-term MA. Note that changes in price trends are identified by the short-term MA crossing its long-term MA, not by a reversal in the direction of the MA.
Methodology
The VMA rules we applying are as follows: (1,10,0), (1,20,0), (1,50,0), (1,200,0), (2,200,0) and (5,200,0). The 1, 2 and 5 represent the number of days in the short-term MA, and the 10, 20, 50 and 200 represent the number of days in the long-term MA. The third number represents a trading band of zero. The effect of trading bands is to reduce the number of trades and thus be more effective. However, Ratner (1999) concluded that there were no major differences in the efficacy of a trading model in the presence or absence of a trading band. Additionally, Lai-Ming Ming and Lau Siok-Hwa (2006) concluded that the application of TRBs in the Asian stock market did not produce attractive returns. We do not examine the trading band in this paper. Thus, the VMA rules testing in this paper are (1,10), (1,20), (1,50), (1,200), (2,200) and (5,200).
A buy position is a long position, and a buy signal is indicated when the short moving average exceeds the
long moving average:
, , 1
1 1
S L
i t i t
s l
C C
Buy
S L
(1)
where
,
i t
C
is the daily close prices of the index used to compute the short average over period S (1, 2 or 5 days), 1
i t
C
is the closing prices of the index used to compute the long average over period L (10, 20, 50 or 200days).
S represents the short periods of 1, 2 or 5 days. L represents the long periods of 10, 20, 50 or 200 days.
Returns are not adjusted by inflation. The test is repeatedly daily, with the moving averages changing throughout the sample. The buy position is maintained until a sell signal is indicated.
, , 1
1 1
S L
i t i t
s l
C
C
Sell
S
L
(2)
The sell position is maintained until a buy signal is indicated. A rule is determined to be profitable if the daily mean buy minus sell (buy-sell) return is positive. A rule is determined to be to make excess return if the buy-sell return is positive and larger than an unconditional daily return (buy-and-hold strategy). If trading costs are considered, buy-sell must be positive and larger than a buy-and-hold alternative after including trading costs [buy-sell (net)].
Empirical Results
The results are presented in tables 3. The VMA trading rules are listed in column 1. They are in the following order: the number of days in the short MA, the number of days in the long MA. For each VMA
rules, columns 2, 3 show the numbers of buy signals, sell signals. The daily meanreturns from buy signals
ISSN: 2306-9007 Hung, Zhaojun & Thang (2014) 2076
I
www.irmbrjournal.com December 2014I
nternationalR
eview ofM
anagement andB
usinessR
esearchVol. 3 Issue.4
R
M
B
R
Table 3: The results of VMA rules
Full Sample
1 2 3 4 5 6 7
Test N(Buy) N(Sell) Buy Sell Buy-Sell Buy-Sell(Net)
(1,10) 187 187 0.001431
* (6.98) -0.001150* (-2.97) 0.002581* (5.9) 0.002164* (4.95)
(1,20) 111 112 0.001446
* (7.05) -0.001163* (-2.99) 0.002609* (5.955) 0.002361* (1.97)
(1,50) 67 67 0.000816
* (2.1) -0.000647* (-3.03) 0.001463* (3.3) 0.001314* (1.89)
(1,200) 33 33 0.000246
(0.61) - 0.000261 (-1.36) 0.000506 (1.14) 0.000433 (1.396)
(2,200) 25 25 0.000292
(0.57) - 0.000242 (-1.27) 0.000469 (1.06) 0.000413 (1.36)
(5,200) 21 21 0.000151
(0.38) - 0.000166 (-0.87) 0.000318 (0.72) 0.000271 (1.042) The three short-term rules
average 0.001231
* -0.00099* 0.00222* 0.00195*
First-Sub Sample
Test N(Buy) N(Sell) Buy Sell Buy-Sell Buy-Sell(Net)
(1,10) 111 110 0.001927
* (7.17) -0.001259* (-4.16) 0.003186* (7.93) 0.002784* (6.93)
(1,20) 61 61 0.001942
* (7.27) -0.001268* (-4.15) 0.003210* (7.97) 0.002989* (7.4)
(1,50) 38 39 0.001535
* (5.3) -0.001030* (-3.51) 0.002565* (6.25) 0.002428* (5.9)
(1,200) 9 10 0.000947
* (3.41) -0.000745* (-2.94) 0.001692* (4.51) 0.001659* (4.4)
(2,200) 7 8 0.000956
* (3.43) -0.000754* (-2.99) 0.001710* (4.56) 0.001685* (4.49)
(5,200) 6 7 0.000954
* (3.42) -0.000753* (-2.98) 0.001707* (4.55) 0.001686* (4.49) The three short-term rules
average 0.0018
* -0.00119* 0.00299* 0.002734*
Second-Sub Sample
Test N(Buy) N(Sell) Buy Sell Buy-Sell Buy-Sell(Net)
(1,10) 76 76 0.000967
* (3.16) -0.000442 (-1.4) 0.001409* (3.23) 0.000968* (2.2)
(1,20) 50 50 0.000813
* (2.58) -0.000236 (-0,77) 0.001049* (2.39) 0.000759 (1.73)
(1,50) 29 28 0.000572
(1.75) 0.000100 (0.34) 0.000472 (1.07) 0.000304 (0.69)
(1,200) 23 23 -0.000393
(-1.24) 0.000273 (0.96) -0.000666 (-1.67) -0.000799 (-1.88)
(2,200) 17 17 -0.000477
(-.1529) 0.000356 (1.23) -0.000803 (-1.96) -0.000932 (-2.19)
(5,200) 14 14 -0.000636
(-2) 0.000515 (1.8) -0.001150 (-2.7) -0.001232 (-2.9)
ISSN: 2306-9007 Hung, Zhaojun & Thang (2014) 2077
I
www.irmbrjournal.com December 2014I
nternationalR
eview ofM
anagement andB
usinessR
esearchVol. 3 Issue.4
R
M
B
R
The daily mean buy-sell returns are computed in column 6. The VMA trading rules are profitable, excluding trading costs, when the daily mean buy returns are significantly greater than the daily mean sell returns, or when column 6 is positive. The differences of daily mean buy returns over the daily mean sell returns after including trading costs are calculated in column 7. The VMA rules assigned to be profitable after trading costs when the number in column 7 is positive. In this paper we assume that the transaction costs are fixed at 0.7% per a round-trip position including tax.
Note:
- The number marked with * indicates statistical significance at 5% level.
- The numbers inside the brackets are the t-statistics testing the hypothesis that the returns generated
by the variable moving trading rules are zero(10)
In the full sample, whereas the three long-term rules: (1,200), the (2,200) and the (5,200) are statistically insignificant, the three short-term rules: (1,10), (1,20) and (1,50) have significant profitability, at 5% level. Buy signals generate positive daily mean return of 0.1431%, 0.1446% and 0.0816%, whereas sell signals generate negative daily mean returns of -0.115, -0.1163% and -0.0647%, respectively for the three rules.
Thus, the rules are profitable in both before and after taking transaction costs into account. (see column 6
and column 7 where both the daily mean buy-sell and daily mean buy-sell (net) returns are positive). Averaged across the three rules, the difference in daily mean returns of buy signals over sell signals is 0.222% which is equivalent to 79.9%annually. This performance is enormously higher than those in
Thailand, Malaysia, Taiwan, Hongkong, Japan and Korea(11). Especially, averaging the three rules, the daily
mean buy-sell return is significantly bigger than that of the unconditional daily mean return of 0.0332% (see table 2), at 5% level. Therefore, the rules can create huge daily mean excess returns of 0.188%(12) and 0.16%(13), which are equivalent to 67.7% and 58.1% annually, on average for the three rules, before and after subtracting the transaction costs, respectively. Obviously, an annually excess return of 67.7% is substantially large if compared with those from some emerging markets, such as 4.7% from Sri Lanka, 9.81% from Bangladesh and 8.6% from Pakistan (A. Gunasekarage, D.M. Power, 2001. The results were produced by FLMA (1,50,0) rule, ignoring transaction costs).
Almost the returns in the second sub-sample are not statistically significant, so the forecasting power of the variable moving average rules in this period is insignificant. In contrast to the second sub-sample, all the returns generated in the first sub-sample are very significant, at 5% level. Similarly to the full sample, all
the results in this the first sub-period reveal that there is an extremelyforecasting power of VMA rules in
Vietnamese stock market. Notably, the returns created in this first sub-sample are substantially higher than those in the full sample. Considering the three rules: (1,10), (1,20) and (1,50). The averaged daily mean
10
Applying the conventional t-tests to individual trading return series may produce biased results if the return series are not normally distributed. However, Lukac and Brorsen (1990) find that portfolio returns of technical trading systems are normally distributed while individual market-level returns are positively skewed and leptokurtic.
11 Kristine Beck and Elizabeth Goldreyer (2002) found that the difference in the annualised means,
averaged across five VMA rules, for Thailand is 37.29%. According to the findings of H. Bessembinder and K. Chan (1995), the difference in means of buy signals over sell signals is 29.2% per annum for Malaysia, Thailand, Taiwan, Hong Kong, Japan and Korea.
12 This number is calculated by dividing the averaging of the daily mean buy-sell returns of the three
rules over the unconditional daily mean returns: 0.00188 = (0.00258+0.002609+0.0001463)/3 - 0.000332.
13
ISSN: 2306-9007 Hung, Zhaojun & Thang (2014) 2078
I
www.irmbrjournal.com December 2014I
nternationalR
eview ofM
anagement andB
usinessR
esearchVol. 3 Issue.4
R
M
B
R
returns of the three rules in the first-sub sample are 0.18%, -0.119%, 0.299% and 0.273%(14) for buy, sell,
buy-sell and buy-sell (net) returns respectively, whereas the respective numbers are only 0.123%, -0.099%, 0.222% and 0.195% in the full sample. Similarly, averaged across the three rules, the difference in daily
mean returns of buy signals over sell signals is 0.299% which is equivalent to 107.6%annually in the first
sub-period, while they are only 0.222% and 79.9%, respectively in the full sample. Alike, the daily mean
excess returns made in the first sub-sample are 0.265%(15) and 0.24% which are equivalent to 95.5% and
86.4% annually, on average for the three rules, before and after subtracting the transaction costs, respectively. These results are much larger than those from the full sample. Apparently, while comparing the results from the two sub-samples, there were notable differences. While the profits generated from the three rules in the first period sub-sample are substantially larger than those from the full sample, the profits generated in the second sub-sample are even non-profitable and statistically insignificant. This difference in results between the samples reflects the distinction of when VMA trading rules are best applied to trending markets. In other words, the data confirms that VMA trading rules works better in a trending market than in a non-trending or neutral market.
Conclusions
There are two important things revealed in this paper. First, the profitability of VMA rules in Vietnamese market is substantially better than those proven by former authors in both developed and emerging markets in many aspects. The results in this paper are generally consistent with those of prior research. The buy signals are significantly positive, and the sell signals significantly are negative, which therefore provides evidence to reject the hypothesis that the daily mean return generated by technical trading rules is zero. We also recognise that the short-term VMA trading rules are more effective in forecasting stock price movements than the long-term one. Furthermore, our results find an outstanding aspect of using VMA trading rules in the Vietnamese market compared with other Asian markets. Specifically, the rates of return generated in the Vietnamese market by applying VMA trading rules is much larger than those made in other Asian markets. Furthermore, we found that even with a 0.7% transaction cost per round-trip trade traders can apply VMA trading rules and still generate higher excess returns than those in some emerging markets. Vietnamese market is still a frontier one. The results from this paper provide an evidence to argue that the VMA rules perform more effective in the frontier market than they do in the emerging one.
The second and most important conclusion of this paper, we found that the profits made from buy and sell signals from the first-sub sample are much larger than those from the full sample and the second-sub sample. Thus, the conclusions to argue that the VMA trading rules function better in a trending market than they do in a non-trending one.
References
AbeyratnaGunasekarage and David M. Power, (2001). The profitability of moving average trading rules in
South Asian stock markets. Emerging Market Review 2: 17-33.
Beck, K., & Goldreyer, E. (2002). A moving average technical trading spreadsheet model for use in technical teaching technical trading. Journal of Technical Analysis 58: 19-32.
Bessembinder, H., & Chan, K. (1995). The profitability of technical trading rules in the Asian stock
markets. Pacific-Basin Finance Journal. 3(2-3): 257-284.
Brealey, R. (1969). An introduction of risk and return from common stocks. Cambridge,Mass.:MIT Press,
25.
14
All these numbers got by averaging the three rules results in column 4, 5, 6 and 7 in table 3.
ISSN: 2306-9007 Hung, Zhaojun & Thang (2014) 2079
I
www.irmbrjournal.com December 2014I
nternationalR
eview ofM
anagement andB
usinessR
esearchVol. 3 Issue.4
R
M
B
R
Ben R. Marshall, Martin R. Young, Lawrence C. Rose, (2006). Candlestick technical trading strategies: Can they create value for investors? Journal of Banking & Finance 30: 2303-2323.
Brock, W., J. Lakonishok and B. LeBaron, (1992). Simple technical trading rules and the stochastic properties of stock returns. Journal of Finance XL VII (5): 1731-1764.
Fama, E.F., & Blume,M. (1996). Filter rules and stock market trading. Journal of business 39: 226-241. Franco Parisi and Alejandra Vasquez. (2000). Simple technical trading rules of stock returns: Evidence
from 1987 to 1988 in Chile. Emerging Markets Review 1: 152-164.
Gunasekarage, A., & Power, D. M. (2001). The profitability of moving average trading rules in South
Asian stock markets. Emerging Market Review 2(1): 17-33.
Hao Yu, Gilbert V. Nartea, Christopher Gan, Lee J.Yao, (2013). Predictive ability and profitability of simple technical trading rules: Recent evidence from Southeast Asian stock markets. International Review of Economics and Finance, 25, 356-371.
Harvey, C.R, (1995a). The cross-section of volatility and autocorrelation in emerging markets. Finanzmarkt
und Portfolio Management 9: 12-34.
HendrikBessembinder and Kalok Chan, (1995). The profitability of technical trading rules in the Asian
stock markets. Pacific-Basin Finance Journal 3: 257-284.
Hudson, R., Dempsey, M., & Keasey, K. (1996). A note on the weak form efficiency of capital markets: The application of simple technical trading rules to UK stock prices – 1935 to 1994. Journal of Banking & Finance 20(6): 1121-1132.
Jensen, M. and G. Benington.(1970). Random Walks and Technical Theories: Some Additional Evidence.
Journal of Finance 25: 469-482.
Lai Ming-Ming and Lau Siok-Hwa, (2006). The profitability of the simple moving averages and trading
range breakout in the Asian stock markets. Journal of Asian Economics 17: 144-170.
Lukac, L.P., and B.W. Brorsen. A comparison of twelve technical trading systems. Greenville, SC: Traders Press, Inc, 1990.
Lukas Menkhoff, (2010). The use of technical analysis by fund managers: International evidence. Journal
of Banking and Finance 34: 2573-2586.
Mark P. Taylor, (1992). The use of technical analysis in foreign exchange market. Journal of International
Money and Finance 11: 304-314.
Nguyen Hoang Hung, Yang Zhaojun (2003). Profitability of applying moving average trading rules for
Vietnamese stock market. Journal of Business & Management 2(3): 22-31.
Parvez Ahmed, Kristine Beck and Elizabeth Goldreyer (2005). Moving average technical trading strategies
for currencies of emerging economies. Managerial Finance, Vol.31 Iss:5 pp. 14-27.
R. Hudson, Michael Dempsey and Kevin Keasey, (1996). A note on the weak form efficiency of capital
markets: The application of simple technical trading rules to UK stock prices – 1935 to 1994. Journal
of Banking & Finance 20: 1121-1132.
Ratner, M., & Leal, R. (1999). Test of technical trading strategies in emerging equity markets of Latin
America and Asia. Journal of Banking and Finance 23: 1881-1905.
Ryuichi Yamamoto (2012). Intraday technical analysis of individual stocks on the Tokyo Stock Exchange.
Journal of Banking & Finance 36: 3033-3047.
Sweeney, R. (1988). Some new filter rule tests: Methods and results. Journal of Financial and Quantitative
Analysis 23: 285-300.
White. H.(2000). A reality check for data snooping. Econometrica 68: 1097-1126.
Yu-Hon Lui, David Mole (1998). The use fundamental and technical analysis by foreign exchange dealers: