http://www.sciencepublishinggroup.com/j/nsnm doi: 10.11648/j.nsnm.20170301.12
ISSN: 2472-3622 (Print); ISSN: 2472-3630 (Online)
High Accuracy and Sensitivity Method of the Observation
of the Surface’s Morphology Changes by Means of Atomic
Force Microscopy with Cyclic, Precise Sample Positioning
Andrzej Sikora
1, 21
Division of Electrotechnology and Materials Science, Electrotechnical Institute, Wrocław, Poland
2Centre for Advanced Materials and Smart Structures, Polish Academy of Sciences, Wroclaw, Poland
Email address:
[email protected]To cite this article:
Andrzej Sikora. High Accuracy and Sensitivity Method of the Observation of the Surface’s Morphology Changes by Means of Atomic Force Microscopy with Cyclic, Precise Sample Positioning. Nanoscience and Nanometrology. Vol. 3, No. 1, 2017, pp. 6-11.
doi: 10.11648/j.nsnm.20170301.12
Received: March 28, 2017; Accepted: April 14, 2017; Published: May 19, 2017
Abstract:
The submicron changes of the morphological properties of the surface can provide one of the earliest indications of the degradation of the material due exposition to a certain media. Atomic force microscopy, as the tool delivering 3D quantitative imaging of the surface with ultimate resolution, is successfully utilized in the detection of the materials degradation. Yet, a several issues such as the materials non-homogeneity and the presence of the morphological artifacts must be taken into account in terms of the reliability of obtained data, while their presence in the scanned area may cause a significant deviation of the measurement outcome from the values being representative to the condition of the investigated material. In this paper the approach based on the precise sample positioning at each stage of the verification of the deterioration progress is presented. This novel method allows to acquire the information with unique sensitivity and high degree of confidence. Moreover, the observation of the morphology changes at several spots with high receptivity enables determination of the homogeneity of the deterioration, which may play essential role in case of investigation of behavior of complex materials (containing additives or fillers), in particular nanomaterials. A set of experimental results acquired on the polycarbonate and polyethylene samples is here presented, revealing the efficiency of presented approach and its advantages over the commonly applied methods.Keywords:
Atomic Force Microscopy, Materials Degradation, Degradation Profiles, Precise Positioning, Materials Science, Measurement Repeatability1. Introduction
Since its development [1, 2], atomic force microscopy became very popular measurement method, providing a wide range of micron and submicron- scale diagnostics of the surface. The basic and the most popular way of the AFM utilization is the surface imaging. As obtained topography maps provide 3D quantitative imaging, the variety of roughness parameters can be calculated, allowing to compare in perceptible fashion the measurements results. This particular advantage was utilized number times in the investigation of the surface deterioration due to exposition to a certain media. The impact of the UV light [3-7], simulated solar radiation [8], high voltage [9], complex environmental conditions [10]
the sample will be representative for whole specimen. Therefore in many works, single or very few measurements were used to calculate the roughness changes [5, 8, 10-13]. Among few works investigating the degradation process, and showing the gradual roughness changes, one could notice rather monotonic behavior, visible as the increase of Sa or Sq
parameters [13, 19-20]. Some works, however, reported much more complex degradation phenomena [6, 10, 21]. Such a results indicate the need of the high resolution technique, allowing to rule out any measurement issues. Therefore one should be skeptical about single result-based data reliability, as the materials submicron non-homogeneity must be taken into account. Even in case of the surface that one can consider as highly homogenous and showing no signs of the materials processing traces (moulding form imprint) or the distinct composite features, the surface roughness parameters may vary within of range of magnitude, which makes further analysis very complex. Therefore following data processing, relaying on data collected in such a fashion, may be confusing. The
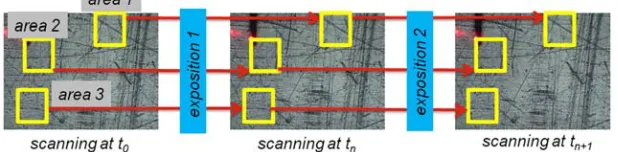
increase of the number of measurements may improve the reliability of the analysis; however it may not completely solve an issue, as the distribution of obtained data can still limit the changes detection resolution [6, 8, 22]. Moreover, the time consumption in order to perform a large number of measurements may make the experiment inconvenient. In addition, once the non-homogenous samples are considered, the issue becomes more complicated, as the surface may reveal a significant dispersion of the roughness parameters caused by the presence of varying density of the fillers. In such a case, it is difficult to compare the morphology changes if the measurement results are spatially incoherent (in other words – made at randomly chosen coordinates). In order to solve this problem, the method of acquisition of set of scans at certain spots of the sample at each cycle of the sample exposition to the certain media was proposed (figure 1) [15, 19-21]. As the result, the roughness comparison refers to this same area providing the most reliable information.
Figure 1. The idea of the utilization of continuous observation of the roughness changes of selected set of areas while the cyclic exposition to media is performed.
In order to demonstrate the advantages of described approach, the set of measurement results is here presented, acquired for three samples: polycarbonate, polyethylene and polyethylene with nanofillers, exposed in cyclic mode to UV light. The presence of the nanofillers allowed to obtain clear spatial non-homogenous response of the surfaces, which enabled an obvious indication of the superior outcome of presented method. In addition, analysis of the results variations is presented for hypothetical situation of random data analysis. According to obtained data, the detection sensitivity of the material’s morphology changes is very high, providing outstanding level of confidence in the data processing. Described method enables the creation of the degradation profiles, revealing the whole process of the morphology changes, at each step of the exposition to utilized media. Moreover, by scanning several areas, one can analyze the homogeneity of the surface deterioration, by comparing the degradation profiles.
2. Experimental Procedure
The set of samples: polycarbonate, low density polyethylene (LLDPE – DFDA 7540 from Dow Chemical Company) with UV-stabilizer (UV 6014 LD from Polyplast Muller) in amount of 5 wt. % and low density polyethylene with the addition of montmorillonite (MMT) (Cloisite 15A from Southern Clay) and the soot filler were prepared using
press-moulded technique. The measurements were performed with DI3000 AFM system equipped with 100 µm × 100 µm scanner. Tapping Mode was used in order to minimize the risk of the surface modification by the scanning tip, as compared to contact mode, the tip-sample force is significantly lower. The measurements were performed in air, at room temperature approximately 25°C and relative humidity 35%. The Nanosensors Pointprobes were used (nominal tip radius rtip = 10 nm, resonance frequency range
fres = 306–353 kHz, and spring constant k = 43–68 N m−1).
The scanning resolution was 512 x 512 points. The data was processed using SPIP software from Image Metrology company [23]. Root mean square roughness (Sq) was determined for each acquired image and used for the
deterioration profiles preparation. In addition, 200
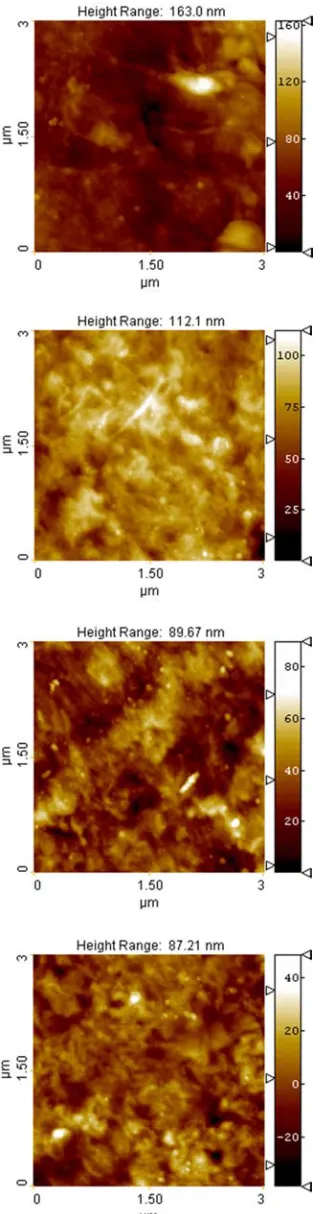
measurements of PE/MMT sample before the UV exposition were also performed in order to investigate the specimen’s roughness distribution. It allowed to demonstrate the possible range of the values that should be taken into account in terms of the degradation analysis without the precise positioning.
are shown in figure 2. The variety of the surfaces is clearly visible, and its impact on the roughness parameter is obvious.
Figure 2. The examples of the polyethylene/MMT surface AFM scans illustrating the morphology diversity within single sample.
Each set of data related to certain spot was used to create a single degradation profile. As each sample was scanned in seven areas, it was possible to create the group of profiles, revealing specific response of the material to the radiation.
3. Experimental Result
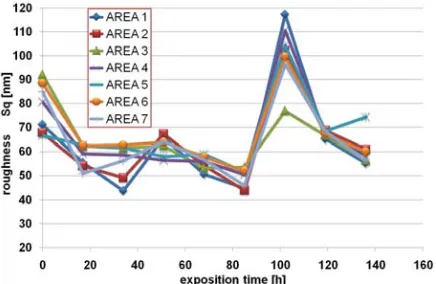
Obtained degradation profiles of investigated materials are shown in figures 3 - 5. One can easily notice the different responses of the specimens to UV light exposition. Some of the features of the roughness changes appear in all set of curves, however it is possible to find the key differences between the polycarbonate and polyethylene. In case of the polycarbonate sample, the homogeneity of the material is very high, as all the profiles are coherent. The presence of the initial roughness distribution Sq is between 60 nm and 80 nm.
One can assume, that larger amount of the measurement would reveal larger distribution of this parameter. Therefore it can be concluded that without precise positioning and creating the individual profiles for each area, it would be impossible to follow the roughness changes with such a sensitivity. It has to be underlined, that the acquisition of a series of profiles of such a coherence allows to confirm with high degree of confidence the accuracy of obtained results. Even fine roughness changes of the material are detected with high sensitivity, which wouldn’t be obtained using standard approach basing on calculation of average value and the results dispersion. In order to avoid the impact of the probe’s wear, its condition must be continuously monitored using the reference sample. In presented experiment, the roughness of reference sample maintained at that same level during whole measurement procedure, confirming good condition of the scanning tip.
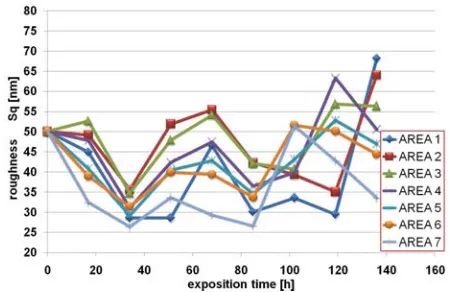
Figure 3. The set of degradation profiles acquired for the polycarbonate sample.
Figure 4. The set of degradation profiles acquired for the polyethylene sample.
Figure 5. The set of degradation profiles acquired for the polyethylene/MMT /soot sample.
In addition to presented profiles, the distribution of the roughness parameter Sq acquired on the polyethylene 200
samples is presented in figure 6. The range of roughness values that one could acquire on investigated sample is relatively large. Therefore, as previously mentioned, observation of the roughness changes performed without specific areas trace, could deliver the data with a significant dispersion, making impossible the preparation of the degradation profile with presented here sensitivity.
Figure 6. The set of degradation profiles acquired for the polyethylene/MMT /soot sample.
In order to improve the visibility of the degradation profiles coherence/ incoherence, the initial roughness offsets were removed. Obtained data is presented in figures 7-9.
Figure 7. The set of degradation profiles acquired for the polycarbonate sample after the initial roughness offset removal.
9
Figure 8. The set of degradation profiles acquired for the polyethylene sample after the initial roughness offset removal.
Figure 9. The set of degradation profiles acquired for the polyethylene/MMT /soot sample after the initial roughness offset removal.
changes trends. The analysis of acquired data may also provide the quantitative measure of the homogeneity of the material. This particular information can be useful in terms of the evaluation of the development process of the nanomaterials, as it may allow to determine the nanofillers dispersion quality.
In addition, in order to demonstrate the usability of demonstrated measurement approach and to show how the randomly collected result may lead to false conclusions, the acquired results were modified by mixing the certain values between the profiles. Obtained graphs clearly show the way the subtle roughness changes could be lost, if no specific areas tracing was implemented. For polycarbonate the degradation between 20th and 80th hour is inconclusive, and in other areas the distribution of the changes steepness is also significantly larger than in figure 7.
Figure 10. The set of degradation profiles acquired for the polycarbonate sample after the replacement of specific measurement points between curves.
For polyethylene (figure 11) similar conclusions can be drawn. The diversity of the degradation dynamics at initial stage is less informative than in figure 8. On the other hand, the profiles shown in figure 12 look like revealing specific trends in much more coherent way than in figure 9. This example proves, that it is possible to obtain by accident a series of the profiles that will resemble the appearance of relatively high homogeneity of the materials. This case, again, shows the importance of the idea of precise positioning and tracing the roughness changes at certain spots, as one expects the high confidence and resolution of acquired data.
Figure 11. The set of degradation profiles acquired for the polyethylene sample after the replacement of specific measurement points between curves.
Figure 12. The set of degradation profiles acquired for the polyethylene/MMT /soot sample after the replacement of specific measurement points between curves.
5. Summary and Outlook
In this work the method solving potential weaknesses of specific AFM surface degradation measurement is presented. By showing the way the polycarbonate and polyethylene samples responded to the UV-light exposition in specifically selected micrometer-size areas, it was possible to acquire the unique set of data providing the roughness calculation at each step of the exposition process. Demonstrated precise positioning of the sample in terms of the continuous tracing of the roughness changes at specific areas of the surface allows to create the degradation profiles, which by revealing a certain level of coherence provide significantly higher detection resolution than methods basing on statistical analysis. Moreover, the set of profiles revealing that same behavior, allows to confirm the accuracy of obtained data with very high degree of confidence. It is unlikely that such a result might be acquired by the accident, if the certain precautions are taken, such a scanning tip quality monitoring. Obtained detection resolution can be used for the investigation of unique responses of the materials to a certain media, in particular as the significant effort in material science is taken to increase the material’s resistance to certain factors. In addition, as the nanomaterials can be also the subject of the research, this method can be used in terms of the determination of the non-homogeneity of the sample in a quantitative fashion. Further investigations will be carried out in order to develop the most effective way of the following data processing. One can argue that presented approach may deliver an ultimate resolution of the submicron investigation of the variety of materials and in particular the nanomaterials in the cyclic evaluation of the response of the materials to the exposition to a certain factor.
Acknowledgments
References
[1] G. Binnig, C. F. Quate, C. Gerber, “Atomic Force Microscope”, Phys. Rev. Lett., vol. 56, p. 930–933, 1986.
[2] H. K. Wickramasinghe, “Progress in scanning probe microscopy”, Acta Mater., vol. 48, no. 1, p. 347–358, 2000.
[3] M. Nowicki, A. Richter, B. Wolf, H. Kaczmarek, “Nanoscale mechanical properties of polymers irradiated by UV”, Polymer, vol. 44 no. 21, p. 6599-6606, 2003.
[4] F. Rollet, S. Morlat-Thérias, L. J. Gardette, “AFM analysis of CD-R photoageing”, Polym. Degrad. Stab., vol. 94, p. 877– 885, 2009.
[5] P.-O. Bussiere, E. Desnoux, S. Collin, C. Vial, S. Therias, J.-L. Gardette, “Is Carbonyl Index a quantitative probe to monitor polypropylene photodegradation?”, Polym. Degrad. Stab., vol. 128, p. 200–208, 2015.
[6] A. Sikora, A. Grabarek, L. Moroń, M. Wałecki, P. Kryla, “The investigation of the light radiation caused polyethylene based materials deterioration by means of atomic force microscopy”, IOP Conf. Ser. Mater. Sci. Eng., vol. 113, p. 012016, 2016.
[7] H. Wang, H. Xie, Z. Hu, D. Wu, P. Chen, “The influence of UV radiation and moisture on the mechanical properties and micro-structure of single Kevlar fibre using optical methods”, Polym. Degrad. Stab., vol. 97, p. 1755–1761, 2012.
[8] A. Sikora, L. Bednarz, T. Fałat, M. Wałecki, M. Adamowska, “The investigation of the simulated solar radiation impact on the micro- and nanoscale morphology and mechanical properties of the sheet moulded composite surface”, Mater. Sci., vol. 34, no.3, p. 641-649, 2016.
[9] C. Robertson, M. Wertheimer, D. Fournier, L. Lamarre, “Study on the morphology of XLPE power cable by means of atomic force microscopy”, IEEE Trans. Dielectr. Electr. Insul., vol. 3, p. 283–8, 1996.
[10] E. Canetta, K. Montiel, A. K. Adya, “Morphological changes in textile fibres exposed to environmental stresses: atomic force microscopic examination”, Forensic Sci. Int., vol. 191, no. 1–3, p. 6-14, 2009.
[11] B. Suresh, S. Maruthamuthu, A. Khare, N. Palanisamy, V. S. Muralidharan, R. Ragunathan, M. Kannan, K. N. Pandiyaraj, “Influence of thermal oxidation on surface and thermo-mechanical properties of polyethylene”, J. Polym. Res., vol. 18, no. 6, p. 2175-2184, 2011.
[12] F. Ravari, A. Omrani, A. A. Rostami, M. Ehsani, “Ageing effects on electrical, morphological, and mechanical properties of a low viscosity epoxy nanocomposite”, Polym. Degrad. Stab., vol. 97, p. 929–935, 2012.
[13] R. Mikšová, A. Macková, P. Malinský, P. Slepička, V. Švorčík, “A study of the degradation of polymers irradiated by Cn+ and On+ 9.6 MeV heavy ions”, Polym. Degrad. Stab., vol.122, p. 110–121, 2015.
[14] P. Lochyński, A. Sikora, B. Szczygieł, “Surface morphology and passive film composition after pickling and electropolishing”, Surf. Eng. vol. 33, no.5, p. 395–403, 2017.
[15] O. Güven, A. Alacakir, E. Tan, “An atomic force microscopy study of the surfaces of polyethylene and polycarbonate films irradiated with gamma rays”, Radiation Physics and Chemistry, vol. 50, p. 165, 1997.
[16] A. Sikora, A. Iwan, “AFM study of the mechanical wear phenomena of the polyazomethine with thiophene rings: Tapping mode, phase imaging mode and force spectroscopy”, High Perf. Pol., vol. 24, no.3, p. 218–228, 2012.
[17] A. Sikora, L. Bednarz, G. Ekwiński, and M. Ekwińska, “The determination of the spring constant of T-shaped cantilevers using calibration structures,” Meas. Sci. Technol., vol. 25, no. 4, p. 044015, 2014.
[18] S. N. Ramakrishna, L. Y. Clasohm, A. Rao, N. D. Spencer, “Controlling Adhesion Force by Means of Nanoscale Surface Roughness”, Langmuir, vol. 27, p. 9972, 2011.
[19] A. Sikora, “Development and utilization of the nanomarkers for precise AFM tip positioning in the investigation of the surface morphology change”, Opt. Appl., vol. 43 no.1, p. 163– 171, 2013.
[20] A. Sikora, “Improvement of the scanning area positioning repeatability using nanomarkers developed with a nanoscratching method”, Meas. Sci. Technol., vol. 25, p. 055401, 2014.
[21] A. Sikora, “The new approach to the investigation of the roughness changes of the non-uniform materials irradiated with UV light and imaged by means of atomic force microscopy supported with precise repetitive scanning area positioning”, Meas. Sci. Technol., vol. 28, p. 034016, 2017.
[22] A. K. Bajpai, R. Bhatt, R. Katare, “Atomic force microscopy enabled roughness analysis of nanostructured poly (diaminonaphthalene) doped poly (vinyl alcohol) conducting polymer thin films”, Micron, vol. 90, p. 12–17, 2016.