http://www.sciencepublishinggroup.com/j/jeee doi: 10.11648/j.jeee.20180606.13
ISSN: 2329-1613 (Print); ISSN: 2329-1605 (Online)
Implications of the Large-Scale Deployment of Non-linear
Loads
Jomo Nkumah Gill
1, *, Gururaj Sudhindra Punekar
21
Department of Electrical Engineering, Faculty of Engineering and Technology, Turkeyen Campus, University of Guyana, Georgetown, Guyana
2Department of Electrical and Electronics, National Institute of Technology Karnataka (NITK), Surathkal, India
Email address:
*
Corresponding author
To cite this article:
Jomo Nkumah Gill, Gururaj Sudhindra Punekar. Implications of the Large-Scale Deployment of Non-linear Loads. Journal of Electrical and Electronic Engineering. Vol. 6, No. 6, 2018, pp. 153-159. doi: 10.11648/j.jeee.20180606.13
Received: September 9, 2018; Accepted: September 26, 2018; Published: January 4, 2019
Abstract:
Compared to yesteryear, non-linear loads now proliferate in homes, offices and the industrial environment. Non-linear loads now form a major component of the total loading in the typical electrical network. The Compact Fluorescent Lamp is but one example of a non-linear load that inherently produces and injects distorted currents into the electrical power network, which could create adverse consequences if appropriate and adequate harmonic mitigation techniques are not employed. CFLs are now a major component of the luminaires market around the world because consideration is being given worldwide to the phasing out of incandescent lamps. However, there are legitimate concerns over the quality of some CFLs. This paper investigates and compares the quality of some major brands of CFLs, in terms of parameters such as harmonic content, power factor, fundamental power factor, nonactive power, and apparent power. The wider implication of these results is ascertained by investigating the effects large scale installation of CFLs would have on a generalized electrical network. This work shows that CFLs with high harmonic currents increase the requirements of the source and other network components, as well as place a significant strain on them, since they draw a higher current and also consume a higher apparent power and nonactive power than is necessary for power delivery. Also, it is found that voltage harmonic limits can approach or exceed the IEEE limit of 5% as the number of CFLs deployed is increased. This situation is more pronounced if CFLs with higher current harmonic content are installed.Keywords:
Non-linear Loads, Compact Fluorescent Lamps, Harmonics, Power Factor, Power Quality, Total Harmonic Distortion1. Introduction
Many governments around the world have made a commitment to ban the usage of incandescent lamps (ILs) and completely replace them by other more energy efficient lamps in their jurisdictions within the short to medium term. CFLs are one of the alternatives to ILs that have gained widespread acceptance chiefly because of their relatively low power consumption, while delivering high lumen output. For example, in terms of luminosity, a 5W CFL is equivalent to a 25W IL and a 14W CFL is equivalent to a 75W IL. This implies that large scale CFL use can be especially beneficial for utilities since it can result in peak shaving, increased
system capacity, and significant savings in the medium and long term [1]. The transition from ILs to other types of lamps such as CFLs is also facilitated by the retrofitting into existing sockets for ILs. Another benefit of CFLs is their reputed longer lifetimes than ILs.
depending on the particular network configuration and other connected loads, can cause harmonic limits at system buses and Point of Common Couplings (PCCs) to be exceeded [2-13]. This in turn has the potential to cause mal-operation of equipment of connected consumers.
The current work is useful since many countries are considering making the use of more modern lighting systems mandatory in preference to ILs. However, as regards CFLs, it is first imperative that CFLs in the market be analyzed to determine their key performance parameters, inclusive of their harmonic current injections into the electrical network, which in turn can give an indication of the possible consequences if their usage is widespread. An excess of harmonics in the electrical network has a host of negative consequences, inclusive of increased line losses, thermal stresses on equipment, pulsating and reduced torque in motors and generators, and a shortening of equipment life [14]. Overall, high harmonic levels cause the quality of power on electric power networks to be significantly degraded.
The primary aim of this paper is to characterize, compare and evaluate the behavior of a specific type of non-linear load, that is, CFLs. Focus is placed on analyzing the harmonic content of the major brands of such devices. By extension, the possible effects on a representative portion of the electrical network when the CFLs are deployed on a large scale are investigated using MATLAB/Simulink.
2. Methodology
2.1. Testing of CFLs
Nine (9) models of 5W CFLs manufactured in India were purchased and tested for their current harmonic content using the Yokogawa CW240 Power Meter. For verification purposes, the rms currents of the CFLs were also measured using the Rish Multi 18S True Rms Meter. In all cases there was agreement between the rms current readings of the two (2) meters to within 1mA. All the tested CFLs have electronic ballasts and are of the linear, retrofit variety. Their Maximum Retail Prices (MRPs) range from 110 to 135.
All lamps were tested at a supply voltage of 223.5V rms, 50Hz, with the harmonic distortion in the voltage not exceeding 1.8%. Harmonic current levels up to the 50th order, as indicated by the Power Meter, were used to aid in comparing and evaluating the lamps’ performance with the aid of MATLAB.
2.2. Simulations and Modeling
2.2.1. Algorithm for Computation of CFL Parameters Harmonic levels for the supply voltage and CFL current up to the 50th order were entered into a MATLAB code used for displaying spectral, phase and time-domain plots of voltage and current, as well as computing various performance parameters for the tested CFLs. The algorithm for the MATLAB Code is given below, with formulae as defined in [15-17]. A sampling frequency of 300kHz was used throughout.
(1)Input measured rms harmonic currents and phase angles for CFL-1.
(2)Input measured rms harmonic voltages and phase angles for CFL-1.
(3)Compute rms current using Irms= ∑hIh2.
(4)Compute rms voltage using Vrms= ∑ Vh 2
h .
(5)Compute apparent power using S=VrmsIrms. (6)Compute active power using P=∑hVhIhcos θh. (7)Compute power factor using PF=P/S.
(8)Compute nonactive power using N= S2- P2.
(9)Compute total harmonic distortion for voltage and current using THDI,V= ∑ I /I , ∑ V /V. (10)Compute distortion power factor using
DPF= 1 1+THDI2.
(11)Display performance parameters and graphs of spectral and phase plots, voltage, current, and harmonic components in sinusoidal form.
(12)Repeat (i) to (xi) for CFL-2 to CFL-9. Where:
V1 and I1 are the rms values of the fundamental
components of voltage and current respectively,
Vh and Ih are the rms harmonic components of the voltage
and current respectively,
θh is the phase angle between the voltage and current for
the hth harmonic.
2.2.2. System Model
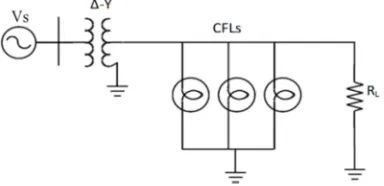
The wider implication of the harmonic distortions due to the tested CFLs was investigated by using Simulink to model a simplified and generalized electrical network, where a lumped resistance was used to represent parallel-connected thermal or linear loads for all connected consumers. Specifically, an attempt was made to investigate the impact of large scale deployment of the CFLs on a generalized electrical network. Since emphasis is strictly being placed on the system’s response due to CFLs, other harmonic-producing loads, such as arcing devices, switch mode power supplies, and variable speed drives, which comprise many electrical networks nowadays, have not been included since this may cause confounding of the results. This implies that the results and conclusions of this study would represent best-case scenarios. The generalized system to be modeled and investigated is shown in Figure 1.
Figure 1. Representative system for investigating the impact of large scale
Since it allows for a general impression of what can happen in any electrical network using the type of CFLs tested in this study, this procedure was preferred to a Case Study, whose results would only be specific to the system under consideration. The voltage was supplied to the CFLs via the secondary of a 0.2MVA, 11kV/0.433kV, ∆-Y transformer with a rated secondary current of 266.6A and an impedance voltage of 4.11%. The actual voltage used in the model is 223.5V rms at 50Hz since the CFLs were tested for their harmonic content at that voltage level. The line is assumed to be AWG10 aluminium of length 100m and resistance 0.330Ω. For simplicity, the line is assumed to be a summation of the lengths of the various cables used to supply power to all consumers serviced by the transformer. Each CFL was modeled by current sources at the various harmonic
frequencies with non-zero current amplitudes. The phase angles and power consumption of the CFLs were also accounted for in the model. The impact of the CFLs on the network was investigated by progressively increasing the number of CFLs therein. The interaction and compensation of harmonic levels when various brands of CFLs are employed were also investigated.
3. Results
3.1. CFL Characteristics
The summarized results of the measured CFL currents and the computed parameters for two (2) selected lamps, CFL-1 and CFL-2, are given in Table 1.
Table 1. Parameters for CFL-1 and CFL-2.
CFL Irms (mA) I1 (mA) P (W) S (VA) N (var) θ1 (º) FPF PF THDI (%) DPF
CFL - 1 47.459 25.300 5.119 10.558 9.234 25.4 0.903 0.485 157.812 0.535
CFL - 2 23.606 23.300 5.116 5.279 1.302 10.6 0.983 0.969 16.317 0.987
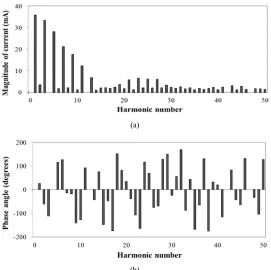
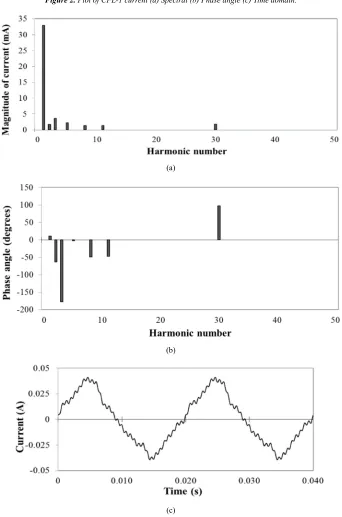
Spectral, phase and time domain plots of these two (2) lamps, which have the highest and lowest current THD values respectively, are shown in Figures 2 and 3. All nine (9) CFLs draw a non-sinusoidal current, with THDI values
varying from 16.32% to 157.81%, of which four (4) are in excess of 100%. All lamps except one (1) have some low-amplitude even harmonics interspersed among the higher-amplitude odd harmonics. Power factors for the lamps varied from 0.49 to 0.97, with an average value of 0.74. High THDI
values correlate with low power factor, with a general tendency for power factors to decrease with increasing harmonic current injections. All lamps with THDI values in
excess of 100% had power factors less than or equal to 0.6. Fundamental power factors (FPFs) for all lamps were
leading and in excess of 0.85, with a maximum value of 0.98 and an average value of 0.93. Since the supply voltage can practically be considered as a pure sinusoid, with THDV being
1.8% in all cases, the contribution of current harmonics to the power consumed by the CFLs is negligible. More specifically, for all lamps, only the fundamental component I1 contributes
to the active power, with the other current components serving only to increase the requirements of the voltage source. For those lamps with THDI values in excess of 100%, the
unneeded harmonic currents are all in excess of 10mA, with the fundamental component I1 being much less than the total
rms current. With large scale installation of CFLs, especially those with higher harmonic content, the excess current draw and the strain on the voltage source would be considerable.
(a)
(c)
Figure 2. Plot of CFL-1 current (a) Spectral (b) Phase angle (c) Time domain.
(a)
(b)
(c)
A comparison of the results for CFL-1 and CFL-2, as given in Table 1, is instructive in highlighting the drawbacks of a highly non-linear CFL. These two CFLs utilize the same active power (5.12W), but the disparities in the key parameters of rms current (Irms), apparent power (S),
nonactive power (N) and power factor (pf) are quite significant. The differences in the values for these parameters are 23.853mA, 5.279VA, 7.932vars, and 0.484 respectively. Hence, extensive use of CFL-1 instead of CFL-2 would result in increased current draw from the supply, which could ultimately lead to transformer overload, increased line losses and shortening of equipment life, if equipment derating or harmonic mitigating techniques are not implemented.
3.2. Effects of CFLs on the Generalized Electrical Network
The effects of progressively increasing the number of CFLs are examined for two cases:
(1)Case I: CFL-1 only
(2)Case II: CFLs with different current THD values The Simulink setup for the investigation is shown in Figure 4, where Zs is the impedance of the source, Rline is the
impedance of the line, PCC is the point of common coupling, and RL represents customers with strictly linear loads.
3.2.1. Case 1: CFL 1 Only
The effect of increasing the number of CFL-1 lamps, which have the highest current THD value of 157.812%, is first investigated. Two cases are examined:
(1)When CFLs comprise the only load in the system and, (2)When the other parallel loads are a lumped resistance
of value 100Ω.
1) RL =
∞
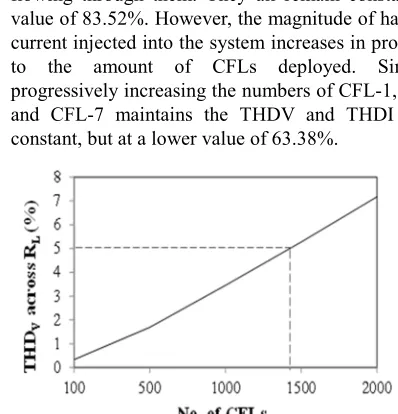
: When CFLs form the only load in the system, and they are progressively increased, there is no change in the THDV values across the network impedances and the THDI values of the current flowing through them. They all remain constant at a value of 157.812%. However, the magnitude of harmonic current injected into the system increases in proportion to the amount of CFLs deployed, which would be a concern when CFLs form a significant portion of the total system loading.2) RL=100Ω: Progressively increasing the number of CFLs from 50 to 1500, results in an increase in the THDV values across the parallel resistive load. This is shown in Figure 5. The recommended IEEE voltage harmonic limit of 5% is exceeded when approximately 750 CFLs are deployed. The losses on the 100m line due to the harmonic currents vary from 8mW to 0.24W as the number of CFLs varies from 50 to 1500.
3.2.2. Case 2: CFLs with Different THD Values
The effects of two different combinations of CFLs are examined. These are:
(1)CFL-1 and CFL-2 only
(2)CFL-1, CFL-2 and CFL-7 only, where CFL-7 has a THDI value of 49.278%.
Figure 4. Simulink model of electrical system for investigating the effects of
varying numbers and combinations of CFLs.
Figure 5. Variation of the harmonic voltage levels across the lumped
resistive load RL with increasing CFL-1.
1) RL =
∞
: When CFL-1 and CFL-2 form the only loads in the system, and they are progressively increased, there is no change in the THDV values across the system impedances and the THDI values of the current flowing through them. They all remain constant at a value of 83.52%. However, the magnitude of harmonic current injected into the system increases in proportion to the amount of CFLs deployed. Similarly, progressively increasing the numbers of CFL-1, CFL-2 and CFL-7 maintains the THDV and THDI values constant, but at a lower value of 63.38%.Figure 6. Variation of the harmonic voltage levels across the lumped
resistive load RL with increasing CFL-1 and CFL-9. They are deployed in
equal numbers.
2) RL=100Ω: Progressively increasing the numbers of CFL-1 and CFL-2 from 100 to 2000, with an equal deployment for both types of lamps on each iteration, results in an increase in the THDV values across the
0 2 4 6 8 10 12
50 100 500 1000 1500
T
H
DV
a
cr
o
ss
R
L
(%
)
parallel resistive load from 0.33% to 7.17%. The recommended IEEE voltage harmonic limit of 5% is exceeded when approximately 1450 CFLs, consisting of an equal number of CFL-1 and CFL-2, are deployed (Figure 6). The limit is attained when the CFLs comprise 19.27% of the total possible system loading. The voltage waveform across the load and the PCC when the recommended harmonic voltage limit is just about exceeded is shown in Figure 7. The losses on the 100m line due to the harmonic currents vary from 8mW to 0.16W as the number of CFLs varies from 100 to 2000.
Figure 7. Distorted voltage across RL when CFL-1 = CFL-2 = 750.
When the numbers of CFL-1, CFL-2 and CFL-7 are progressively increased from 300 to 3000, the harmonic voltage distortion across the lumped resistive load RL varies from 0.74%
to 8.24%. The THDV limit across RL is attained when the total
number of CFLs is approximately 1950, consisting of 650 each of the three types of CFLs (Figure 8). The CFL loading at this point represents 23.26% of the maximum possible system loading. The voltage waveform when the harmonic voltage at the PCC just about exceeds the recommended limit of 5% is similar to that shown in Figure 7. The losses on the 100m line due to the harmonic currents vary from 16.2mW to 162mW as the number of CFLs varies from 300 to 3000.
4. Discussion
Out of nine (9) tested CFLs, four (4) had a THDI value
exceeding 100%, implying a correspondingly low power factor and highly distorted current waveform. Such lamps draw a higher current than necessary for their rated power and hence shorten the effective capacity of the distribution system. The foregoing is cause for concern since the nine (9) brands considered in this study represent a significant portion of the branded CFLs in the Indian market. It implies that widespread use of CFLs will result in a significant amount of harmonic currents being injected into the electrical network. The lumped resistance RL considered in this study is representative only of
thermal loads connected to the distribution transformer considered as the voltage source in this study. The harmonic currents of the CFLs due to any number of consumers would propagate through the network impedances and cause voltage distortion at the Point of Common Coupling (PCC) and across the linear loads of other consumers. Thus, the distorted voltage at the PCC, due to the CFLs in the system, is also the voltage
across RL. For simplicity, other harmonic-producing loads which
form a significant portion of most electrical networks nowadays have been neglected in this study. Therefore, it is logical to assume that harmonic levels in the simplified network model considered in this study are conservative and much higher voltage distortion levels should be present. This study also shows that harmonic levels due to CFLs with high THDI values
will be offset somewhat by CFLs with much lower THDI values.
Thus, under conditions where sales of the various brands of CFLs are more or less equal, adverse consequences of large scale CFL use would be somewhat lessened. However, if the market share is dominated by CFLs with low power factors, then the quality of power would be affected.
Figure 8. Variation of the harmonic voltage levels across the lumped
resistive load RL when CFL-1, CFL-7 and CFL-9 are increased.
Line losses due to harmonic currents have the potential to approach high levels and are also a source of concern. When a line is much longer than the 100m length used in this study, there would be significantly greater resistance and line losses.
Over the last few years, the number of CFLs manufactured in India has been steadily rising. While the number for other types of lamps, LEDs excepted, has more or less remained constant, the amount of CFLs manufactured has steadily increased from 67 million in 2005 to 453 million in 2013 [18]. And based on the situation in other countries around the world, there is every indication that CFL production in India will continue to rise. Thus, the quality of CFLs manufactured in India, and harmonic levels at key points in the electrical network must be continually monitored so that, if needs be, mitigation strategies can be implemented.
5. Conclusion
The main conclusions of this study are:
(1)There is a proliferation of highly non-linear CFLs with inadequate or no power factor correction circuitries in the market in India, a situation that can, over time, significantly contribute to high harmonic current levels and degradation of the quality of power in the electrical network.
(2)Harmonic interaction and mitigation among CFLs, and other non-linear loads as well, in electrical networks may contribute to a reduction of harmonic levels and
0 0.01 0.02 0.03 0.04 0.05 0.06
-400 -200 0 200 400 V o lt a g e ( V )
Time (s) 0
1 2 3 4 5 6 7 8 9
300 600 750 1500 2250 3000
T H DV ac r os s R L (% )
their adverse effects.
(3)Manufacturers need to continue to strive for improvement in the quality of their CFLs since the added cost for incorporating power factor correction circuitry is minimal. As an alternative measure, CFL use should be minimized if not altogether eliminated, and LED use be more widespread.
Acknowledgements
The authors are thankful to the Department of Electrical and Electronics at NITK for supporting this study.
References
[1] M. Abbaspour and A. H. Jahanikia, “Power quality considerations in the widespread use of compact fluorescent lamps”, Proceedings of the 10th IEEE International Conference on Electrical Power Quality and Utilisation (EPQU), pp. 1-6, Sept. 2009.
[2] Janak Acharya and Alexandre B. Nassif, “An investigation on the harmonic attenuation effect of modern compact fluorescent lamps”, Proceedings of the 13th IEEE International Conference on Harmonics and Quality of Power (ICHQP), Sept. 2008.
[3] Jordi Cunill-Sola and Miquel Salichs, “Study and characterisation of waveforms from low watt (<25W) compact fluorescent lamps with electronic ballasts”, IEEE Transactions on Power Delivery, pp. 2305-2311, Oct. 2007.
[4] R. A. Jabbar et al, “Impact of Compact Fluorescent Lamp on Power Quality”, Proceedings of the Australasian Universities Power Engineering Conference (AUPEC), pp. 1-5, Paper P-025, December 2008.
[5] A.F. Abd El-Gawad, “Studying the impact of different lighting loads on both harmonics and power factor”, Proceedings of the 42nd International Universities Power International Conference (UPEC), pp. 109-114, Sept. 2007.
[6] S.G. Abeyratne and K. D. A. Munasinghe, “Power quality and harmonic loads”, Proceedings of the 1st IEEE International Conference on Industrial and Information Systems (ICIIS), pp. 52-57, August 2007.
[7] M. Akmal, R. Arif and S.A. Qureshi, “Power quality based comparison of compact fluorescent lamp with fluorescent light”, Proceedings of the 3rd International Conference on Electrical Engineering (ICEE), pp. 1-6, April 2009.
[8] M. Maksic and D. Matvoz, “Impact of compact fluorescent lamps on the electric power network”, Proceedings of the 13th IEEE International Conference on Harmonics and Quality of Power (ICHQP), Sept. 2008.
[9] F.V. Topalis et al., “Influence of large-scale installation of energy saving lamps on the line voltage distortion of a weak network supplied by photovoltaic station”, IEEE Transactions on Power Delivery, vol. 19, no. 4, pp. 1787-1793, October 2004.
[10] M. Rawa, D. Thomas and M. Sumner, “Experimental Measurements and Computer Simulations of FL and CFL Lamps for Harmonic Studies”, Proceedings of the 2014 UKSim-AMSS 16th International Conference on Computer Modelling and Simulation, pp. 335-339, March 2014. [11] Debanka De, S. Sahana, B. Roy, “Performance analysis of
fluorescent and LED light system”, 2016 International Conference on Computer, Electrical & Communication Engineering (ICCECE), December 2016.
[12] N. Milardovich et al, “On the reduction of the third-order harmonic losses in low–voltage power cables used for feeding large LED and CFL lighting loads”, Journal of Advanced Electromagnetics, vol. 6, no. 3, pp. 46-52, October 2017. [13] J. Molina and L. Saintz, “Compact Fluorescent Lamp
Modeling for Large-Scale Harmonic Penetration Studies”, IEEE Transactions on Power Delivery, pp. 1523-1531, October 2014.
[14] IEEE Std. 519-1992, “Recommended practices and requirements for harmonic control in electrical power systems”, New York, USA, April 1993.
[15] IEEE Working Group on Nonsinusoidal Situations: Effects on Meter Performance and Definitions of Power, “Practical definitions for powers in systems with nonsinusoidal waveforms and unbalanced loads : A Discussion”, IEEE Transactions on Power Delivery, vol. 11, no. 1, pp. 79-101, January 1996.
[16] R. Gilleskie and W. M. Grady, “Harmonics and how they relate to power factor”, Proceedings of the Electric Power Research Institute (EPRI) Power Quality Issues and Opportunities Conference (PQA ’93), November 1993. [17] IEEE Std. 1459-2010, “Standard definitions for the
measurement of electric power quantities under sinusoidal, nonsinusoidal, balanced, or unbalanced conditions’, New York, March 2010.