ISSN: 2306-9007 Khouja (2015) 527
I
www.irmbrjournal.com June 2015I
nternationalR
eview ofM
anagement andB
usinessR
esearchV
ol. 4 Issue.2R
M
B
R
Financial Development and Optimal Exchange Rate Regime
Choice in Developing Countries
IMEN KHOUJA
Higher Institute of Management, DEFI Research unit, University of Tunis, Tunisia. Email: [email protected]
Tel: +21698268050
Abstract
After more than 40 years of the current monetary system, the issue of the optimal choice of the exchange rate regime remains unresolved. Indeed, we experienced a diversity of regimes and an instability of the choices made with many countries switching from one regime to another. The paper investigates empirically the possible link between financial development and the choice of optimal exchange rate regime. To measure financial development, we introduce a composite index via the aggregation of five indices representing the key characteristics of the financial system in 51 developing countries over the period 1996-2007. The aim is to better consider the multidimensional dynamics of financial sector development. We use a multinomial logit model with panel data of the same countries and period. We consider two classifications of exchange rate regimes: “de jure” and “de facto”. The results suggest that financially developed countries are more likely to adopt the floating regime. It appears also that the choice of a floating regime is, notably, enhanced by financial openness and financial markets development.
Key Words: Exchange Rate Regimes, Developing/Emerging Countries, Financial Development Index Construction, Multinomial Panel Logit Model.
Introduction
Since the demise of the Bretton Woods system, exchange rate choices have been in the heart of policy debates amongst both academicians and politicians. Exchange rate regime choice approaches make some useful contributions, but the tradeoff between fixed and flexible regime is not yet resolved.
These approaches can be divided into two groups, traditional and modern approaches. Traditional exchange rate regime approaches focus on the optimal conditions for macroeconomic adjustments in an open economy. The optimal currency area (OCA thereafter) (Mundell, 1961; McKinnon, 1963; Kenen, 1969) relates the exchange rate regime choice to the country’s size, openness, trade links and factors mobility. The stabilization approach associated to the Mundell-Fleming framework considers real-nominal variability tradeoff according to which fixed (flexible) exchange rates are preferred as shock absorber in a country facing mainly nominal (real) shocks. These approaches examine mainly good and labor markets equilibrium and ignore the financial market. Otherwise, empirical literature shows the limited ability of these approaches to predict real countries regimes choices especially in developing countries (Calvo and Mishkin, 2003).
ISSN: 2306-9007 Khouja (2015) 528
I
www.irmbrjournal.com June 2015I
nternationalR
eview ofM
anagement andB
usinessR
esearchV
ol. 4 Issue.2R
M
B
R
Actually, emerging and developing countries are afraid to allow their exchange rate to fluctuate because of the balance sheet implications in financially dollarized economies, even announcing flexible regimes ((Eichengreen and Hausmann, 1999).
Arguments advanced by these last two theoretical approaches suggest opposite implications of financial sector openness on exchange rate regime choice. Impossible trinity states that financial integration enhances financial innovation and sophistication, which reduces the effectiveness of capital controls and leaves to monetary authorities the only choice of floating to ensure their independence. Although, the “fear of floating” theory suggests a fixed regime in a country financially open and largely indebted in foreign currency.
Furthermore, currency crises of the last decade of the twentieth century and their devastating consequences point to the financial sector weaknesses as potential causes of these crises. So, literature on currency crises prevention focuses, among others, on the exchange rate regime that shelters the economy from such crises (Frankel and Rose, 1998; Chang and Velasco, 2000).
Otherwise, financial development conditions the effect of monetary policy on growth. Financial system weakness prevents a flexible regime to play its countercyclical role to absorb an external chock (Céspedes, Chang and Velasco, 2004). This idea is later formalized by Aghion et al.(2009). They conclude that weak and repressed financial sector combined with a flexible exchange rate regime hinders productivity growth. These theoretical developments suggest that financial sector development affect exchange rate regime choice. So, in this paper, we attempt to empirically investigate the role of financial development in the choice of exchange rate regime.
But, measuring financial development is a difficult task. Financial development is a multifaceted concept that cannot be captured by standard indicators such as the ratio of broad money (M2) to GDP or credit on private sector to GDP1. Also, several studies highlight the role of institutional development (Schleifer and
Vishny (1997), Levine (1997, 98), La Porta et al.(1998)) and financial liberalization (Mc-Kinon and Shaw(1973), Menzie and Hiro (2002), Klein and Olivei (2008)) in the financial sector development, but these aspects are ignored in measuring this concept.
To respond to our central research question, we, first, build a composite index of financial development by aggregating five subindices representing five facets of the financial sector: (1) monetary sector development, (2) banking sector development, (3) nonbank financial sector development, (4) financial openness and (5) institutional development. We use a multinomial discrete choice model on panel data of 51 developing countries over the 1996-2007 period. We consider, successively, “de jure” and “de facto” regime classifications in order to detect potential differences between actual and official monetary authority decisions. Significant and robust results are found that financial development favors the choice of a floating regime.
In a second stage, we try to shed light on the most important aspects of the financial sector for the exchange rate regime choice, by replacing the financial development index by the five sector indices. Results reveal that all financial sector development components favor the official choice of a floating regime. But, only banking sector and financial openness, affect actual floating regime choice.
This paper contributes to the existing literature on exchange rate regime choice on several aspects. First, it introduces a more representative measure of financial development that covers the multifaceted financial system. It fills gaps on measuring financial development in previous literature. Second, it studies the effect of each sector index on the choice of exchange rate regime. This is, to our knowledge, the first contribution
1 These measures are criticized by several authors (Pill and Pradhan (1995), Beck et al. (2000), Rajan and
ISSN: 2306-9007 Khouja (2015) 529
I
www.irmbrjournal.com June 2015I
nternationalR
eview ofM
anagement andB
usinessR
esearchV
ol. 4 Issue.2R
M
B
R
that uses aggregated measures of institutional development or nonbank financial intermediaries. It contributes to specify the financial system characteristics of a country adopting a floating exchange rate regime, compared to those of a country adopting a fixed or an intermediate regime. Third, this paper proceeds to several robustness checks of the results, which is a scarce practice in this area previous empirical literature.
The remainder of the paper is organized as follows. Section 1 presents the rationale behind a financial development index construction. Section 2 develops the index creation with components of each subindex, methodology and main findings. In section 3, we address a brief overview on the relation between financial development and exchange rate regime choice. Our empirical work is presented in section 4 by focusing on exchange regime choices and determinants, model specification, a brief descriptive analyses and estimation results. Section 5 offers our concluding remarks.
Rationale Behind Financial Development Index Construction
There is no consensus on the proper measure of financial development. Indeed, recent literature recognizes the difficulty in measuring financial development and the limits of using conventional measures. For instance, Pill and Pradham (1995) assert that conventional measures, such as the level of real interest rates, the ratio of broad money to GDP and the ratio of private sector credit to GDP, overlook important factors, such as the financial openness of the country, the competitiveness of the banking sector or the importance of capital markets in financing the economy. They may give misleading indicators about the size and efficiency of the financial sector as a whole. These measures may also be criticized for many other reasons. First, the ratio of money to GDP is closely related to monetary policy and money demand; it fluctuates for reasons that are unrelated to financial development. Second, a high ratio (M2/GDP) is generally associated with more financial depth. But this ratio may fall, if the financial system progress by the expansion of less liquid instruments. Third, measures of private sector credit are contaminated by credit to public enterprises. Fourth, the use of real interest rate in early literature on financial development reflects financial repression. But, this is just one aspect of financial development2.
At the same time, other factors have been overlooked by early studies. For instance, legal and institutional environment, that protects the rights of creditors and investors, enforces contracts and establishes credible and transparent regulatory and supervisory system, are reported to significantly contribute to financial development3. Similarly, political instability is negatively correlated with financial development (Bordo
and Rousseau, 2006). Recent studies have proposed more representative measures of financial development. The first contribution was that of Beck, Demirguç-Kunt and Levine (2000) (BDL thereafter). The authors have proposed a database of financial indicators that covers measures of size, activity and efficiency of banking and non-banking financial intermediaries, central bank and markets. Nevertheless, these indicators ignore financial openness and legal environment.
Furthermore, two interesting works attempted to build a global measure of financial system development, by aggregating measures relating to several aspects of the financial sector. First, Gelbard and Leite (1999) used measures of financial products, financial liberalization, market structure, institutional environment, financial openness and monetary policy to construct a comprehensive index for 38 sub-Saharan African countries for 1987 and 1997. Second, Creane and al. (2007) created a comprehensive index for 20 MENA countries for 2000-01 and 2002-03 using a 48-question survey that covered six themes: monetary sector, banking sector, nonbank financial sector, regulation and supervision, financial openness and institutional environment.
2 Gelbard and Leite (1999).
3 La Porta and al. (1997, 1998) have shown that such legal environment is associated with more developed
ISSN: 2306-9007 Khouja (2015) 530
I
www.irmbrjournal.com June 2015I
nternationalR
eview ofM
anagement andB
usinessR
esearchV
ol. 4 Issue.2R
M
B
R
Following a similar approach, we construct a composite index by the aggregation of five indices covering: banking sector, nonbank intermediaries and markets, financial openness, monetary sector and institutional environment.
Our index improves the measure of financial development from the two previous indices at several levels. First, we retain more precise measures than yes/no questions. For instance, ratings on interest rate liberalization or foreign banks’ importance in the banking sector are more informative than questions such as, are interest rates liberalized or not? Or, are there foreign banks? Second, we use precise measures of legal, political and institutional environment. Third, our index covers a large sample of developing countries from several regions over a period of twelve years from 1996 to 2007.
A Composite Financial Development Index Creation
In an overview of financial system development, we consider five areas: (1) banking sector, (2) nonbank financial sector, (3) financial openness, (4) monetary sector, and (5) institutional environment. Each of these areas is represented by a number of attributes, totalizing 33. The attributes constituting each area, their measures and sources of data are summarized in table (1) appendix (A).
Components of sector indices
The selection of attributes was based on empirical literature revealing their relevance in financial system development.
The banking sector area includes measures of size, activity and efficiency of deposit money banks. A key measure of banking system efficacy is its size. The greater the size of the banking system, the bigger the amount of resources channeled from savers to investors. But measures of size overlook the efficiency of the banking activity. So, indicators of net interest margin and importance of overhead are also considered. Otherwise, banks operating in a competitive environment, with the presence of foreign banks, low state intervention and low concentration are more efficient. Thus, ratings measuring the presence of foreign banks in the sector, the degree of concentration and the importance of public banks, are retained4.
The nonbank financial sector area includes, together, attributes related to nonbank financial intermediaries and markets. Importance of nonbank financial intermediaries, considered as competitors and substitutes of banks, is captured by measures of size and activity. Insurance sector (life and nonlife) activity is also captured5 . Concerning financial markets, economic theory suggest that they stimulate long term growth by
encouraging specialization, acquisition and dissemination of information and efficient mobilization of savings. Empirical studies validate a positive effect of liquid financial markets on capital accumulation and economic growth6. Moreover, measures of public and private bond markets are included to capture
diversity of financing means7.
4 La Porta, Lopez-de-Silanes and Shleifer (2002) show that countries with high share of public banks in the
banking system have lower subsequent growth. Foreign banks presence reflects an investment and competitive climate in the country (Adrianova et al . 2008). Levine (2003) found that restrictions on foreign bank entry lead to higher interest margins. Beck et al (2003) found that non-concentrated banking system is less prone to systemic crises. Highly concentrated banking sector hinders growth of other sectors (Cetorelli and Gambera, 2001).
5
Insurance companies provide wide coverage of commitments, create liquidity, allow economies of scale in investments and help to mobilize illiquid saving , which positively influences growth (Lin, 2007).
6 Among these studies: Levine and Zervos (1998), Demirguç-Kunt and Levine (2001) and Levine (2001). 7 Fink and al. (2003), controlling for other factors, found that bond market development results in economic
ISSN: 2306-9007 Khouja (2015) 531
I
www.irmbrjournal.com June 2015I
nternationalR
eview ofM
anagement andB
usinessR
esearchV
ol. 4 Issue.2R
M
B
R
The financial openness area considers capital account liberalization by ratings reflecting the importance of restrictions on foreign currency detention, capital movement and access to international capital market. The importance of parallel exchange rate market is, also, included. Restrictions on capital account, as well as multiplicity of exchange rates or misalignment of the official exchange rate, deprive an open economy to benefit from foreign capital inflows, and a domestic investor to take advantage of international investment opportunities8.
It must be noted, however, that literature on financial liberalization and financial crises stresses that, unexpectedly and not accompanied by regulation and supervision measures, openness of capital account, increases the risk of financial system meltdown9.
The monetary sector and monetary policy area is represented by measures of relative and absolute size of the central bank, conductor of monetary policy and playing an important role in regulation and supervision of the financial system. It also considers the provision of liquidity services by the financial system by introducing an indicator of financial intermediation (M2/GDP). In addition, we examine liberalization of interest rates that reflects the use of indirect monetary policy instruments by the government, as opposed to direct controls.
The institutional environment area includes measures related to judiciary, institutional and political environments. Judicial system influences the performance of the financial sector. Sound legal environment should reduce information and transaction costs in the financial system (Levine, 1997)10. So we consider ratings of the ease of loan recovery through the judicial system, property rights, rules of law, and legal system origin. We try, also, to evaluate the quality of institutions involved in financial transactions by measures of bureaucratic quality, corruption and regulation quality11. Furthermore, political stability
reassures investors. It is why some countries, and not others, develop and insure proper functioning of institutions that protect investors’ rights12.
Methodology
The approach used is to compute separate indices to measure each area identified above, as well as a global index of financial development. All indices are measured on a 0-100 scale in ascending order of financial development. All attributes are quantitative measures, except legal system origin. A trichotomous variable was introduced to capture if legal system origin is Islamic charia, common law or civil law. The sample includes a number of Arab and Muslim countries that legal system is based on the Islamic charia. Such a system restricts financial transactions. Thus, legal system origin variable takes the value 0 if it is Islamic charia, 50 if it is common law and 100 if it is civil law13.
8
Calvo and Reinhart (2000)
9 Among financial liberalization literature: Klein and Olivei (2008) et Menzie and Hiro (2002). Among
financial crises literature: Aizenman (1999), Calvo and Reinhart (2000), Mishkin (2001)
10
La Porta and al. (1998) find that legal system origin influences the effectiveness of laws governing relations between debtors and creditors. Levine, Loayza and Beck (2000) find that countries with protecting rights of creditor’s legal system and international standards of auditing, accountability and information dissemination are more financially developed.
11Djankov and al. (2005) examine measures of business environment regulation, including investor’s right
protection, and conclude for their positive and significant impact on growth.
12 Outreville (1999) validate empirically, on a sample of 57 developing countries, the negative impact of
political instability on financial development.
13 According to Bordo and Rousseau (2006), civil law countries are more financially developed than
ISSN: 2306-9007 Khouja (2015) 532
I
www.irmbrjournal.com June 2015I
nternationalR
eview ofM
anagement andB
usinessR
esearchV
ol. 4 Issue.2R
M
B
R
All other attributes are converted into the 0-100 scale, according to the following formula of interpolation between maximum and minimum values:
dij = [(kij – min i=1,…n kij )/(max i=1,…n kij - min i=1,…n kij)] * 100 (1)
where i indicates the n countries for which information is available, j indicates the m attributes measured,
kij is the value of attribute jfor country i, and dij is the measure within the 0-100 scale of that attribute.
Each index is subsequently constructed as a simple average of the values associated to its attributes:
Indexi = [ ∑ij=1,…m dij ]/ m (2)
For the particular case of institutional environment area, the index is:
Indexi = [ ∑ij=1,…m dij + ei]/ m (3)
Where ei is the value associated to the response of the legal system origin question of the country i.
The overall financial development index is computed, for each country, as the average of the five indices previously calculated.
The indices were compiled on a sample of 51 developing countries over the period 1996-2007 on an annual frequency. Starting from all developing countries, we have been constrained to retain only these, because of the lack of data for all attributes. The period was, also, limited, notably because calculating of almost all ratings of institutional environment started at 1996 for the countries considered. The list of countries is reported in Appendix A.
Findings
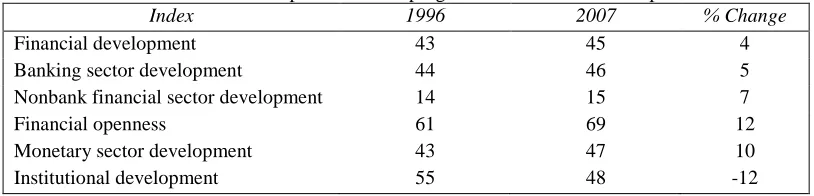
One of the main findings from the indices compiled is that significant disparities exist between countries and in their financial progress over time. Though, annual changes are insignificant. Thus, we discuss here results relative to 1996 and 2007 in order to observe tendency over a decade and show cross-country and regional differences.
Table 1. Sample means and progression in the 1996-2007 period
Index 1996 2007 % Change
Financial development 43 45 4
Banking sector development 44 46 5
Nonbank financial sector development 14 15 7
Financial openness 61 69 12
Monetary sector development 43 47 10
Institutional development 55 48 -12
Source: Authors calculations
ISSN: 2306-9007 Khouja (2015) 533
I
www.irmbrjournal.com June 2015I
nternationalR
eview ofM
anagement andB
usinessR
esearchV
ol. 4 Issue.2R
M
B
R
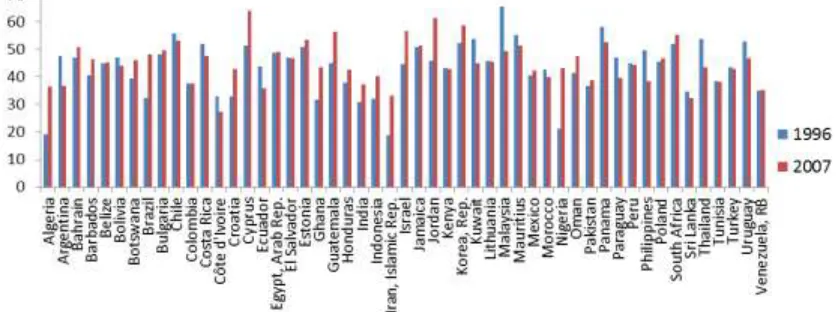
Behind this low average progress, sample countries have heterogeneous financial performances. As shown in “Figure 1” Appendix A, countries, such as Algeria, Brazil, Jordan, Israel and Nigeria, experienced a spectacular progress of their financial system (Nigeria, at the first place 105%). The main sources of this development are financial openness and nonbank financial sector by developing financial markets. While, counties like Argentina, Ecuador, Lithuania, Malaysia, Thailand and Philippines regressed, on average by 11%. Their financial sector falling-in was caused by, primarily, financial crises that weaken banking sectors and financial markets. Also, their institutional environment indicators felled. Another group of countries include “stagnant” countries (Colombia, Kenya, Pakistan, Bahrain, Barbados and Venezuela). Their financial development was slight. All their sector indices progressed poorly except institutional environment index which declined.
In order to detect regional tendencies and international financial system trends, we have grouped sample countries by region according to the regional distribution of the World Bank.
Table 2. Mean financial development index by region
Regions 1996 2007 % change
East Asia and Pacific 50,37 46,10 -8%
Europe and Central Asia 43,44 46,87 8%
Latin America and Caribbean 45,27 44,91 -1%
Middle East and North Africa 40,64 47,48 17%
South Asia 34,06 36,15 6%
Sub-Saharan Africa 38,93 44,23 14%
Source: Authors calculations
“Table 2” reveals the best initial level of financial development in East Asian countries and the worst one in South Asian countries. But, over the sampling period the pattern was reversed. East Asian countries regressed by 8%. These countries still suffer from the aftereffect of the financial crises of 1997. Contrariwise, MENA region performed considerable progress, with as leaders in the field, Bahrain, Israel and Jordan. In 2007, South Asian countries persist in the last place despite progress.
“Figure 2” Appendix A shows sectors responsible of evolutional disparities between regions. European and central Asian countries progressed, considerably, in the monetary area over the period. Several countries in this group are newly members of EU. This membership requires, inter alia, total liberalization of interest rates. MENA region countries performed substantial financial openness, Sub-Saharan African countries too. But, East Asian countries regressed in the financial openness area because of loss of international investors’ confidence and the return of restrictions on foreign currency accounts detention by residents. South Asian countries have made considerable progress on nonbank financial sector development, especially through financial markets. This region is the only progressing region in the institutional development area by improving corruption perception.
Reliability and robustness check of the financial development index
The financial development index reliability is tested using the Cronbach coefficient α. It gives the proportion of “truth” relative to measurement error in the index and verifies the unidimentional aspect of each sub index. “Table 2” appendix A reflects α computed for the financial development index and the five sector indices14. The financial development index reliability is satisfactory (α=0.85), i.e. 85% of the information reflecting financial development is included in the items selected. The sector indices have a good reliability, too.
14 The calculated α is between 0 and 1. The nearer α to 1, the more homogenous the items of each index and
ISSN: 2306-9007 Khouja (2015) 534
I
www.irmbrjournal.com June 2015I
nternationalR
eview ofM
anagement andB
usinessR
esearchV
ol. 4 Issue.2R
M
B
R
For robustness check, we compare the country ranking given by our financial development index with the ranking given by the World Economic Forum financial development index, calculated using the same methodology. Unfortunately, these two indices converge only on 23 countries and the comparison is done only for 200715. “Table 3” appendix A shows results using two nonparametric tests (Spearman rank test and Kendall rank test) to test correlation between the two raking series. The two tests reject the null hypotheses (the two series are independent). The ranking on the basis of our financial development index corroborates largely the World Economic Forum financial development ranking.
Financial Development and Exchange Rate Regime Choice: An Overview.
Traditional approaches of exchange rate regime choice are not useful in the prediction of real exchange rate regime choices, notably in developing countries. They call for countercyclical monetary policy. Céspedes, et al.(2004) address skeptical arguments about the effectiveness of countercyclical exchange rate policy in offsetting real chocks in a weak financial system country. If domestic producers are financed by a small and imperfect credit market, any depreciation of the real exchange rate because of an external shock exaggerates these imperfections; because of its effect on the value of collateral. It leads to a contraction of credit and investment. Also, foreign currency debt, a characteristic of many countries unable to borrow in domestic currency, may counteract the expansionary effect of devaluation because of balance sheet effects.
In addition, connection between banking crises and currency crises (Kamensky and Reinhart, 2003; Domaç and Peria, 2003) implies a profound rethinking of the exchange rate choice theory in which financial structure should matter (Chang and Velasco, 2000). Cartapanis and Dropsy (2005) suggest that understanding exchange regime choices in a high capital mobility world requires new macro-financial criteria. Traditional criteria based on optimum currency areas (Mundell, 1961), the incidence of macroeconomic shocks (Mundell-Fleming) and discretionary monetary policies (Barro and Gordon, 1983) have not been sufficient in the new international financial environment.
Two interesting works (Bordo, 2003) and (Bordo and Flandreau, 2003) point that the main difference between developed and developing countries is financial maturity. It is also the driving force of the international financial system evolution. Developed countries have adopted fixed regimes in the early twentieth century through the gold standard and floating regimes a century later.
During both periods, developing countries have tried to emulate them with limited success. This idea is, later, formalized by Aghion et al. (2009). The authors use a simple monetary growth model to show that exchange rate volatility exacerbates the negative investment effect of domestic credit market constraints. Large variations in firms’ profits caused by exchange rate volatility reduce firms’ external financing capability in a constrained credit market, which depress their investment (especially in R&D) and, eventually curtail the country’s productivity growth. They conclude that when financial development is limited, flexible regime would reduce productivity growth.
Empirically, variables related to financial liberalization, financial markets depth and other financial sector performance measures are often ignored in studies about exchange rate regime choice. Nevertheless, some recent empirical studies have integrated financial determinants in models of optimal exchange rate regime choice: Liquid liabilities (Von Hagen and Zhou, 2007; Markeiwicz, 2005); the ratio of domestic credit to the private sector on GDP (Calderon and Schmidt-Hebbel, 2008; Lin and Ye, 2011); capital account controls (Markeiwicz , 2005; Carmignani et .al ,2008); quasi money over money ( Levy-Yeyati et. al, 2010). Unfortunately, econometric results are not stable and robust.
15The World Economic Forum published its first financial development report on 2008, based on data of
ISSN: 2306-9007 Khouja (2015) 535
I
www.irmbrjournal.com June 2015I
nternationalR
eview ofM
anagement andB
usinessR
esearchV
ol. 4 Issue.2R
M
B
R
Empirical Validations
In this section, we first present the three categories of exchange rate regime choices and the “de jure” and “de facto” classifications selected. We, then, specify the multinomial logit model used. In the third subsection, we analyze a few descriptive statistics. Finally, we discuss and interpret estimation results.
Exchange Rate Regime Choices and Determinants
For exchange rate regime choices, we select three categories (fixed, intermediate and floating). Dichotomous classification fixed versus flexible is not relevant here. The regimes adopted by the sample counties cover a wide range of alternatives, some of which do not fall neatly into the fixed/flexible dichotomy. Moreover, several previous studies highlight the relevance of considering three exchange rate regime categories16. Intermediate regimes have their own determinants. Descriptive statistics presented later support this observation.
Furthermore, classifying exchange rate regimes by itself is a controversial task. Discrepancies between declared exchange rate regimes and actual ones exist and are well documented as a research topic. Previous works have developed “de facto” classifications based on the actual behavior of exchange rate and reserves17. While, official “de jure” classification is annually published by the International Monetary Fund (IMF) based on country reports. Previous work using these two classifications did not agree on the superiority of one another18. Official exchange rate regime classification “de jure” is based on the regime announced by the monetary authorities. The announcement itself reflects that the authority considers this regime as the most suitable for the country. Thus, it can influence the monetary policy and the market expectations about the exchange rate behavior. The "de facto" classification allows us to understand why some countries deviate, in practice from their official claims, while others do not.
In this paper, we study the two classifications of exchange rate regimes “de jure” and “de facto”. Comparison between the results of the two classifications helps us to realize if official choices and actual behavior are conducted by the same determinants or not. Data for the “de jure” classification are collected from the Annual Report on Exchange Arrangements and Exchange Restrictions of the IMF. We aggregate the eight categories specified by the fund on three categories depending on their degree of flexibility (absent, moderate or total)19. Data for the “de facto” classification is obtained from Levy-Yeyati and Sturzenegger database that covers 187 countries over a long period of time and updated until 2007. The database provides a classification in three categories (fixed, intermediate, and floating) that we retain. Two other “de facto” classifications are also used for robustness checks20
.
Recall that we are studying the role of financial development in exchange rate regime choices. Our main variable of interest is the level of financial development that we have measured by the composite financial development index (FDI thereafter) computed in the previous section. Another measure of financial development used in the standard literature, liquid liabilities over GDP, is also introduced for robustness check of the results. In a second stage, we study the effect of each component of financial sector development taken separately. We replace the FDI by the five sector indices relative to the five facets of the financial system development considered: (1) Banking sector development (BSD), (2) Nonbank financial
16 Masson (2001), Juhn and Marou (2002), Papaiouanou (2003), Von Hagen and Zhou (2007). 17 Bubula and Otker-Robe(2002), Reinhart and Roggof (2004), Levy-Yeyati et Sturzenegger (2005). 18 Husain et .al (2004), Genberg and Swoboda (2005), Grauwe and Schnabl (2008).
19
No separate legal tender regimes such as dollarization and currency union, currency boards and hard pegs are classified as fixed regimes. Conventional fixed pegs, horizontal bands, crawling pegs, crawling bands and managed floating are grouped under the category of intermediate regimes. Independently floating is the lone regime in the floating category.
20We use Bubula and Otker-Robe(2002) and Reinhart and Roggof (2004) classifications
ISSN: 2306-9007 Khouja (2015) 536
I
www.irmbrjournal.com June 2015I
nternationalR
eview ofM
anagement andB
usinessR
esearchV
ol. 4 Issue.2R
M
B
R
sector development (NFSD), (3) Financial Openness (FO), (4) Monetary sector development (MSD), (5) Institutional development (ID).
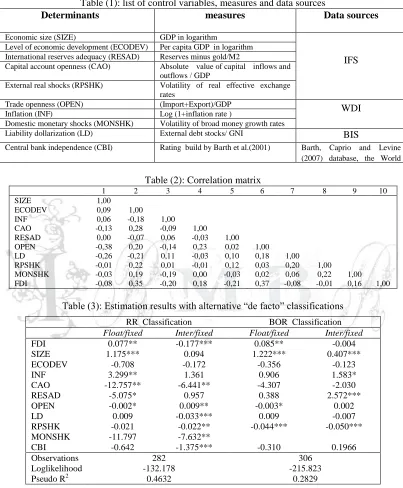
Drawing on theoretical approaches and empirical findings, we consider control variables based on OCA fundamentals, stabilization and credibility considerations, impossible trinity, “fear of floating” and currency crises prevention. For OCA fundamentals, we select economic size (SIZE), level of economic development (ECODEV), economic openness (OPEN) and inflation level (INF). To reflect stabilization strategies, we consider nominal chocks by domestic monetary shocks (MONSHK) and real shocks by relative price shocks (RPSHK). To apprehend credibility considerations, we consider an index measuring the supervision authority independence namely the central bank (CBI). We proxy “fear of floating” by a measure of liability dollarization (LD). To measure the impossible trinity effect, we consider de facto capital account openness (CAO). Finally, to proxy the risk of currency crises, we include international reserves adequacy (RESAD). The measures of these variables and the data sources are detailed in table (1) appendix (B).
Interactions between explanatory variables and the dependent variable raise econometric problems. Indeed, variables such as inflation and international reserves raise the problem of reverse causality with exchange rate regimes. Fixed exchange rate is unsustainable with high inflation. But fixed regime is widely used in a strategy of reducing inflation. Similarly, a country adopting a floating regime does not need high levels of international reserves. But low reserves levels lead a country to choose a floating regime21. Moreover, contemporaneous interactions between economic fundamentals and exchange rate regime strategies raise an endogeneity problem. To overcome these estimation problems, lagged, by one year, explanatory variables are introduced in the model.
Model specification
The dependent variable Yit denotes the exchange rate regime choice of county i in year t. It is a discrete
variable such as Yit= 0, 1, 2 for fixed, intermediate and flexible regimes respectively. Countries choose the
exchange rate regime that maximizes their utility. This implies that:
Pr (Yit = j) = Pr (Uitj > U itk ) j, k = 0, 1, 2 et k ≠ j (4)
j is considered as optimal, since the utility given by the regime j to the country i is greater than the utility given by any other regime k.
Uitj denotes the unobserved utility that country i drives in year t from the exchange rate regime j. It is assumed to depend of a linear vector of explanatory variables Vitj and a random error εij. Vitj depends on the characteristics of the county i in the year t Xit.
Uitj = Vitj + εij (5)
Vitj = βj Xit (6)
βj is a vector of coefficients which depends only the possible choices of exchange rate regime. εij is independently and identically distributed (i.i.d) across, countries, years and regimes.
Since we can observe only Vitj, we estimate the probability that country i chooses exchange rate regime j using a multinomial logit model on panel data of 51 developing countries over 1996-2007 period.
21 Among studies that discuss reverse causality: Juhn and Mauro, 2002 ; Calvo and Mishkin, 2003 ;
ISSN: 2306-9007 Khouja (2015) 537
I
www.irmbrjournal.com June 2015I
nternationalR
eview ofM
anagement andB
usinessR
esearchV
ol. 4 Issue.2R
M
B
R
A multinomial logit specification of the model implies that:
Pr (yit = j) = , j = 0, 1, 2 (7)
With β0 = 0, for normalization. We assume fixed regime as base category. The probability related to the base category is:
Pr (yit = 0) = (8)
So,
Pr (yit = j) = (9)
The β coefficients are interpreted relatively to the base category.
The model is estimated using the maximum likelihood estimator. The log-likelihood function for the whole sample is given by:
Log L(y, , ,…. )= – (10)
It should be noted that a multinomial logit model is conditioned by the restrictive hypothesis IIA (Independence of Irrelevant Alternatives). We verify this hypothesis using the Hausman test.
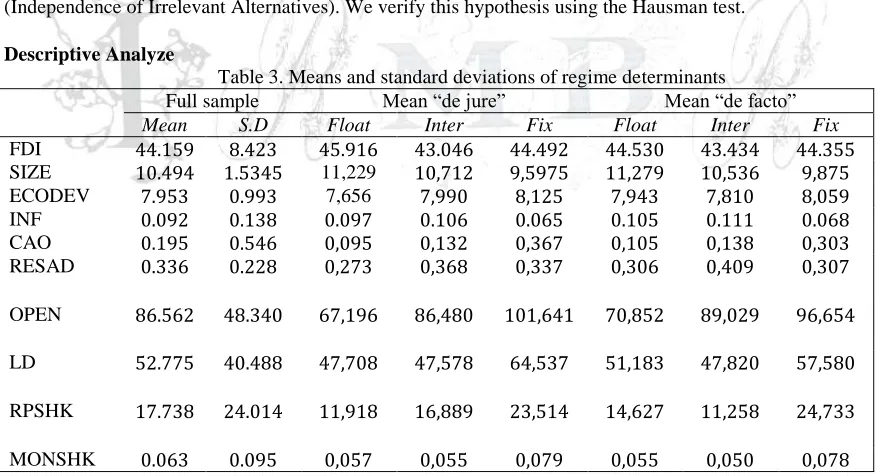
Descriptive Analyze
Table 3. Means and standard deviations of regime determinants
Full sample Mean “de jure” Mean “de facto”
Mean S.D Float Inter Fix Float Inter Fix
FDI 44.159 8.423 45.916 43.046 44.492 44.530 43.434 44.355 SIZE 10.494 1.5345 11,229 10,712 9,5975 11,279 10,536 9,875
ECODEV 7.953 0.993 7,656 7,990 8,125 7,943 7,810 8,059
INF 0.092 0.138 0.097 0.106 0.065 0.105 0.111 0.068 CAO 0.195 0.546 0,095 0,132 0,367 0,105 0,138 0,303
RESAD 0.336 0.228 0,273 0,368 0,337 0,306 0,409 0,307
OPEN 86.562 48.340 67,196 86,480 101,641 70,852 89,029 96,654
LD 52.775 40.488 47,708 47,578 64,537 51,183 47,820 57,580
RPSHK 17.738 24.014 11,918 16,889 23,514 14,627 11,258 24,733
MONSHK 0.063 0.095 0,057 0,055 0,079 0,055 0,050 0,078
ISSN: 2306-9007 Khouja (2015) 538
I
www.irmbrjournal.com June 2015I
nternationalR
eview ofM
anagement andB
usinessR
esearchV
ol. 4 Issue.2R
M
B
R
the lowest inflation and the biggest openness, but they have the highest levels of liability dollarization in the sample. Intermediate regime countries are characterized by high inflation and reserves accumulation. Moreover, the mean values of most variables grew not monotonically when the flexibility of the exchange rate regime rises. This suggests that explanatory variables have different impacts on intermediate and floating regimes, both relative to fixed ones. This supports our choice of a non-ordered multinomial model rather than a binary or an ordered choice model.
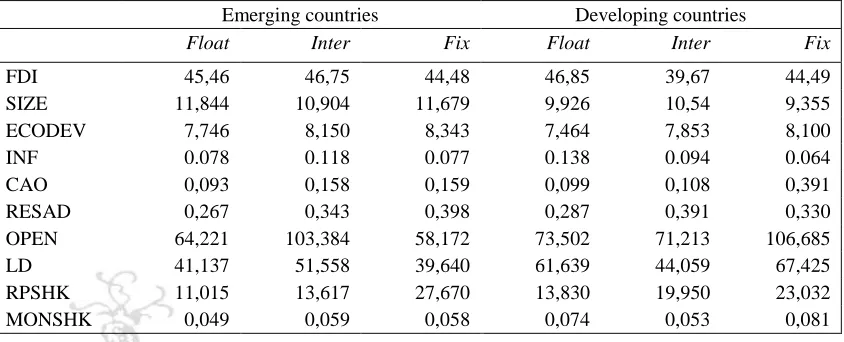
Table 4. Means of regime determinants by country group
Emerging countries Developing countries
Float Inter Fix Float Inter Fix
FDI 45,46 46,75 44,48 46,85 39,67 44,49
SIZE 11,844 10,904 11,679 9,926 10,54 9,355
ECODEV 7,746 8,150 8,343 7,464 7,853 8,100
INF 0.078 0.118 0.077 0.138 0.094 0.064
CAO 0,093 0,158 0,159 0,099 0,108 0,391
RESAD 0,267 0,343 0,398 0,287 0,391 0,330
OPEN 64,221 103,384 58,172 73,502 71,213 106,685
LD 41,137 51,558 39,640 61,639 44,059 67,425
RPSHK 11,015 13,617 27,670 13,830 19,950 23,032
MONSHK 0,049 0,059 0,058 0,074 0,053 0,081
“Table 4” reveals opposite patterns for emerging and developing countries on several aspects, including financial development. For emerging countries, the best financial performance is achieved by intermediate regime countries. These have the worst performance in the other developing countries. Intermediate regime emerging countries have, also, a double-digit inflation and are highly open and indebted in foreign currency. Nevertheless, fixed regime developing countries better reflect the model, advocated by the literature, of a fixed regime country. They are small sized, low inflation, high open, liability dollarized and exposed to monetary chocks.
Finally, we check the correlation among the explanatory variables (see correlation matrix Appendix B). The highest correlation in absolute value is 0.38, and most of the correlations are below 0.30. The correlation matrix does not reveal any serious multicollinearity.
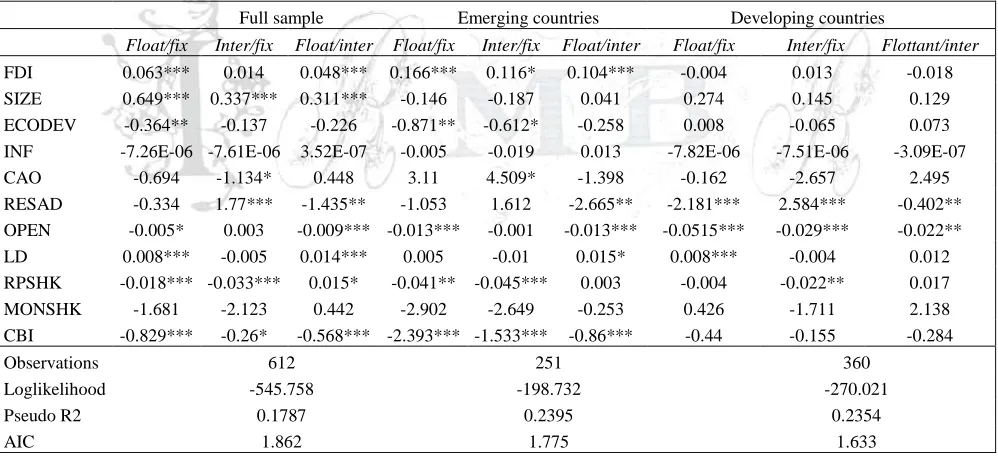
Estimation Results
We estimate the model for both “de jure” and “de facto” classifications. For each classification, we estimate the model on the full sample, then on the two country groups separately. “Table 5” and “Table 6” report the first stage estimation results of the multinomial logit model, focusing on FDI as interest variable, and using the “de jure” and “de facto” classifications, respectively. “Table 7” and “Table 8” report the second stage estimation results where we replace FDI by the five subindices discussed earlier.
ISSN: 2306-9007 Khouja (2015) 539
I
www.irmbrjournal.com June 2015I
nternationalR
eview ofM
anagement andB
usinessR
esearchV
ol. 4 Issue.2R
M
B
R
Table 5. First stage estimation results: Multinomial logit model with « de jure » classification
Full sample Emerging countries Developing countries
Float/fix Inter/fix Float/inter Float/fix Inter/fix Float/inter Float/fix Inter/fix float/inter
FDI 0.203*** 0.014 0.188*** 0.131** 0.565** 0.075** 0.394*** -0.017 0.411*** SIZE 1.075*** 0.635*** 0.439*** 0.258 -0.049 0.308 0.815*** 0.562*** 0.252 ECODEV -1.694*** -0.204 -1.489*** -1.103** -0.148** -0.955*** -2.833*** -0.198 -2.635*** INF -0.002 -7.51E-06 -0.002 0.026 4.70E-02 -0.021* -6.58E-06 -6.38E-06 -2.04E-07 CAO -2.294 -1.496** -0.798 -2.802 -2.242 -0.559 -2.351 -1.073 -1.277 RESAD -0.963 0.074 -1.038 -1.825 -0.927 -0.898 0.551 1.174* -0.623 OPEN -0.013*** 0.006** -0.019*** -0.001 0.011** -0.012*** -0.052*** -0.024*** -0.028** LD 0.004 -0.006** 0.011** 0.022 0.033* -0.01 0.017* -0.007** 0.025*** RPSHK -0.02** -0.003 -0.016* -0.038* -0.027 -0.011 -0.01 0.018*** -0.028 MONSHK -0.745 -1.972* 1.227 0.168 0.459 -0.291 -0.321 -1.094 0.773 CBI -1.057*** -0.431*** -0.627*** -0.912** -0.881*** -0.724*** -1.879*** -1.33*** -0.548
Observations 612 251 360
Loglikelihood -484.003 -174.789 -208.385
Pseudo R2 0.2529 0.2253 0.4058
AIC 1.660 1.584 1.291
Table 6. First stage estimation results: Multinomial logit model with « de facto » classification
Dealing with the first stage estimation results, based on “de jure” classification (Table 5), the FDI has a highly significant effect on the choice of a floating exchange rate regime. An increase in a country’s financial performance raises the probability of choosing a floating regime relative to fixed and intermediate ones22. This pattern fits developing countries subsample but not emerging ones. In the emerging country group, financial development favors exchange rate regime flexibility. It raises the probability of choosing floating and intermediate regimes relative to fixed one. As financial system grows gradually, emerging
22This result support the idea advanced by Bailliu(2003) that financial development is a prerequisite to a
successful choice of floating exchange rate regime.
Full sample Emerging countries Developing countries
Float/fix Inter/fix Float/inter Float/fix Inter/fix Float/inter Float/fix Inter/fix Flottant/inter
FDI 0.063*** 0.014 0.048*** 0.166*** 0.116* 0.104*** -0.004 0.013 -0.018 SIZE 0.649*** 0.337*** 0.311*** -0.146 -0.187 0.041 0.274 0.145 0.129 ECODEV -0.364** -0.137 -0.226 -0.871** -0.612* -0.258 0.008 -0.065 0.073 INF -7.26E-06 -7.61E-06 3.52E-07 -0.005 -0.019 0.013 -7.82E-06 -7.51E-06 -3.09E-07 CAO -0.694 -1.134* 0.448 3.11 4.509* -1.398 -0.162 -2.657 2.495 RESAD -0.334 1.77*** -1.435** -1.053 1.612 -2.665** -2.181*** 2.584*** -0.402** OPEN -0.005* 0.003 -0.009*** -0.013*** -0.001 -0.013*** -0.0515*** -0.029*** -0.022** LD 0.008*** -0.005 0.014*** 0.005 -0.01 0.015* 0.008*** -0.004 0.012 RPSHK -0.018*** -0.033*** 0.015* -0.041** -0.045*** 0.003 -0.004 -0.022** 0.017 MONSHK -1.681 -2.123 0.442 -2.902 -2.649 -0.253 0.426 -1.711 2.138 CBI -0.829*** -0.26* -0.568*** -2.393*** -1.533*** -0.86*** -0.44 -0.155 -0.284
Observations 612 251 360
Loglikelihood -545.758 -198.732 -270.021
Pseudo R2 0.1787 0.2395 0.2354
ISSN: 2306-9007 Khouja (2015) 540
I
www.irmbrjournal.com June 2015I
nternationalR
eview ofM
anagement andB
usinessR
esearchV
ol. 4 Issue.2R
M
B
R
countries, more integrated to international capital markets, should evolve to more flexible exchange rate regime solutions23.
Among control variables, SIZE, OPEN and CBI have expected signs. Countries with large economic size tend to choose flexible regimes because of their reluctance to give up monetary autonomy. But, ECODEV and RPSHK, though significant, have opposite signs to our previous expectations. An economic development and terms of trade shocks favor monetary control on exchange rate fluctuations. This result is at odds with the existing literature. However, it is consistent with the view that developing countries are very concerned by their competitiveness on foreign markets. So, currency fluctuations accompanying a floating regime affect country’s external competitiveness and slow down growth. Another implication is that rich countries tend to prefer fixed regimes and poor ones have flexible regimes. Finally, INF and RESAD seem to be not important for the exchange rate regime official choice, as their coefficients are insignificant.
Otherwise, intermediate regimes choice is negatively and significantly affected by an increase in CAO, LD and MONSHK. Large domestic monetary shocks point to the direction of fixed regimes. It is interesting to note that LD has opposite effects on floating and intermediate regimes. A foreign currency debt increase leads monetary authorities to maintain a tight peg relative to an intermediate regime in order to preserve banking sector from balance sheet effects, or to float leading domestic borrowers to reduce currency mismatches or cover their external positions. This result is consistent with the “hollowing out” view that intermediate regimes are not viable. Finally, INF and RESAD seem to be not important for the exchange rate regime official choice, as their coefficients are insignificant.
In Table 6 (“de facto” classification), financial development effect, is the same as “de jure” classification for the full sample and emerging countries. But, its effect disappears for developing countries, as well as CBI and ECODEV. It seems that actual behavior of monetary authorities in developing countries is not affected by financial sector development which affects official decisions, mainly in countries aiming floating regime. Monetary authority actual choices are, rather, influenced by trade openness and international reserves adequacy.
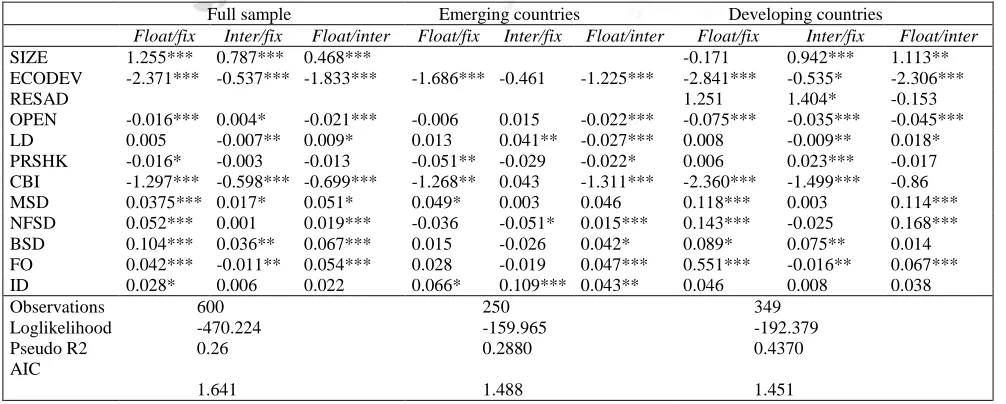
Table 7. Second stage estimation results with « de jure » classification
23 This result draws theoretical support from the « impossible trinity » arguments of Mundell-Fleming.
Full sample Emerging countries Developing countries
Float/fix Inter/fix Float/inter Float/fix Inter/fix Float/inter Float/fix Inter/fix Float/inter
SIZE 1.255*** 0.787*** 0.468*** -0.171 0.942*** 1.113**
ECODEV -2.371*** -0.537*** -1.833*** -1.686*** -0.461 -1.225*** -2.841*** -0.535* -2.306***
RESAD 1.251 1.404* -0.153
OPEN -0.016*** 0.004* -0.021*** -0.006 0.015 -0.022*** -0.075*** -0.035*** -0.045*** LD 0.005 -0.007** 0.009* 0.013 0.041** -0.027*** 0.008 -0.009** 0.018* PRSHK -0.016* -0.003 -0.013 -0.051** -0.029 -0.022* 0.006 0.023*** -0.017 CBI -1.297*** -0.598*** -0.699*** -1.268** 0.043 -1.311*** -2.360*** -1.499*** -0.86 MSD 0.0375*** 0.017* 0.051* 0.049* 0.003 0.046 0.118*** 0.003 0.114*** NFSD 0.052*** 0.001 0.019*** -0.036 -0.051* 0.015*** 0.143*** -0.025 0.168*** BSD 0.104*** 0.036** 0.067*** 0.015 -0.026 0.042* 0.089* 0.075** 0.014 FO 0.042*** -0.011** 0.054*** 0.028 -0.019 0.047*** 0.551*** -0.016** 0.067*** ID 0.028* 0.006 0.022 0.066* 0.109*** 0.043** 0.046 0.008 0.038
Observations 600 250 349
Loglikelihood -470.224 -159.965 -192.379
Pseudo R2 0.26 0.2880 0.4370
AIC
ISSN: 2306-9007 Khouja (2015) 541
I
www.irmbrjournal.com June 2015I
nternationalR
eview ofM
anagement andB
usinessR
esearchV
ol. 4 Issue.2R
M
B
R
Among control variables, SIZE and OPEN are robust to classification change for the full sample. But, RESAD, which is not significant for “de jure” classification, seems to be a significant determinant for actual exchange rate regime decisions. An increase in foreign reserves accumulation facilitates monetary authority intervention on currency market to maintain a peg.
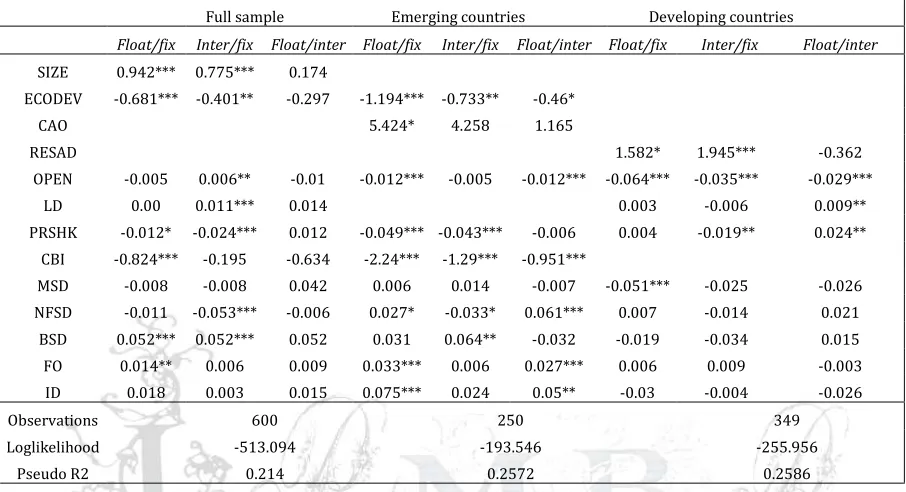
Table 8. Second stage estimation results with” “de facto” classification
Full sample Emerging countries Developing countries
Float/fix Inter/fix Float/inter Float/fix Inter/fix Float/inter Float/fix Inter/fix Float/inter
SIZE 0.942*** 0.775*** 0.174
ECODEV -0.681*** -0.401** -0.297 -1.194*** -0.733** -0.46*
CAO 5.424* 4.258 1.165
RESAD 1.582* 1.945*** -0.362
OPEN -0.005 0.006** -0.01 -0.012*** -0.005 -0.012*** -0.064*** -0.035*** -0.029***
LD 0.00 0.011*** 0.014 0.003 -0.006 0.009**
PRSHK -0.012* -0.024*** 0.012 -0.049*** -0.043*** -0.006 0.004 -0.019** 0.024**
CBI -0.824*** -0.195 -0.634 -2.24*** -1.29*** -0.951***
MSD -0.008 -0.008 0.042 0.006 0.014 -0.007 -0.051*** -0.025 -0.026
NFSD -0.011 -0.053*** -0.006 0.027* -0.033* 0.061*** 0.007 -0.014 0.021
BSD 0.052*** 0.052*** 0.052 0.031 0.064** -0.032 -0.019 -0.034 0.015
FO 0.014** 0.006 0.009 0.033*** 0.006 0.027*** 0.006 0.009 -0.003
ID 0.018 0.003 0.015 0.075*** 0.024 0.05** -0.03 -0.004 -0.026
Observations 600 250 349
Loglikelihood -513.094 -193.546 -255.956
Pseudo R2 0.214 0.2572 0.2586
Turning to the second stage estimation results, the FDI is replaced by the five sub indices representing five facets of the financial sector development. We keep only significant control variables.
Concerning “de jure” classification (Table 7), all coefficients of sector indices, to a lesser extend ID, are significant and have expected signs. They raise the probability of choosing a flexible exchange rate regime. An exception deserves to be highlighted. FO decreases to probability of choosing an intermediate regime. This view is consistent with the idea that intermediate regimes are more vulnerable to currency crises than extreme regimes, and is supported by the impossible trinity.
Large differences appear between the two country groups. For emerging counties, ID seems to be crucial for exchange rate regime official choices, but it looses all significance in developing countries. Otherwise, an emerging country choice of a floating regime relative to an intermediate one is favored by a progress in NFSD, BSD and FO. Intermediate regime choice is, also, discouraged by NFSD. MSD favors, only, the choice of a floating regime relative to a fixed one. A floating developing country needs to achieve a progress in all facets of the financial sector, except ID. An intermediate regime developing country is specially concerned by banking sector development and controlling financial openness. Sequential financial sector development starts with the banking sector development then goes through the other financial intermediaries and financial markets24. So, NFSD index progress helps achieving financial maturity, a precondition to a floating regime choice.
24 According to Hildebrand (1864), Sombart (1927) and Chick (1993), among others, financial development
ISSN: 2306-9007 Khouja (2015) 542
I
www.irmbrjournal.com June 2015I
nternationalR
eview ofM
anagement andB
usinessR
esearchV
ol. 4 Issue.2R
M
B
R
Comparing to “de jure” classification, “de facto” results reflect that financial subsector indices lose some of their relevance. ID and MSD do not have any explanatory power on actual monetary authority decisions for the full sample. Institutional variables are fairly stable over time; actual exchange rate regime policy is, rather, affected by moving conditions. A progress in BSD raises the probability of choosing a flexible regime relative to a fixed one. But FO favors, only, the choice of a floating regime relative to a fixed one. International financial integration is the last step in a financial liberalization process and allows financial maturity. This helps monetary authorities adopting successfully a floating regime25. Contrary to what is expected, NFSD coefficient has a negative sign by all, but it is only significant for the choice of an intermediate regime relative to a fixed one.
Distinction between emerging and the other developing countries shows more striking differences compared to “de jure” classification. For developing country group, no sector index has a significant effect on actual monetary authority decisions. This result is consistent with the first stage estimation results. It is worth to note an exception concerning MSD. It has a significant effect on the probability of choosing a floating regime relative to a fixed one, but with a negative sign. Monetary sector consolidation enhances monetary authority credibility, necessary to conduct successfully a pegged regime, mainly in developing countries suffering from discretionary policies and weak monetary authorities.
Nevertheless, emerging countries actual exchange rate regime policies are concerned by financial aspects. NFSD index increase raises the probability of choosing a floating regime relative to fixed and intermediate ones. But it reduces the probability of choosing an intermediate regime relative to a fixed one. Though, the banking sector progress has an opposite effect. BSD favors the choice of an intermediate regime but do not affect a floating regime choice. These results suggest that effective exchange regime choices depend on the financial sector structure. Market-based financial sector countries are more likely to choose a floating regime. However, bank-based financial sector countries seem to prefer intermediate regimes that allow monetary authority intervention to rescue banking sector in case of money devaluation or capital flows sudden-stop. Otherwise, FO and ID have a high explanatory power on the actual floating regime choice. MSD seems to be not relevant for emerging countries effective policies.
As robustness check, we estimate our model using, successively, two other “de facto” classifications, the natural classification of Reinhart and Rogoff (2004)26 (RR thereafter) and the classification of Bubula and Otker-Robe (2002)27 (BOR thereafter). In order to make these classifications comparable with the Levy-Yeyati and Sturzenegger classification used earlier, we group the 13 categories of BOR and 14 categories of RR in three categories (fixed, intermediate and floating). Estimation results summarized in “Table 3” appendix B, show that FDI is robust to classification change. It keeps a positive effect on the likelihood of choosing a floating regime relative to fixed and intermediate ones. Among control variables, SIZE and OPEN are, also, robust to classification change. They maintain their signs and significance. This confirms the high explanatory power of OCA determinants.
Also, we check of the sensitivity of the results to a change in the measure of financial development. For this, we use liquid liabilities/GDP (M2/GDP) as an alternative measure of financial development28.
The third step, banking relations are largely securitized and other financial intermediaries and financial markets contribute to drain saving and finance the economy.
25 According to the optimal process of liberalization of McKinnon (1981, 1993). 26 Updated by Ilzetzki, Reinhart and Rogoff (2008)
27
These two classifications cover the sample countries, but the BOR classification stops in 2001. For this classification, the estimation period is 1996-2001.
28 This measure of financial development is widely used in the empirical literature, in particular, as a
ISSN: 2306-9007 Khouja (2015) 543
I
www.irmbrjournal.com June 2015I
nternationalR
eview ofM
anagement andB
usinessR
esearchV
ol. 4 Issue.2R
M
B
R
Unfortunately, coefficients of (M2/GDP) are not significant for all specifications and have opposite signs to our central hypothesis.
Estimation results and robustness checks corroborate the problem raised by several authors (Juhn and Mauro, 2002, Calderon and Schmidt-Hebbel, 2008) of the sensitivity of empirical results to sample, classification, estimation method and measures of explanatory variables used. This is why it is difficult to generalize inferences on determinants of optimal exchange rate regime choice.
Conclusion
This paper focuses on the impact of financial development on the optimal exchange rate regime choice in developing countries. Before dealing with this central objective, we propose the creation of a more representative measure of the multifaceted aspect of the financial sector development. We construct a composite index of financial development by the aggregation of five subindices: (1) Banking sector development, (2) Nonbank financial sector development, (3) Financial Openness, (4) Monetary sector development and (5) Institutional development. Calculations are done, yearly, on a sample of 51 developing countries over the period 1996-2007.
Then, we return to the effect of financial development on exchange rate regime choice. We use a trichotomous choice structure with fixed, intermediate and floating as three regime options, according to “de jure” regime classification of the IMF and “de facto” classification of Levy-Yeyati and Sturzenegger. We choose a non-ordered multinomial framework as descriptive results of explanatory variables reveal a non-monotonic relationship between exchange rate regime determinants and flexibility. Besides financial development (measured by the financial development index), we consider control variables from regime determinants the most used in the empirical literature. They include OCA fundamentals, stabilization and credibility considerations, impossible trinity, fear of floating features and currency crises risks prevention.
Our estimation results confirm the central hypothesis, to so extend. Financial development favors the choice of a floating regime, but does not affect an intermediate regime choice. This result is consistent with the view advocated by Bailliu (2003), that financial sector development is a prerequisite for a floating regime choice. Among control variables, OCA fundamentals and credibility considerations have high explanatory power of exchange rate regime choices. It seems that official regime choices of monetary authorities and their actual behavior are driven by different determinants.
Moreover, distinction between emerging and developing countries in the sample is relevant. It improves the quality of the model. Indeed, each country group has its own determinants of the choice of exchange rate regime. Particularly, financial development, relevant for emerging countries, does not affect developing countries actual choices. Real monetary authority choices of developing countries, less financially developed, are conditioned by foreign dependence considerations (liability dollarization, current account and capital account openness and foreign reserves adequacy) rather than financial development.
In a second stage, we replace the financial development index by the five subindices. This allows as focusing on the most important aspects of the financial sector development for the choice of an exchange rate regime.
ISSN: 2306-9007 Khouja (2015) 544
I
www.irmbrjournal.com June 2015I
nternationalR
eview ofM
anagement andB
usinessR
esearchV
ol. 4 Issue.2R
M
B
R
Official behavior follows that of the full sample. By cons, monetary sector development is the only determinant of a floating regime actual choice.
Floating regime seems to be an optimal exchange regime choice for financially developed countries. The monetary policy implications of such a choice in developing countries are not obvious. Monetary authorities need to adopt another nominal anchor that replaces the exchange rate anchor and provides the necessary credibility to the monetary policy. Such an anchor could be an inflation targeting. We hope to address this issue in future research.
References
P. Aghion, P.Bacchetta, R. Rancière, and K. Rogoff, “Exchange Rate Volatility and Productivity Growth: The Role of Financial Development”, Journal of Monetary Economics, Vol. 56, No.4, 2009, pp. 494-513.
J. Aizenman, “ Capital Controls and Financial Crises “, NBER Working Paper No. 7398, 1999.
S. Andrianova, P. Demetriades, and A. Shortland, “Government Ownership of Banks, Institutions, and Financial Development.”, Journal of development economics, Vol.85, No.1-2, 2008, pp.218-258. J. Bailliu, “Exchange Rate Regimes in Emerging Countries », Bank of Canada Revue, Winter 2002-2003,
pp.19-30.
R. Barth, G. Caprio, and R. Levine, “The Regulation and Supervision of Banks Around the World- A New Database”, World Bank Policy Research Working Paper No.2588, 2001.
T. Beck, A. Demerguç-Kunt and R. Levine, “A New Database on Financial Development and Structure”, World Bank Economic Review Vol.14, 2000, pp. 597-605.
T. Beck, A. Demirgüç-Kunt and R. Levine, “Bank Concentration and Crises”, NBER Working Paper No. 9921,2003.
M. D. Bordo and M. Flandreau, “ Core, Periphery, Exchange Rate Regimes, and Globalisation” , Globalisation in Historical Perspective, NBER Chapters, No. 9595, 2003.
M. D. Bordo and P. B. Rousseau, “Legal-Political Factors and The Historical Evolution of The Finance-Growth Link?”, European review of economic history, Vol.10, No.3, 2006, pp.421-444.
M. D. Bordo, “Exchange Rate Regime Choice in Historical Perspective”, IMF Working Paper No. 03/160, 2003.
A. Bubula and I. Otker-Robe, “The Evolution of Exchange Rate Regimes Since1990: Evidence from De Facto Policies”, IMF Working paper No.02/155, 2002.
C. Calderón and K. Schmidt Hebbel, "Choosing an Exchange Rate Regime," Working Papers Central Bank of Chile No.494, 2008.
G. A. Calvo and C. M. Reinhart, “When Capital Inflows Come to A Sudden Stop: Consequences and Policy Options”, MPRA Paper No.6982, 2000.
G. A. Calvo and C. M. Reinhart, “Fear of Floating”, Quartly Journal of Economics, Vol.117, No.2, 2002, pp.379-408.
G. A. Calvo and F. S. Mishkin, “The mirage of exchange rate regimes for emerging markets countries”, The Journal of Economic Perspectives, Vol.175, No.4, 2003, pp.99-118.
Carmignani. F, Colombo. E et Tirelli.P, 2008. “Exploring different views of exchange rate regime choice”, Journal of International Money and Finance, 27(7), 2008;
Céspedes.L F, Chang. R et Velasco.A, 2004. « Balance sheets and exchange rates », American Economic Review, 94 (4), 2004;
Chang.R et Velasco.A, 2000a. « Financial fragility and the exchange rate regime », Journal of Economic Theory, 92 (1), 2000;
Chang.R et Velasco.A, 2000b, “Exchange-rate policy for developing countries”, The American Economic Review, 90(2), pp.71-75,2000;