http://www.sciencepublishinggroup.com/j/ogce doi: 10.11648/j.ogce.20190702.12
ISSN: 2376-7669 (Print); ISSN: 2376-7677 (Online)
Fine Prediction for Mine Water Inflow on Basis of Visual
Modflow
Wang Guorui
1, 2, Wu Qiang
1, Yan Zizhong
2, Zhao Na
3, Duan Chengbao
4, Cheng Xia
2,
Wang Hui
21
Department of Geological Environment, College of Geoscience and Surveying Engineering, China University of Mining and Technology, Beijing, China
2
Ningxia Survey and Monitor Institute of Land and Resources, Ningxia Department of Natural Resources, Yinchuan, China 3
Department of Business Technology, Ningxia Branch of Agricultural Bank of China, Yinchuan, China 4Department of Geological Survey, Xinjiang Tianchi Energy Co. Ltd., Changji, China
Email Address
:
:
:
:
To cite this article:
Wang Guorui, Wu Qiang, Yan Zizhong, Zhao Na, Duan Chengbao, Cheng Xia, Wang Hui. Fine Prediction for Mine Water Inflow on Basis of Visual Modflow. International Journal of Oil, Gas and Coal Engineering. Vol. 7, No. 2, 2019, pp. 52-59. doi: 10.11648/j.ogce.20190702.12 Received: March 12, 2019; Accepted: April 23, 2019; Published: June 4, 2019
Abstract:
Mine water inflow refers to the influx of mine within the mine construction and production process of water per unit time. The amout of water inflow is not only an important indicator of the technical and economic evaluation of mine construction and rational development but also the main basis for coal mining production design department to develop programs to identify and develop the ability to mine dewatering and drainage measures, playing an important role in preventing the accidents of mine water inrush and flooding mine malignant as well as reducing the production costs and protecting mine safety. In this paper, the way coal mining in northeast in china for points, by means of sequence numerical simulation compared to traditional separated mining area in calculating water inflow, then matches the results to the existing mine water inflow, to validate the model accuracy, improve the accuracy of the numerical simulation, to provide security for mining coal mine safety.Keywords:
Coal Mine, Mine Water Inflow, Mining Sequence, Visual Modflow1. Introduction
Darcy discovered groundwater flow in porous aquifers is mostly considered to be laminar and thus named Darcy’s law, that is, by a linear relationship between specific discharge and hydraulic gradient [1]. Ahmed & Umar applied Visual Modflow to their attempt to simulate the behavior of a flow system and evaluate a water balance, and showed that the model was the most sensitive to hydraulic conductivity and recharge parameters [2]. Seyf-Laye et al. applied a three-dimensional groundwater flow model to evaluate groundwater potential and assess the effects of groundwater withdrawal on the regional water level and flow direction in the central Beijing area [3]. Rao et al. applied a three-dimensional steady state finite difference groundwater flow model to quantify the groundwater fluxes and analyze the subsurface hydrodynamics in a basaltic terrain by giving particular emphasis to a well field that supplies domestic,
agricultural and industrial needs [4].
International Journal of Oil, Gas and Coal Engineering 2019; 7(2): 52-59 53
dynamic characteristics of groundwater [8]. In this paper, the author set the Dong Baowei coal mine in the northeast of china as an example, the coal seam in this mining area has a large dip angle and the overlying sediments are mainly sand rocks. The production mode is up and down from the water-level of mining area. By means of sequence numerical simulation compared to traditional separated mining area in calculating water inflow, then matches the results to the existing mine water inflow, to validate the model accuracy and practicability, improving the accuracy of the numerical simulation, to provide security for coal mine safety.
2. Geological Model
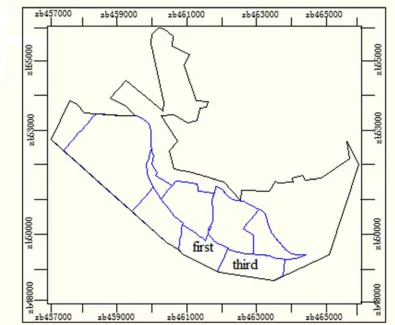
In this paper, a practical hydrogeological physical model is constructed based on Visual Modflow, and the simulation results of the two methods are compared with the actual situation so as to obtain the advancement, practicability and correctness of the numerical simulation of the mining area under the interference flow field according to the mining sequence. In order to highlight the practicability of the method, the study in Dong Baowei coal mine as an example, (mining area distribution as shown in figure 1), according to the actual circumstance of the geological condition, the stratum from top to bottom can be generalized as three layers model: quaternary pore aquifer, sand and mudstone relative water-resisting layer
and cretaceous weathering fracture aquifer, meanwhile the following several aspects taken to carry on the generalized regional groundwater flow system:
(1)The input and output of the groundwater flow system change with time, so the flow model is unsteady flow. (2)The hydrogeological parameters of the aquifer vary
with the lithology, and there are differences in the direction, so the water-bearing medium is generalized as a 3-layer anisotropic anisotropic structure.
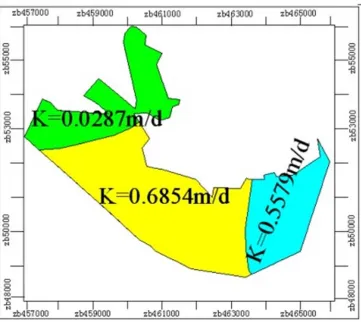
(3)The aquifer in this area is of great thickness and wide distribution, with small hydraulic gradient, and the groundwater movement conforms to darcy's law. In conclusion, the groundwater system in this area is generalized as a three layered heterogeneous anisotropic and three dimensional unstable groundwater flow system. At the same time, according to the data collected from the coal mine party for the assignment model, which can get Dong Baowei coal mine zoning maps including quaternary pore permeability coefficient (figure 2) partition and cretaceous weathering fissure permeability coefficient partition (figure 3),
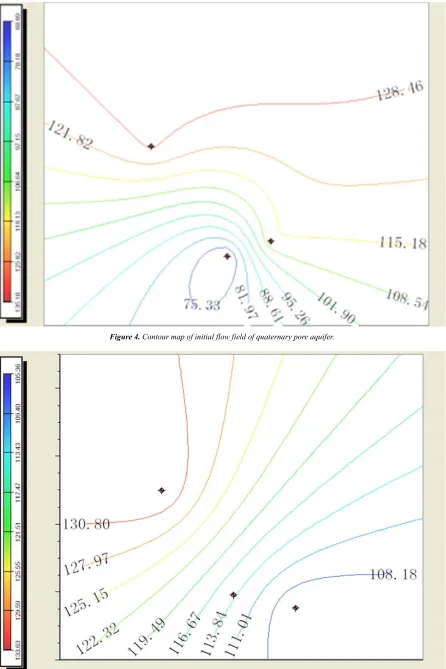
even the quaternary pore aquifer initial flow field contour map (figure 4) and the cretaceous weathering fissure aquifer initial flow field contour map (figure 5). The model is fitted according to the pumping test data, which provides a reliable model for accurately predicting the mine water inflow.
Figure 2. Partition map of permeability coefficient of quaternary pore aquifer.
International Journal of Oil, Gas and Coal Engineering 2019; 7(2): 52-59 55
Figure 4. Contour map of initial flow field of quaternary pore aquifer.
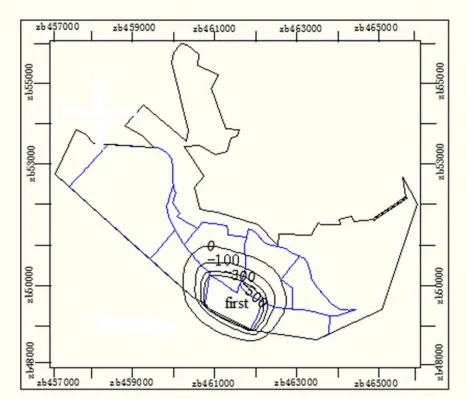
Figure 6. Flow field chart when water level in one mining area falls to -500 separately.
3. Mathematical Model
Without considering the density change of water, the movement characteristics of groundwater in the three-dimensional pore medium can be expressed by the following mathematical equation:
δ δ δ δ δ δ δ
δ δ δ δ δ δ δ
+ + − =
xx yy ZZ S
h h h h
K K K W S
x x y y z z t
Where the Kxx, Kyy and Kzz are the components of the permeability coefficient in the x, y and z directions respectively, and the unit is m/ s. H is the water head, and the unit is m; W is the flow rate per unit volume, used to represent the amount of water flowing into or from the source, and the unit is m 3 / s. Ss is the water storage rate of pore medium, and is a dimensionless parameter; T is time.
In general, it is not easy to obtain the analytic solution of the definite solution problem composed of the above equation, boundary condition and initial condition. In this paper, the solver provided by Modflow simulation software
is used to solve the above equation numerically in accordance with boundary conditions. The solver of Modflow simulation software adopts the finite difference method.
There are many kinds of solvers that can be used in simulation, such as PCG2, SIP, SOR and WHS among Visual Modflow solvers. Among them, strong implicit method is an iterative solution method for large simultaneous equations, which was first proposed by Weinstein et al. The difference equations based on each unknown computing unit can be written as:
[ ]
A H{ } { }
= qInternational Journal of Oil, Gas and Coal Engineering 2019; 7(2): 52-59 57
Figure 7. Flow field chart when water level in the third mining area falls to -500 separately.
4. Results and Analysis
At present, the first level of the mine has been excavated, and no other mining areas upper the three mining areas of the second level. The initial flow field is the natural flow field, and the mining sequence is from the first mining area to the third then the fourth, the first and third mining areas have also been excavated, but the two mining areas maintain a stable water inflow.
4.1. Prediction of Water Inflow in Separated Mining Areas
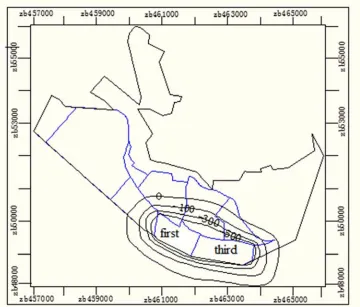
The so-called calculation of water inflow in separated mining areas only considers the initial flow field (figure 5) and terminates the stable flow field when predicting the water inflow. Through simulation, when the first mining area and third mining areas is drained to -500 respectively, the distribution diagram of water flow field in the corresponding mining area at the moment (figure 6, figure 7) can be obtained. Through the Zone Budget of water balance calculation module, the water inflow in first mining area can be obtained as: Q1=176 m3/h; Water inflow in third mining area: Q2=142
m3/h.
4.2. Prediction of Water Inflow According to Mining Sequence
The so-called drainage in accordance with the mining sequence is to conduct drainage successively according to the actual mining sequence. The initial flow field of the drainage in the first mining area is the natural flow field, but the initial flow field of the drainage in the third mining area is the disturbed flow field after mining in the first mining area.
Through simulation, when the first mining area is drained to -500 respectively, the distribution diagram of water flow field
in the first mining area at the moment (figure 6) can be obtained, Through the Zone Budget of water balance calculation module, the water inflow in first mining area can be obtained as: Q1=176 m3/h; when the first and third mining
area together pumped from natural water drain down to - 500, get the tourism mining joint distribution of flow field (figure 8), through the calculation of water balance module Zone Budget get the together total mining water inflow: Q4= 289
m3/h, The total water inflow of the first and third mining area minus the water inflow of the first mining area is the water inflow in the third mining area under the state of post-mining interference flow field, that is, Q5= Q4-Q3 =113 m3/h.
4.3. Prediction of Water Inflow According to the "Big Well Method"
The "big well method" is used to calculate the water inflow in the first and third mining areas respectively, and the water inflow in the first mining area is Q6=269 m3/h, The water
inflow in the third mining area is Q7=171 m3/h.
4.4. Result Analysis
generally not more than mining area in the process of coal mining at the same time, will be in accordance with the mining plan arrangement, successively for mining, Comparison between two kinds of simulation results, the "big well method" and the actual water inflow shows (table 1), all the results larger than the actual water inflow, but can be seen from the data, simulate and predict water inflow in mining order than other method is more accurate and close to the actual production conditions, has a strong advancement, practicability and accuracy.
Table 1. Statistical table of water inflow in mining area.
mining area separated mining area Q predicted in order Q big well method Q actual water inflow Q
first mining area 176 m3/h 176 m3/h 269 m3/h 142 m3/h
third mining area 142 m3/h 113 m3/h 171 m3/h 90.5 m3/h
5. Conclusions
1. The numerical simulation method is a computer simulation method for solving the complex water inflow condition in the mine water inflow prediction. Compared with the hydrogeological comparison method, the water quantity equalization method and the analytical method, the mine water inflow predicted by this method is more realistic.
2. Compared with the "big well method" and the separated mining area numerical simulation method, the numerical simulation of water inflow predicted by mining sequence method not only conforms to the mine production law, but also can simulate the groundwater flow field changes in the adjacent mining area and the obtained simulation results are advanced, practical and accurate.
3. The application scope of numerical method in coal mine should be broadened. This method can not only predict water inflow, but also simulate and depict the change of groundwater flow field when water inflow occurs somewhere in mine. It can provide guidance for emergency plan of water inrush.
Acknowledgements
International Journal of Oil, Gas and Coal Engineering 2019; 7(2): 52-59 59
References
[1] Darcy, H. (1856). Les fontaines publiques de la ville de Dijon. Paris France: Victor Dalmo.
[2] Ahmed, I. & Umar, R. (2009). Groundwater flow modelling of Yamuna-Krishni interstream, a part of central Ganga Plain. [3] Seyf-Laye, A-S. M., Mingzhu, L., Djanéyé-Bouindjou, G., Fei,
L., Lyutsiya, K., Moctar, B. L. & Honghan, C. (2012). Groundwater flow and contaminant transport modeling applications in urban area: scopes and limitations. Environmental Science and Pollution Research 19, 1981–1993. [4] Rao, G. T., Rao, V. G., Surinaidu, L., Mahesh, J. & Padalu, G. (2013). Application of numerical modeling for groundwater flow and contaminant transport analysis in the basaltic terrain, Bagalkot, India. Arabian Journal of Geosciences 6, 1819–1833. [5] Xue Yuqun, Zhu Xueyu, Wu Jichun, et al. Groundwater Dynamics [M]. Beijing; Geological Publishing House, 1997. [6] Wu Qiang, Zhu Bin, Xuhua et al. (2005). Application of
MODFLOW in numerical simulation of groundwater in Huaibei [A]. Journal of Liaoning University of Engineering and Technology.
[7] Yang Biao, Luo Zhouquan, Wang Yiwei. (2013). Analysis and prediction of mine groundwater flow field based on Visual Modflow [A]. Mining safety and environmental protection.
[8] Liu Ji, Wang Qiangmin, Yang Jian. (2018). Study on Simulation and dynamic prediction of mine water inflow based on Visual Modflow [J]. Coal Mine Safety, 190-193.
[9] Circumference. (2014). Simulation and evaluation of groundwater resources in mining area by coal mining based on Visual Modflow [D]. Shanxi University.
[10] Yang Shuqing. (2005). Prediction of water-soil environmental effects of brackish water irrigation in arid areas based on Visual-MODFLOW and SWAP coupled model [D]. Inner Mongolia Agricultural University.
[11] Guo Xiaodong, Tianhui, Zhang Meigui et al. (2010). Progress in the application of groundwater numerical simulation software in China [J]. Groundwater.
[12] Wuqiang, Zhao Suqi, Sun Wenjie et al. (2013). Classification and characteristics analysis of hydrogeological types of coal mines in China [J]. Journal of Coal Mines.
[13] Shao Taisheng, Shao Aijun, Peng Jianping. (2009). Floor water inrush numerical simulation and water inrush volume prediction of Fengfeng No.5 Mine [J]. Hydrogeology and engineering geology.