Published online November 11, 2014 (http://www.sciencepublishinggroup.com/j/ijrse) doi: 10.11648/j.ijrse.s.2015040301.12
Performance enhancement of PV array based on water
spraying technique
Salih Mohammed Salih, Osama Ibrahim Abd, Kaleid Waleed Abid
Renewable Energy Research Center, University of Anbar, Ramadi, Iraq
Email address:
[email protected] (S. M. Salih), [email protected] (O. I. Abd), [email protected] (K. W. Abid)
To cite this article:
Salih Mohammed Salih, Osama Ibrahim Abd, Kaleid Waleed Abid. Performance Enhancement of PV Array Based on Water Spraying Technique. International Journal of Sustainable and Green Energy. Special Issue: Engineering Solution for High Performance of Solar Energy System. Vol. 4, No. 3-1, 2015, pp. 8-13. doi: 10.11648/j.ijrse.s.2015040301.12
Abstract:
This paper experimentally presents water spraying technique to improve photovoltaic (PV) array efficiency and enhance the net power saving. A forced-water spraying and cooling technique with constant flow rate of water on PV array surface is designed and implemented. The decreasing rate in the panel surface temperature has a direct proportional relation with PV efficiency. Simultaneously, the output hot water is very beneficial for houses, buildings etc., as water heating system, specifically in the remote areas. The electrical performance of PV array was also studied. The cooling rate of panel surface for 5 min.= 4 in midday. The electrical performance of PV array also was studied. As a final point, the economical results were achieved as result of the power saving increases 7w/degree at midday.Keywords:
PV Cooling, Temperature Effect, Water Spraying, RERC, Cooling Rate1. Introduction
Performance of a solar-photovoltaic (PV) system not only depends on its basic electrical characteristics; maximum power, tolerance rated value %, maximum power voltage, maximum power current, open-circuit voltage (Voc), short-circuit current (Isc), maximum system voltage, but also is negatively influenced by several obstacles such as ambient temperature, relative humidity, dust storms and suspension in air, shading, global solar radiation intensity, spectrum and angle of irradiance [1, 2].
The operating temperature plays an essential role in the PV energy conversion process. The electrical performance of a PV module which involves both the electrical efficiency and the power output depends linearly on the operating temperature [3-5]. Temperature affects how electricity flows through an electrical circuit by changing the speed at which the electrons travel. This is due to an increase in resistance of the circuit that results from an increase in temperature. Likewise, resistance is decreased with decreasing temperatures, i.e., the efficiency of photovoltaic cells decreases as temperature increases. All previous investigations agreed that the performance of PV panels reduces with increasing temperatures [6-10]. Therefore, most panels do not operating under ideal conditions due to different weather conditions or real ones. Since PV panels are more efficient at lower temperatures, PV systems have to
design with active and passive cooling. Cooling the PV panels allows them to function at a higher efficiency and produce more power. Panels can be cooled actively or passively. An active system requires some external power source to run. Many researchers have investigated and proposed different techniques of active cooling, consisting of forced air or water-cooling, to increase total energy output of the PV modules [10].
In this study, to improve the electrical efficiency of solar panels that operate in non-optimal conditions, an active water cooling system has been built on top of PV array to spray (pump) a cool water on front of the panel surface, to pull away heat, keep the panel cool and keep the panel within certain temperatures, i.e., within ambient temperature range.
2. Experimental Methodology
In this experimental study a PV-array cooled by a thin continues film of water flowing on the front of the panels has been considered. Cooling technique was utilized by flowing and spraying a film of water on the PV-array front. Due to the rapid flow of the water there should be only a slight increase in water temperature.
decrease the panel surface temperature, so result in increased power output, therefore, gaining better electrical efficiency due to decreasing the reflection loss (refractive index of water is 1.3, which is intermediate between glass, with 1.5, and air, with 1.0) [10,11].
2.1. System Configuration
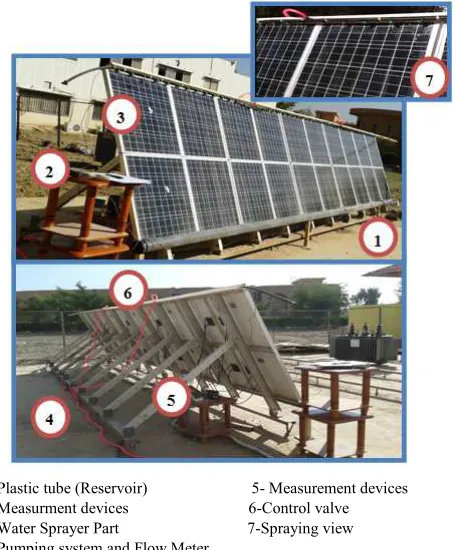
Figure (1) shows the cooling of PV system which built in this study, at the Renewable Energy Research Center (RERC) /University of Anbar Campus. PV system consists of five units, connected in parallel with a capacity of each unit is 216 watt), therefore, the total capacity of the PV array is 1.080kw. It is fixed at 33.33° south facing. The DC power produced from the PV array is sent to the control system which consists of five convertors of NAPS NS77 type, ten batteries of 105Ah for each one, and one inverter of AJ sinewave type.
2.2. Measurements
1-Plastic tube (Reservoir) 5- Measurement devices 2-Measurment devices 6-Control valve 3-Water Sprayer Part 7-Spraying view 4-Pumping system and Flow Meter
Figure 1. Cooling of PV system which built in this study
Table 1. Technical Specifications of PV modules
Values Parameter
17.4 Vmax (Volt)
3.11 Imax (Ampere)
21.7 Voc (Volt)
3.31 Isc (Ampere)
54 Pout (Watt)/ panel
54*4 = 216 Rated capacity of each PV array (Watt)(parallel)
216*5=1080 Total installed capacity (Watt)
1.5 m * 7.4 m *1.6m Dimensions of PV array
11.1 m2 Area required for the installation of five PV unit
Kyocera 54 W PV model
The measurements were recorded during a clear day at the RERC in Ramadi city on the 15th of April 2014 and 1st of July
2014. The power of the pump for spraying and circulation of water is 0.25 hp. For practical design, the power of water pump should be less than the obtained gain of power from PV due to using the spraying technique. The flow rate of water is measured by an ULTRASONIC FLOMETER-TDS-100H flow meter. The Solar irradiance was measured by a Pyranometer at the same incident plane of the modules. Wind speed was recorded by weather station at RERC which was less than 1m/sec. Ambient temperature was measured in the shade space. Two temperature sensors (Thermocouple Type K) were installed on the front of the module surface (upper and lower surface) and average surface temperature was calculated. The temperatures of water inlet and water outlet, were also measured to calculate the temperature difference (∆Tw=heating rate). Current and voltage were measured by NAPS type millimeter with accuracy of 1 mA and 1 mV respectively. The water collected at the bottom of the panel passes through plastic tube used as a heat exchanger with environment and produces a constant low water temperature. Therefore when the water is return back to the feeding tube it would be at a desired temperature level to flow on the panel surface. Pumping system and the heat exchanger which are used in the combined system are shown in Fig. 1. Humidity was measured during the testing time and it was between 20% to 30%. The power output from each of the PV array was recorded every 25 min, and after that the spraying system is done for 5 minutes with recording the output power. More than one reading is taken at the same time in order to get smoothing curves, and this is due to difficulties in getting such smooth curves due to fluctuation in solar irradiance at the experimental site. The testing was done at clear day in order to get a maximum sun radiation with highest temperature on the PV surfaces.
3. Results and Discussion
3.1. Measurements on 15th of April 2014
∆p/∆t=(18858-16283)/(947.1-584.3)= 7.097W/oC (for 20 PV panel)
The values 947.1 and 584.3 present the sum of 20 reading of temperature without and with spraying respectively. The effect of increasing the temperature on each model is:
7.097/20 panel=0.354 W/ oC.
The reduction of electrical power output within the range of 0.4W/oC–0.5W/oC for mono and multicrystalline silicon solar cells, respectively (which are used in most power applications) [11]. Note that the above value (i.e. 0.354W/oC) is less than the range loss due to increasing the surface temperature of PV system, also it is calculated at non STC for 1000w/m2.
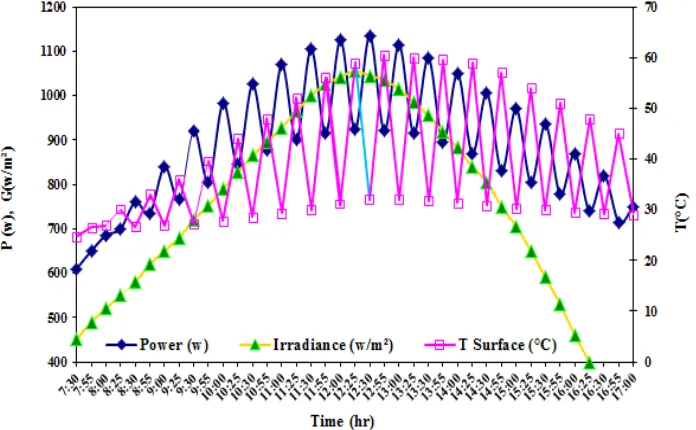
The power with and without spraying is summarized in fig. (3). The average power with water spraying technique is 943W from 7:30am to 5:00pm in corresponding to 818W without spraying. Additional power can be obtained if the temperature of PV surface is kept below 32 oC (the PV surface
temperature at the midday in fig. (2)) even it is difficult due to the increasing in ambient temperature up to 36 oC at the midday. This difference comes from the fact that in fig. (2) there are many temperature points on the curve have values above the standard test condition (25 oC) after spraying the PV system by water, so the obtained power will also be affected by such increment of PV surface temperature. The efficiency and electrical power decrease with increases the operating temperature.
The output power increases as the solar irradiance (G) increases. From the same figure the output power with and without spraying will approach each other at the start and end of day which is considered as a normal case due to less increasing in surface temperature of PV system and the decreasing of ambient temperature at that time.
Figure 2. System output power, Irradiance, and models surface temperature versus time (15th of April 2014).
3.2. Measurements on 1st of July 2014
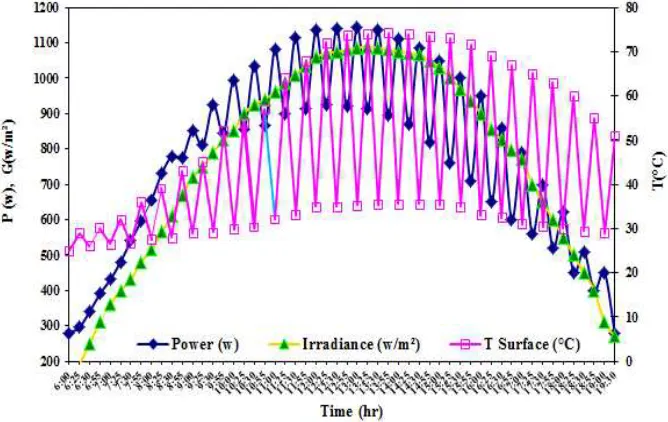
Figure (4) illustrates the PV system performance with and without spraying in 01/July/2014. Since the day time is around 14 hour in July, the graph axis is started from 6:00am to 7:00pm. The ambient temperature at this month is high as shown in fig. (5). The output power increases gradually up to 9:00am. The effect of temperature at this period is not clear due to increasing in solar insulation values which substitute the negative effect of temperature on the generated power. The fluctuation of output power increases by time till the midday. The solar insolation has maximum values in the period (12:30-14:00)pm, which are around 1080w/m2. Since the ambient temperature is around 47 oC (from 1:10pm to 4:30pm) this will cause the output power to be reduced even the solar irradiance is high at this period. The PV surface temperature is about 35 oC in the period (12:30 to 4:30)pm with water spraying model. The maximum reduction of temperature is about 38.7oC (74.2 oC at 1:55pm -35.5 oC at
2:00pm=38.7 oC). The average power for the whole day is 800W with spraying technique and 735W without spraying. The obtained average power in April is higher than the corresponding value in July due to high ambient temperature values in July which have direct effect on the out power. The PV surface temperature is staying over 50 oC at 7:00pm, where the ambient temperature is 40 oC at the same time. The variation of power per time is:
∆p/∆t=(21585-19848)/(1560.1-840.2)= 2.1414W/oC (for 20
PV panel)
The values 21585 and 19848 present the sum of 28 reading of power with and without spraying technique. The other values in brackets are for the temperature on same period. The effect of increasing the temperature on each model is:
2.1414/20 panel=0.107 W/ oC
Figure 4. System output power, Irradiance, and models surface temperature versus time (1st of July, 2014).
Figure (5) presents the ambient temperature at the middle of April-2014 and the first day of July-2014.The measurement is based on thermal sensor for Soly2 sun tracker system which already works at the same site of this practical project. Also the measurement is automatically registered by data logger device for each two minutes. From this figure, the ambient temperature increases with time from 6:00am to 1:00pm. The maximum temperatures are 36 oC and 47 oC at 2:00pm in these two days. The temperature reduces slowly after the midday which verifies the question of why the surface temperature reduces slowly in fig. (2) and fig. (4) after the midday.
Using spraying of water on the front of panel as a coolant cools it cause the PV to generate more power than the system without water spraying. Approximately, the cooling rate for 5 min.= 4 ºC/min in midday, as could be shown in Table 2. and Fig. 6. A water coolant system for solar panels may help the solar panels to cool and increase energy output during clear, sunny days.
6 8 10 12 14 16 18
15 20 25 30 35 40 45 50
Time (hr)
T
e
m
p
e
ra
tu
re
(
oC
)
01/July/2014
15/April/2014
Table 2. Cooling rate of Panel surface along one day in October 2014.
Time (hr) dT/time (5 min.) =Cooling rate (ºC/min.)
9:55-10:00 1.87 10:25-10:30 2.71 10:55-11:00 3.59 11:25-11:30 3.61 11:55-12:00 2.71 12:25-12:30 4.93 12:55-13:00 4.76
0 1 2 3 4 5 6 9:55 -10: 00 10:2 5-10 :30 10:5 5-11 :00 11:2 5-11 :30 11:5 5-12 :00 12:2 5-12 :30 12:5 5-13 :00
Time (hr)
C o o li n g r a te ( °C /m in .)
Figure 6. Cooling rate of Panel surface along one day in April 2014.
There is another application of spraying system which is water heating, so spraying system considered as hybrid system. Temperature difference of water along one day or heating rate ∆TW is shown in Fig. 7. Higher heating rate
acquired at mid day was 9.8°C, and the average of heating rate of water along one day was 6.83°C.
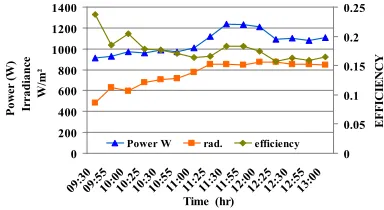
The efficiency is determined by dividing the product of voltage and battery current by average global solar radiation as shown in Figs. 7 and 8. The top values of efficiency were observed in midday. The average value of efficiency of spraying system along one day was 17.8 %.
0 5 10 15 20 25 30 35 40
10:00 10:30 11:00 11:30 12:00 12:30 13:00 Time (hr)
T
(°
C
)
dt T outlet T inlet Tamb.
Figure 7. Temperature difference of water along one day in April 2014 (Heating rate ∆TW).
E F F IC IE N C Y 0 200 400 600 800 1000 1200 1400 09:3 0 09:5 5 10:0 0 10:2 5 10:3 0 10:5 5 11:0 0 11:2 5 11:3 0 11:5 5 12:0 0 12:2 5 12:3 0 12:5 5 13:0 0
Time (hr)
P o w er ( W ) Ir ra d ia n ce W /m ² 0 0.05 0.1 0.15 0.2 0.25
Power W rad. efficiency
Figure 8. The relationship between power, radiation and efficiency versus time along one day in April 2014.
4. Conclusions
Increasing the efficiency and the power output depends largely on reducing the PV surface temperature, which allows the greatest benefit from the whole system. Experimental results show that the PV cells power has increased due to spraying of water over the PV front surface. The cooling rate for 5 min.= 4 ºC/min in midday. This can significantly increase the system efficiency. The average value of efficiency for spraying system along one day was 17.8 %. Besides, the reduction in installation area for solar panels was acquired as result of power saving.
Acknowledgements
This work is supported by the University of Anbar-Iraq /Renewable Energy Research Center with Grant No. RERC-PP23.
References
[1] Shafiqur Rehman and Ibrahim El-Amin, “Performance evaluation of an off-grid photovoltaic system in Saudi Arabia”,
Energy 46, pp. 451-458, 2012.
[2] K.E. Park , G.H. Kang, H.I. Kim, G.J. Yu and J.T. Kim, “Analysis of thermal and electrical performance of semi-transparent photovoltaic (PV) module”, Energy, pp. 2681–2687, 2012.
[3] Omubo-Pepple V B, Israel-Cookey C and Alaminokuma G I, “Effects of Temperature, Solar flux and Relative Humidity on the Efficient Conversion of Solar Energy to Electricity”,
European Journal of Scientific Research, vol.35 (2), pp. 173-180, 2009.
[4] Kawamura T, Harada K, Ishihara Y, Todaka T, Oshiro T, Nakamura H, and Imataki M, stics in Photovoltaic power system”, Solar Energy Materials and Solar Cells, vol.47, pp. 155-165, 1997.
[5] E. Skoplaki and J.A. Palyvos, “On the temperature dependence of photovoltaic module electrical performance: A review of efficiency/power correlations”, Solar Energy 83, pp. 614–624, 2009.
[6] Ben Richard Hughes, Ng Ping SzeCherisa, and Osman Beg, “Computational Study of Improving the Efficiency of Photovoltaic Panels in the UAE”, World Academy of Science,
[7] Sandstorm JD., “A method for predicting solar cell current-voltage curve characteristics as a function of incident solar intensity and cell temperature”, National Aeronautics and Space Administration, series technical report; pp. 32-1142, 1967.
[8] Osterwald CR, Glatfelter T and Burdick J., “Comparison of the temperature coefficients of the basic I-V parameters for various types of solar cells” In: Proceedings of the 19th IEEE photovoltaic specialists conference; pp. 188-193, 2008.
[9] Makrides G, Zinsser B, Georghiou GE, Schubert M. and Werner JH. “Outdoor effi-ciency of different photovoltaic systems
installed in Cyprus and Germany”, the 33th IEEE photovoltaic specialists conference;11-16 May 2008, pp. 1-6, 2008.
[10] L. Dorobanțu, M. O. Popescu, C. L. Popescu, and A. Crăciunescu, “Experimental Assessment of PV Panels Front Water Cooling Strategy”, International Conference on Renewable Energies and Power Quality (ICREPQ’13) Bilbao (Spain), 20th to 22th March, 2013.