Deterioration Estimation of Reinforced Concrete Building Structures
Using Material Testing Data Base
Wei-Ting Lin
1,*, Tsai-Lung Weng
2,3, En-Tzu Chang
41Department of Civil Engineering, National Ilan University, Ilan, Taiwan, ROC 2Physics Division, Tatung University, Taipei, Taiwan, ROC
3Institute of Engineering Management, College of Engineering, Tatung University, Taipei, Taiwan, ROC 4
Department of Harbor and River Engineering, National Taiwan Ocean University, Keelung, Taiwan, ROC
Received 22 March 2018; received in revised form 15 April 2018; accepted 05 August 2018
Abstract
This study aims to investigate the material factors that affect the degree of deterioration of reinforced concrete structures and develop an integrating evaluation model. Also, the durability indices were generated using the analytic hierarchy process for the overall durability assessment of structures, which corresponded to the durability grades referred as the maintenance, reinforcement, or demolishment. The status of concrete includes compressive strength, resistance coefficient, concrete cracks, honeycomb and spalling. And the reinforcement status includes corrosion potential, corrosion current, chloride ion content, neutralization depth and protective layer thickness. Durability indicators were determined through the findings on the structural inspection process of reinforced concrete structures and the evaluation methods related to materials testing and industry standards. Case studies were also presented to illustrate the methodology of the assessment system. The durability methodology can be summarized as the comprehensive evaluation methods considering the earthquake potential factors, structural factors, environmental factors, and material deterioration factors.
Keywords: durability, analytic hierarchy process, material deterioration
1.
Introduction
Reinforced concrete is one of the most widely applied materials in construction [1], whether it is housing, bridges, or docks. Proper design and usage can prolong the service life of reinforced concrete structures. However, a number of factors cause concrete degradation, including the materials used during construction, construction quality, and the external environment. Structures with degrading concrete gradually lose strength, safety and become unable to achieve their proper functions. Instead, their lifetime is shortened, to make time for repairs, which also increase costs.
The durability of reinforced concrete involved the relationship between the reinforced concrete material itself and the environment, and has received widespread attention in recent years. Relevant data indicate concrete durability problems have incurred substantial economic losses [2-5], and changes in the environment have made durability even more crucial. With the large number of old structures in Taiwan; it is necessary to conduct a comprehensive and safety-oriented structure evaluation investigation to prevent disasters and the increase of repair costs as well as maintain the exterior, properties, and usability of concrete in exposed environments.
*Corresponding author. E-mail address: [email protected]
The causes of durability damage may be internal or external. The former includes the defects of the concrete itself, which are produced from material properties, construction, and the design of the concrete structure [6]. For instance, air pockets or pores that exist within concrete provide carbon dioxide, water, and oxygen in the air with channels to diffuse throughout the concrete. Another example is chloride in the concrete or aggregates; chloride ion reactions corrode rebar, and if the concrete has too much alkali content, alkali-aggregate reactions will lead to cracking.
Due to the environmental influences, changes in pore structures of materials, and material properties that change as time goes by, there is no material whose durability will remain the same. In construction, the service life of a structure is the focus, and it is generally estimated using the durability of the materials. Just as crucial as mechanical properties and building costs, the assessment of structure durability can be divided into three aspects [7]. In terms of economic benefits, the investment costs of an entire building during its life cycle includes the construction costs and the later costs of repairs and reinforcement. If durability is taken into account during the design stage, it will lower the repair and reinforcement costs. In terms of environmental protection, enhancing the material durability prevents wasting the natural resources and reduces the pollution produced during manufacturing. Finally, concrete has been applied to a wide range of structures in recent years, such as oil or gas storage tanks and nuclear power plants. Many of these structures face more exceptional environmental conditions such as high or low temperatures and high pressure, which make durability even more important.
The objective of this study was to compile, to organize, and to integrate existing evaluation indices for the material factors in concrete structures, examine their relationships with durability. Also, develop a material testing database and evaluation model to determine the current conditions of structures and provide reference for maintenance.
This study focused on the durability of material factors, which was divided into two major indicators: concrete conditions and rebar corrosion conditions. During the process, it developed an evaluation model and graded the durability indices using the analytic hierarchy process (AHP) for the overall durability assessment of structures [8-10]. Prior to structure assessment, it compiled durability-related data from structures in Taiwan and applied our evaluation standards in Taiwan by Construction and Planning Agency Ministry of the Interior [11]. Finally,it conducted a case study to perfect our durability evaluation model. Of course, the materials are not the only factors that influence durability; other researchers may design and add their own durability indices during evaluation. This study focused on the relevant tests that are often performed during durability assessments (which are mostly material-related), which is in accordance with the standard of ACI 437 [12]. Other factors were included using the amplification coefficient to correct the evaluation model (such as earthquake potential, structure age, environmental impact, and structure use).
2.
Evaluation Model
2.1. Model explanation
The weights of concrete durability indices can be obtained via expert assessment, the methods of which include AHP, the Delphi method, and network analysis. All durability assessments of concrete structures [13] must follow the steps below:
(1) Define the target and durability indices of the research project; this index is the output target. (2) Define the items needed for the evaluation; these items must be the influence factors.
(3) Establish the means of quantifying the influence factors; in the event of unquantified data, use mathematical methods to quantify the data.
(4) Establish the corresponding output target functions of the influence factors; create weight matrices for linear functions and develop relevant coefficients for nonlinear functions depending on function definitions.
The mathematical models for the steps above have already been standardized. However, differences are likely to appear in Steps (1), (2), (4), and (5) because they depend on how the modeler defines the system, which means human factors such as experience and the way the questionnaire was designed will influence the evaluation results. Eliminating these human factors is thus crucial to the success of the evaluation method, so choosing a good way to eliminate human factors is extremely important.
2.2. Analytic hierarchy prcess (AHP)
The most commonly used methods of expert evaluation are AHP and network analysis. The difference between these two approaches is that AHP assumes independence and no mutual influence among factors in each layer. Furthermore, the transfer between layers only goes one way, and there is no feedback. In contrast, network analysis allows feedback and the factors in the control layer to influence one another. Theoretically speaking, AHP is a special case of network analysis, which means that network analysis has a wider range of applications [14]. However, in terms of mathematical operations and questionnaire design, network analysis is much more difficult than AHP.
A decision-making method developed by American scholar Saaty, AHP mainly solves problems with uncertainty but multiple evaluation criteria [14]. Basically, it decomposes problems systematically, establishes a hierarchy, and compares elements two at a time. With AHP, it can grade durability indices and give them corresponding weights.
Hierarchical structures help decision makers understand matters; to choose a suitable alternative, they must assess each alternative based on certain standards and then rank the alternatives. There are technical, technological, social, economic, and political aspects in assessment standards, and making a decision based on only a single aspect easily lead to a bad decision [14]. AHP was developed in such a context, providing solutions to complex problems in fields such as economy, resource planning, and management science. After expert evaluation and mathematical processing, the factors of problems with multiple and complex elements can be ranked using a simple hierarchical structure [15] that is more easier to be understood and accepted by decision makers.
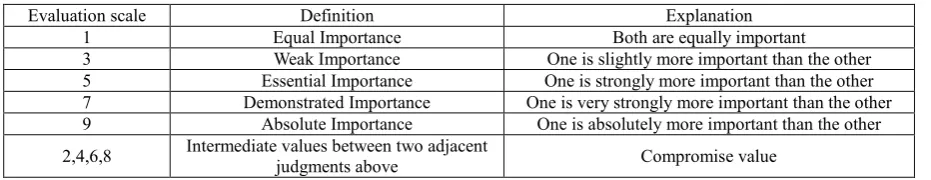
Miller [16] indicated that humans have difficulty comparing more than seven items at a time. Therefore, there should be no more than seven elements in each layer. Once the hierarchy has been established, pairwise comparisons of the elements in each layer must be performed using the criterion or target of the layer above the mentioned layer as the assessment standard. Satty and Vargas [17] suggested a nine-point evaluation scale for the comparison process, the details of which are presented in Table 1 [18].
Table 1 Definitions of evaluation scale
Evaluation scale Definition Explanation
1 Equal Importance Both are equally important 3 Weak Importance One is slightly more important than the other 5 Essential Importance One is strongly more important than the other 7 Demonstrated Importance One is very strongly more important than the other 9 Absolute Importance One is absolutely more important than the other 2,4,6,8 Intermediate values between two adjacent judgments above Compromise value
Conducting AHP also requires consistency, which is determined using the consistency index (C.I.) or the consistency ratio (C.R.). When either the C.I. or the C.R. equal to 0, then the results are completely consistent. However, this is rare because expert opinions often vary. Thus, Satty indicated that a C.R. equal to or less than 0.1 is acceptable.
2.3. Questionnaire design
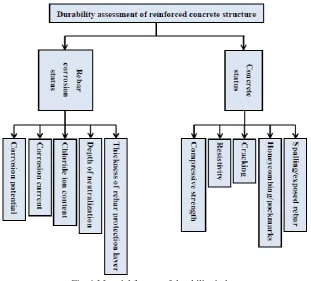
clearly associated with the environment of exposure; yet they are assumed to be independent of each other, which means that these two categories are not associated with each other. Chang et al [19] presented a different opinion; they maintain that material factors are the primary considerations and that other influences such as environmental factors can be regarded as having amplified or reduced influence on the material factors. This means that the same indices for structure durability, such as chloride ion concentration or compressive strength of concrete, may have different results in different regions or environments, as shown in Fig. 1.
Fig. 1 Material factors of durability index
Previous studies [13,19] indicated that durability assessment should be divide the indices into two categories: concrete status indices and rebar corrosion status indices: concrete status indices and rebar corrosion status indices. In the latter, Chang et al [19] did not consider the corrosion current as an index but instead using the corrosion potential. Theoretically speaking, the corrosion potential can provide the thermodynamic trends of rebar corrosion, but cannot be used the quantify the extent of corrosion.
Basically, it applied the same logic in this study and thus established an evaluation model for local applications. It is worth noting that the importance of various parts of a building is associated with its design method and environment, so different weights can be set by experts depending on the structure. Aside from evaluation methods using weights given by experts, quantitative calculations can also be used to achieve the evaluation target. In quantitative calculations, relationships are based on empirical formulas obtained in experiments or formulas obtained using simple derivation. This method exhibits the influence of a single factor on the durability of a single structural component or even its influence on service functions before assessing the service life of a structure. Fig. 1 displays the material factor categories established in this study.
Table 2 AHP questionnaire for material factors Evaluation
criteria
The left is more important than the right The right is more important than the left
Evaluation criteria
I II III IV V IV III II I
9:1 8:1 7:1 6:1 5:1 4:1 3:1 2:1 1:1 1:2 1:3 1:4 1:5 1:6 1:7 1:8 1:9 Rebar
corrosion status
Concrete status Note: I is Absolute importance; II is Demonstrated importance; III is Essential importance; IV is Weak importance and V is
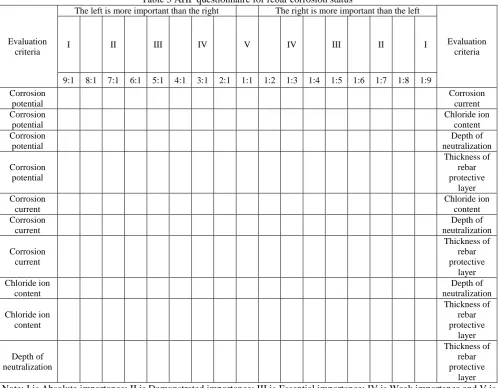
Table 3 AHP questionnaire for rebar corrosion status
Evaluation criteria
The left is more important than the right The right is more important than the left
Evaluation criteria
I II III IV V IV III II I
9:1 8:1 7:1 6:1 5:1 4:1 3:1 2:1 1:1 1:2 1:3 1:4 1:5 1:6 1:7 1:8 1:9 Corrosion potential Corrosion current Corrosion potential Chloride ion content Corrosion potential Depth of neutralization Corrosion potential Thickness of rebar protective layer Corrosion current Chloride ion content Corrosion current Depth of neutralization Corrosion current Thickness of rebar protective layer Chloride ion content Depth of neutralization Chloride ion content Thickness of rebar protective layer Depth of neutralization Thickness of rebar protective layer
Note: I is Absolute importance; II is Demonstrated importance; III is Essential importance; IV is Weak importance and V is Equal importance
Table 4 AHP questionnaire for concrete status
Evaluation criteria
The left is more important than the right The right is more important than the left
Evaluation criteria
I II III IV V IV III II I
9:1 8:1 7:1 6:1 5:1 4:1 3:1 2:1 1:1 1:2 1:3 1:4 1:5 1:6 1:7 1:8 1:9
Compressive
strength Resistivity
Compressive
strength Cracking
Compressive strength
Honeycombing/ pockmarks
Compressive
strength pockmarks
Resistivity Spalling/exposed
rebar
Resistivity Cracking
Resistivity Honeycombing/ pockmarks
Cracking pockmarks
Cracking Spalling/exposed rebar
Honeycombing/ pockmarks
Honeycombing/ pockmarks Note: I is Absolute importance; II is Demonstrated importance; III is Essential importance; IV is Weak importance and V is
First, it divided the material factors of structure degradation into two categories for the first layer, namely rebar corrosion status and concrete status. Table 2 shows the questionnaire design used to determine mutual weights. Rebar corrosion status includes corrosion potential, corrosion current, chloride ion content, depth of neutralization, and thickness of rebar protective layer, the questionnaire design for which is presented in Table 3. Concrete status comprises compressive strength, resistivity, cracking, honeycombing/pockmarks, and spalling/exposed rebar, the questionnaire design for which is presented in Table 4. The objective of this study was to validate the AHP in measuring materials deterioration for existed building conditional evaluation in paper surveys and to explore to what extent AHP can be used to predict the impact of offering different measurement technologies on materials deteriorations. And the results could be summarized as the basis of the comprehensive evaluation method for durability.
3.
Questionnaire Results
3.1. Results of AHPexpert questionnaire
This study distributed 18 respondents and recovered 17 respondents, thereby presenting a recovery rate of 94.4%. Each respondent’s professional advisory was elicited by interviewing him/her one by one and all respondents are professional civil engineers or professional structural engineers which had more than 15-year working experiences. To determine whether the respondent’s results fulfilled the pros and cons relationships of the evaluation factors, it input the results into decision support software Power Choice V2.0 to calculate the C.R. of each questionnaire, gauge overall consistency, and determine the relative weights of each factor.
AHP developer Thomas L. Saaty indicated that C.R.≤0.1 ensures consistency. The weight values and C.R. values were calculated using Power Choice V2.0.
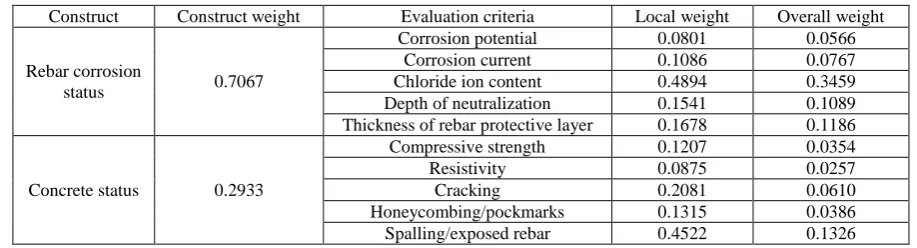
Table 5 AHP results
Construct Construct weight Evaluation criteria Local weight Overall weight
Rebar corrosion
status 0.7067
Corrosion potential 0.0801 0.0566 Corrosion current 0.1086 0.0767 Chloride ion content 0.4894 0.3459 Depth of neutralization 0.1541 0.1089 Thickness of rebar protective layer 0.1678 0.1186
Concrete status 0.2933
Compressive strength 0.1207 0.0354 Resistivity 0.0875 0.0257
Cracking 0.2081 0.0610
Honeycombing/pockmarks 0.1315 0.0386 Spalling/exposed rebar 0.4522 0.1326
The results in Table 5 show that for rebar corrosion status, the weight values of corrosion current, corrosion potential, chloride ion content, depth of neutralization, and thickness of rebar protective layer in rebar corrosion status were 0.0767, 0.0566, 0.3459, 0.1089, and 0.1186, respectively, which means that chloride ion content, thickness of rebar protective layer, and depth of neutralization take the highest priority. As shown in Table 6, the overall C.R. was 0.0105≤0.1, which indicates consistency among the results.
Table 6 Consistency results for rebar corrosion status
Rebar corrosion status C.R.= 0.0105
Corrosion
potential Corrosion current
Chloride ion content
Depth of neutrali-zation
Thickness of rebar protective layer Corrosion potential 1 0.67258 0.21808 0.4007 0.4765
Corrosion current 1.4868 1 0.2207 0.6693 0.6435 Chloride ion content 4.5855 4.5308 1 3.9778 3.1696 Depth of neutrali-zation 2.4956 1.4942 0.2514 1 0.8073
Thickness of rebar
protective layer 2.0987 1.5540 0.3155 1.2388 1
means that spalling/exposed rebar, cracking, and honeycombing/pockmarks take the highest priority. As shown in Table 7, the overall C.R. was 0.0208≤0.1, which indicates consistency among the results.
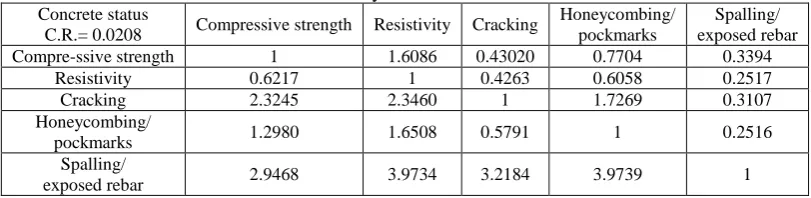
The results in Table 5 show that for concrete status, the weight values of compressive strength, resistivity, cracking, honeycombing/pockmarks, and spalling/exposed rebar are 0.0354, 0.0257, 0.0610, 0.0386, and 0.1326, respectively, which means that spalling/exposed rebar, cracking, and honeycombing/pockmarks take the highest priority. As shown in Table 7, the overall C.R. was 0.0208≤0.1, which indicates consistency among the results.
Table 7 Consistency results for concrete status
Concrete status
C.R.= 0.0208 Compressive strength Resistivity Cracking
Honeycombing/ pockmarks
Spalling/ exposed rebar Compre-ssive strength 1 1.6086 0.43020 0.7704 0.3394
Resistivity 0.6217 1 0.4263 0.6058 0.2517 Cracking 2.3245 2.3460 1 1.7269 0.3107 Honeycombing/
pockmarks 1.2980 1.6508 0.5791 1 0.2516 Spalling/
exposed rebar 2.9468 3.9734 3.2184 3.9739 1
3.2 Environmental factors
Table 8 Grading standards for influence of environmental conditions
Grade of environment Environmental conditions Influence coefficient
I Mild Submerged in seawater; wet areas; not directly in the sun or rain;
underwater components 1.00
II Moderate Humid inland area; alternating wet and dry conditions; general
environment; affected by the sun and rain 1.05 III Severe Coastal environment; acid rain environment 1.10 IV Extreme Corrosive water, gas, or soil; tidal zone; surf zone 1.15
Table 9 Evaluation standards for structure age factors
Structure age at the time of analysis/design service life Influence coefficient
K < 0.2 1.00
0.2 K 0.4 1.05 0.4 K 0.6 1.10 0.6 K 0.8 1.15
0.8 K 1.20
Northern Taiwan has a subtropical monsoon climate that is hot and rainy in the summer, when the northeast monsoon from subtropical high pressures brings an abundance of rain and typhoons are common. In the winter, continental air masses pass over the Taiwan Strait before reaching Northern Taiwan, which therefore gets milder and rainier weather than other coastal regions at the same latitude. In contrast, Southern Taiwan has a tropical monsoon climate with high temperatures all year round and distinct wet and dry seasons. There is little rain in the winter due to the northeast monsoon, but the weather turns hot and rainy once the southwest monsoon comes.
Taiwan is home to flourishing industries and numerous vehicles, which emit significant amounts of corrosive exhaust into the air and cause severe air pollution. The gases merge with the moisture in the atmosphere and produce acid rain, which neutralizes concrete and leads to rebar corrosion. Structures such as houses, power plants, and breakwaters are common in coastal areas and thus susceptible to salt damage. Other structures are near the water table, and if the groundwater contains corrosive ions such as chloride ions and sulfate ions, it will affect the durability of the structures.
presence of harmful gases, pH value, and freeze-thaw conditions. The above information can be obtained from existing weather data and maintenance personnel; on-site measurements may be necessary.
It roughly divided Taiwan into three types of environments: tidal zones, coastal regions, and mountainous areas. Based on influences from carbon dioxide, chloride ions, and sulfate ions, it developed grading standards for the influence of environmental conditions in Taiwan, as presented in Table 8.
3.3. Structure lifespan factors
The service life or the durable life of a structure is defined as the period of time that a structure can maintain its expected functions under normal use and maintenance conditions. The degradation of a concrete structure’s performance is extremely complex, and thus, the service life of a structure is determined not only by the structure itself but also by the environment it is in. In some cases, damage can occur in structural components even though rebar corrosion is not severe, or a component can work normally without damage even though corrosion has already caused significant loss of rebar cross-section. As a result, there is no fixed set of evaluation criteria for durability. To give adequate consideration to the economic and social benefits of structures, it included age factors as one of the amplified coefficient evaluation items. As shown in Table 9, the influence coefficient of age is determined based on K, which is the ratio of structure age at the time of analysis and the design service life of the structure.
3.4. Structure purpose factors
Structures are designed based on their future purpose. Structures that will store special items or be a gathering place for people, such as gas stations, nuclear power plants, and hospitals, require special attention and caution in certain aspects, which means that the influence coefficient will be particularly high. In general buildings or less hazardous structures, the influence coefficient will be lower, as shown in Table 10. Evaluators can determine the influence coefficient of structures on their own based on the degree of influence that the structures have.
Table 10 Evaluation standards for structure purpose factors
Grade of structure Structure contents Influence coefficient
I Other general buildings 1.00
II Public building 1.05
III Hazardous building 1.15
IV Post-disaster building 1.20
Note: I: Other buildings; II: Schools, malls, movie theatres, train or bus stations;III: Structures storing toxic or explosive substances, such as gas stations; IV: Buildings that provide emergency services in the event of a disaster, such as hospitals and fire stations
3.5. Earthquake potential factors
Table 11 Evaluation standards for earthquake potential factors
Monthly average number of
earthquakes Influence coefficient X < 150 1.00 150 X 300 1.05 300 X 450 1.10 450 X 600 1.15 600 > X 1.20
Earthquakes cause violent ground tremors that damage structures and threaten lives and property. Appropriate measures are therefore necessary to reduce the damage and losses incurred by earthquakes. It, therefore, regarded earthquake potential factors as amplification factors. Earthquake potential was determined using the monthly average number of earthquakes for various regions of Taiwan. Table 11 shows the evaluation standards for the monthly average number of earthquakes, which is denoted by X. It used data from the Central Weather Bureau from 2006 to 2015.
3.6. Comprehensive evaluation method for durability
The comprehensive evaluation of durability conducted in [13] examined the durability of single structural components before assessing the overall structure. It employed the same approach in this study, albeit with three layers unlike the two layers was used [19]. The calculation method, however, was identical to that in [19]:
𝐸1= 𝛿𝑡𝑜𝑡𝑎𝑙𝑙× ∑ ∑ 𝛼𝑖𝛽𝑖𝑗𝛾𝑖𝑗 5
𝑗=1 2
𝑖=1
(1)
where,
E1 : durability of single structural component;
total : product of all amplified coefficients;
i : the two major categories in the first layer;
j : the five major categories in the second layer;
i : the weight of category i, the layer of which is divided into two categories;
ij : the evaluation coefficient derived for index j in category i;
ij : the weight value derived for index j in category i.
In actual operation, not all items will be used. If only a portion of the items is tested, then the following equation can be used for evaluation:
𝐸1= 𝛿𝑡𝑜𝑡𝑎𝑙𝑙× ∑ 𝛼𝑖
∑𝑛𝑗=1𝛽𝑖𝑗𝛾𝑖𝑗 ∑𝑛𝑗=1𝛾𝑖𝑗 2
𝑖=1
(2)
Table 12 Evaluation standards for earthquake potential factors
E1 range A grade of component durability Component durability status
1 E1 < 2 1 Very good
2 E1 < 3 2 Good
3 E1 < 4 3 Passable
4 E1 < 5 4 Poor
E1 5 5 Very poor
Once single components have been evaluated, it can assess the durability of the overall structure, which is the weighted assessment of all of the components:
𝐸
𝑡𝑜𝑡𝑎𝑙𝑙= ∑ 𝐸
1𝑘𝜌
𝑘𝑚
𝑘=1
(3)
where,
E total : the durability evaluation result of the overall structure;
E1K : the durability evaluation result of a single component;
m: the number of structural components evaluated;
k : the recommended weight value of the structural component in question.
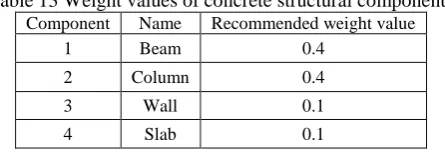
Table 13 Weight values of concrete structural components
Component Name Recommended weight value
1 Beam 0.4
2 Column 0.4
3 Wall 0.1
4 Slab 0.1
Tables 13 and 14 contain the recommended weight values for various structural components and floor levels [20]. Evaluators can choose to adjust the weight values of more severe places or increase the number of components. The total sum of the products of durability evaluation results for single components and their recommended weight values determines the durability of the overall structure, as shown in Table 15 [19].
Table 14 Weight values of concrete structural components for floor
Component Name Recommended weight value 1 1st floor 0.25
2 2nd floor 0.25 3 3rd floor 0.25
4 4th floor 0.25
Table 15 Weight values of concrete structural components for floor
Etotal range Structure durability grade Structure durability status Recommended approach
1 Etotal < 2 1 Very good Use as normally
2 Etotal < 3 2 Good Use as normally
3 Etotal < 4 3 Passable Continue maintenance
4 Etotal < 5 4 Poor Reinforce
Etotal 5 5 Very poor Demolish
4.
Case Stud
4.1. The junior high school building
Table 16 Weight values of concrete structural components for floor
Name of building Junior high school teaching building Year of construction 1989
Constructed in phases No
Scale of building 4 floors above ground, 1 floor below ground Building height (m) Total height 14.4 m [email protected] (1F raised by 0.9 m)
Structural system RC beams, columns, and frame; brick inner and outer walls Current purpose Classrooms
The focus of this case study was a junior high school building in the Tucheng District of New Taipei City, Taiwan [21]. The building comprised five floors, one floor below ground and four floors above ground. Completed in 1989, it was slated for earthquake resistance assessment in 2012. Table 16 presents the basic information about the building, and Fig. 2 displays a photo of the actual building. The tests performed includ compressive strength, neutralization, chloride ion content, and protective layer thickness, as shown in Table 17.
Table 17 Test items
Item Quantity Case rules Minimum requirement Compressive strength 15 cores 3 cores/floor 3 cores/floor
Neutralization 15 cores 3 cores/floor 3 cores/floor Chloride ion content 5+2 cores 1 core/floor (3 cores for 4F) 1 core/floor Protective layer thickness 30 locations 3 beams and columns/floor 3 beams and columns/floor
Item Quantity Case rules Minimum requirement
Fig. 2 Exterior of junior high school teaching building
4.2. Evaluation results
Environmental factors: The junior high school is inland and subject to general environmental influences, including normal sun and rain. It, therefore, determined the environment grade to be moderate, so the influence coefficient is 1.05.
Structure lifespan factors: The school building was constructed in 1989, and the tests were performed in 2012. Based on the time at which the school building was constructed, the design service life of the building should be 50 years. Dividing the structure age at the time of analysis of the design service life produces a K value greater than 0.4 and less than 0.6. This, the influence coefficient is 1.10.
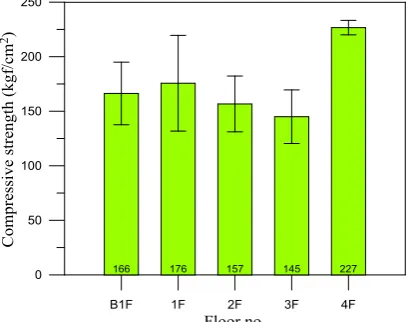
Structure purpose factors: The tested building is the teaching building of a public junior high school, so the influence coefficient is 1.05. Earthquake potential factors: The building is located in Tucheng District of New Taipei City. Historical data indicate that averages of 17 earthquakes happen each month in the area, so the influence coefficient is 1.00. Compressive strength test results: The compressive strength of three cores taken from each floor was tested. The compressive strength of each core and the mean compressive strength for each floor are presented in Fig. 3.
The school building was constructed in 1989. Based on the time at which the school building was constructed, the design strength of the concrete should be 210 kgf/cm2, for which the evaluation was as follows:
B1F: mean strength Rim=166.3, design strength R=210, for which K_bm=0.792; thus, the evaluation standard value is 5.
1F: mean strength Rim=175.7, design strength R=210, for which K_bm=0.837; thus, the evaluation standard value is 5.
2F: mean strength Rim=156.7, design strength R=210, for which K_bm=0.746; thus, the evaluation standard value is 5.
3F: mean strength Rim=145.0, design strength R=210, for which K_bm=0.690; thus, the evaluation standard value is 5.
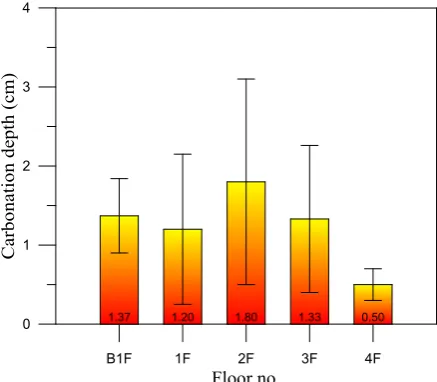
4F: mean strength Rim=226.7, design strength R=210, for which K_bm=1.080; thus, the evaluation standard value is 1. The depth of carbonation test results: Cores were obtained from three beams on each floor for the carbonation test, the results of which were summarized in Fig. 4.
Fig. 4 Carbonation depth versus Floor no. histograms
Table 18 Carbonation depth evaluation results
Floor
carbonation depth /design protective layer thickness
Evaluation standard
value
B1F 0.34 2
1F 0.30 2
2F 0.45 3
3F 0.33 2
Design specifications for reinforced concrete structures stipulate that the concrete must provide the rebar with a protective layer of a certain thickness. The design thickness of beams, in general, is 4 cm. The carbonation depth exceeded 4 cm in none of the 15 cores, reaching 2.6 cm at the most. Table 18 displays the carbonation depth evaluation results. The assessment of carbonation depth can be performed based on the ratio of the mean carbonation depth and the protective layer thickness of the structural component in question. Except for the 1 for the fourth floor and the 3 for the second floor, it adopted 2 for the evaluation indices for the various floors.
Chloride ion content results: As shown in Fig. 6, the seven concrete cores displayed chloride ion content ranging from 0.0209 kg/m3 to 0.6806 kg/m3. The one specimen of the chloride ion content of Core was relatively high at 0.6806 kg/m3. For this reason, it tested another two cores from the fourth floor, it presented more normal results. It thus surmised that the concrete had been contaminated during construction, which resulted in a local high content of chloride ions. The results from B1F to 3F were not high, so it selected 1 for their evaluation standard values. Due to the possible contamination of the concrete on the fourth floor, it adopted the mean chloride content from the three cores taken there, thus resulting in an evaluation standard value of 3.
Fig. 5 Rebar detection depth versus Floor no. histograms Fig. 6 Chloride ion content versus Floor no. histograms
Table 19 Rebar detection results
Floor No. Main rebar Stirrups Protective layer + paint layer (cm) Protective layer thickness (cm)
B1F (Column)
7 4-#8 #3@18cm 7.5 5.0
11 3-#8 #3@17cm 7.0 4.5
12 3-#8 #3@17cm 7.5 5.0
B1F (1F beam)
8 2-#8 #3@16cm 7.5 5.0
9 4-#8 #3@16cm 6.0 3.5
10 4-#8 #3@19cm 8.5 6.0
1F (Column)
1 2-#8 #3@16cm 7.5 5.0
3 2-#8 #3@26cm 7.5 5.0
6 3-#8 #3@15cm 7.0 4.5
1F (2F beam)
2 3-#8 #3@11cm 8.0 5.5
4 3-#8 #3@18cm 7.5 5.0
5 3-#8 #3@13cm 8.5 6.0
2F (Column)
13 3-#8 #3@16cm 6.0 3.5
16 2-#8 #3@17cm 7.5 5.0
18 3-#8 #3@15cm 7.5 5.0
2F (3F beam)
14 2-#8 #3@16cm 8.0 5.5
15 3-#8 #3@10cm 8.0 5.5
17 3-#8 #3@20cm 7.0 4.5
3F (Column)
19 3-#8 #3@15cm 7.0 4.5
23 2-#8 #3@15cm 7.0 4.5
24 2-#8 #3@14cm 6.5 4.0
3F (4F beam)
20 2-#8 #3@22cm 8.0 5.5
21 2-#8 #3@16cm 7.5 5.0
22 2-#8 #3@16cm 6.0 3.5
4F (Column)
25 2-#8 #3@15cm 7.5 5.0
26 3-#8 #3@17cm 6.5 4.0
27 2-#8 #3@17cm 5.0 2.5
4F (RF beam)
28 1-#8 #3@17cm 5.5 3.0
29 2-#8 #3@12cm 8.0 5.5
30 2-#8 #3@28cm 7.5 5.0
the surface paint layer. In contrast, some of the floors and walls showed efflorescence and peeling paint, but even these damages were concentrated in the restrooms, stairwells, hallways, and the outer walls of the basement. Efflorescence existed on all of the floors but did not greatly affect the use of the building. Based on our evaluation standards, the evaluation standard value was 3. Peeling paint appeared on the third and fourth floors. Thus, based on our evaluation standards with regard to exterior spalling and rebar exposure, the evaluation standard value was 1.
Table 22 displays the weight values for the various durability indices and the evaluation standard values for each floor in each durability item. Multiplying the sum of the products of the durability index weight values and the evaluation values of the amplification factors, then produce the durability of the overall building. The durability grades and conditions of each floor are as shown in Table 23 (calculated using the following formula), all showing good durability.
Table 20 Evaluation results for protective layer thickness
Floor Eigenvalue (Dne) Design value (Dnd) Dne / Dnd Evaluation index
B1F 3.53
4.00
0.883 2
1F 4.34 1.085 1
2F 3.63 0.908 2
3F 3.37 0.843 3
4F 2.24 0.56 4
Table 21 Exterior damages on each floor
Floor Exterior damages
B1F Numerous occurrences of dampness and efflorescence in ceilings, outer walls, and stairwell walls
1F Numerous occurrences of dampness and efflorescence in hallway ceilings and ceilings and outer walls of restrooms
2F Numerous occurrences of dampness and efflorescence in hallway and restroom ceilings
3F Numerous occurrences of peeling paint, dampness, and efflorescence in outer walls of stairwells, parapet walls, and connection to the B-1 building
4F Numerous occurrences of peeling paint, dampness, and efflorescence in outer walls of stairwells and parapet walls in the hallways
Table 22 Weight values for durability indices of each floor
Durability item Durability index Weight value Evaluation standard value B1F 1F 2F 3F 4F Rebar corrosion status - 0.7067
Corrosion potential 1 0.0801 Corrosion current 2 0.1086
Chloride ion content 3 0.4894 1 1 1 1 3 Depth of neutralization 4 0.1541 2 2 3 2 1 Thickness of rebar protective layer 5 0.1678 2 1 2 3 4
Concrete status - 0.2933
Compressive strength 1 0.1207 5 5 5 5 1
Resistivity 2 0.0875
Cracking 3 0.2081 3 3 3 3 3
Honeycombing/ pockmarks 4 0.1315
Spalling/exposed rebar 5 0.4522 1 1
Amplification factors Influence coefficient
Environmental factors 1.05
Structure lifespan factors 1.10 Structure purpose factors 1.05 Earthquake potential factors 1.00
Table 23 Weight values for durability indices of each floor
Floor
carbonation depth /design protective layer
thickness
Evaluation standard value
B1F 0.34 2
1F 0.30 2
2F 0.45 3
𝐸
1= 𝛿
𝑡𝑜𝑡𝑎𝑙𝑙× ∑ 𝛼
𝑖∑
𝑛𝛽
𝑖𝑗𝛾
𝑖𝑗𝑗=1
∑
𝑛𝛾
𝑖𝑗𝑗=1 2
𝑖=1
(4)
Once the single-component durability assessments were completed, the durability of the overall structure could be evaluated by inputting all relevant data into the overall durability evaluation formula:
𝐸𝑡𝑜𝑡𝑎𝑙𝑙= ∑ 𝐸1𝑘𝜌𝑘 𝑚
𝑘=1
(5)
With the building containing five floors, it used 0.2 for the weight values of each floor, as shown in Table 24. Multiplying all of the evaluation standard values previously obtained by their weight values gives the durability assessment of the overall building. The result was 2.54, which falls within the range of 2 Etotal < 3. Thus, the durability grade was 2,
which indicates good durability. Therefore, the building can, be used normally.
Table 24 Durability evaluation of overall structure
Floor Recommended
weight value
Evaluation standard value
B1F 0.2 2.53
1F 0.2 2.35
2F 0.2 2.69
3F 0.2 2.14
4F 0.2 2.97
5.
Conclusions
This study made the following discoveries. This study developed a comprehensive evaluation method comprising 10 durability indices to assess the durability of reinforced concrete materials. Questionnaire design and investigation were conducted using AHP by the professional civil engineers or professional structural engineers. The C.R. The values of the questionnaire results were less than 0.1, it revealed a high internal consistency reliability. It also revealed that the weight values for rebar corrosion status and concrete status were 0.7067 and 0.2933, respectively, which means that the former is more crucial significant index of the rebar corrosion status than that of the concrete status. On the basis of the aspects of rebar corrosion status, chloride ion content had the highest weight value(0.3459) and followed by the thickness of the rebar protective layer (0.1186); For the aspects of concrete status, the spalling/exposed rebar had the highest weight value (0.1326) and followed by cracking (0.0610). Finally, the durability grade of the overall building in the case study was 2.54, which indicates good conditions. The durability grades established in this study can serve as reference for maintenance, reinforcement, or demolishment so as to achieve longer use and ensure safety. The evaluation method is simple to perform and convenient to summarize as the basis of the comprehensive evaluation method for durability.
References
[1] M. H. Wu, “Testing, evaluation, and corrosion prevention techniques for aging and degrading RC structures,” Journal of Chinese Institute of Engineers in Kaohsiung, vol. 17, pp. 8-18, April 2010.
[2] C. W. Chang, “Establishment deterioration model for reinforcing concrete bridge in Taiwan,” Master Thesis, Dept. Civil Eng., National Central Univ., Taoyuan, Taiwan, 2004.
[3] H. M. Kim, A. U. Johnson, and Z. J. Mohd, “Structural performance of reinforced geopolymer concrete members: a review,” Construction and Building Materials, vol. 124, pp. 251-264, September 2016.
[4] P. C. Ryan and A. O’Connor, “Comparing the durability of self-compacting concretes and conventionally vibrated concretes in chloride rich environments,” Construction and Building Materials, vol. 120, pp. 504-513, September 2016. [5] H. Pan, Z. Yang, and F. Xu, “Study on concrete structure’s durability considering the interaction of multi-factors,”
[6] C. Y. Wang, W. N. Chiang, M. T. Liang, Y. M. Tien, Y. C. Yang, C. C. Yeh, C. H. Liang, K. Y. Peng, M. C. Chen, W. K. Hsu, Y. L. Sung, Y. C. Liang, and H. L. Wang, Code development on diagnosis, evaluation and rehabilitation of deteriorated reinforced concrete bridges in transportation infrastructure system (II), Ministry of Transportation and Communications, Taiwan, 2004.
[7] C. C. Chang, M. C. Chi, W. C. Yeh, and C. C. Hung, “Development of structure material life cycle evaluation standards and durability evaluation indices (1): final Report,” Architecture and Building Research Institute, Ministry of the Interior, Taiwan, 2011.
[8] V. Kutut, E. K. Zavadskas, and M. Lazauskas, “Assessment of priority alternatives for preservation of historic buildings using model based on ARAS and AHP methods,” Archives of Civil and Mechanical Engineering, vol. 14, pp. 287-294, February 2014.
[9] W. T. Chen, T. T. Chen, C. S. Lu, and S. S. Liu, “Analyzing relationships among success variables of construction partnering using structural equation modeling: a case study of taiwan's construction industry,” Journal of Civil Engineering and Managemen, vol. 18, pp. 783-794, November 2012.
[10] S. N. Kamaruzzaman, E. C. W. Lou, P. F. Wong, R. Wood, and A. I. Che-Ani, “ Developing weighting system for refurbishment building assessment scheme in Malaysia through analytic hierarchy process (AHP) approach,” Energy Policy, vol. 112, pp. 280-290, January 2018.
[11] Existed Building Seismic Capability Evaluation and Retrofitting Program: Renew Program, Construction and Planning Agency Ministry of the Interior, Taiwan, 2017.
[12] ACI Committee 437 report, strength evaluation of existing concrete buildings, ACI 437R, American Concrete Institute, 2003.
[13] Y. C. Liu, “Durability evaluation of RC bridges using analytic hierarchy process,” Master Thesis, Dept. Harbor and River Eng., National Taiwan Ocean University, 2011.
[14] C. P. Chu, “Analytical hierarchy process theory,” Lecture Report, National Dong Hwa University, 2009.
[15] L. G. Vargas, “An overview of the analytic hierarchy process and its applications,” European Journal of Operational Research, vol. 48, pp. 2-8, September 1999.
[16] G. A. Miller, “The magical number seven plus or minus two: some limits on our capacity for processing information,” Psychological Review, vol. 63, pp. 81- 97, March 1956.
[17] T. L. Satty and L. G. Vargas, “The logic of priorities: applications in business, energy, health, and transportation,” Boston: Kluwer-Nijhoff, 1982.
[18] H. A. Linstone and M. Turoff, “The Delphi method: techniques and applications,” Mass: Addison-Wesley, 1975. [19] J. C. Chang, J. Su, S. S. Chen, and Y. S. He, “Condition and durability assessment guidelines and construction examples
for old concrete bridges,” China Communications Press, July 2008.
[20] Z. R. Chen, “Evaluation of RC building durability index using analytic hierarchy process,” Master Thesis, Dept. Harbor and River Eng., National Taiwan Ocean University, 2012.
[21] Taiwan Professional Civil Engineers Association, “Earthquake resistance evaluation report for building a of tucheng junior high school in new taipei city,” Taipei, Taiwan, Evaluated Report, 2012.
Copyright© by the authors. Licensee TAETI, Taiwan. This article is an open access article distributed under the terms and conditions of the Creative Commons Attribution (CC BY-NC) license