ISSN: 2306-9007 Ali, Rehman & Nasir (2016) 1163
I
www.irmbrjournal.com September 2016I
nternationalR
eview ofM
anagement andB
usinessR
esearchV
ol. 5 Issue.3R
M
B
R
Stock Market Capitalization, Capital Formation and Growth
Evidence from Saudi Arabia
NASIR ALI
Department of Finance, King Saud University, Riyadh, Saudi Arabia
MOHAMMED ZIAUR REHMAN
Department of Finance, King Saud University, Riyadh, Saudi Arabia Email: ziacommerce@gmail.com
NAJEEB MUHAMMAD NASIR
Department of Finance, King Saud University, Riyadh, Saudi Arabia
Abstract
This study investigates the relationship between stock market capitalization and economic growth in Saudi Arabia. The study encompasses capital formation in a trivariate system for the period covering 1985 to 2012.The study employed the unit root tests and applied Johansen co-integration to investigate cointegration among the variables under study.Granger causality test is employed to identify the direction of causality among the variables. Vector Autoregressive Model reveals the existence of relationship between economic growth and stock market capitalization. The results of Granger causality tests manifest that stock market capitalization and capital formation causes economic growth in the Kingdom of Saudi Arabia. Further the stock market capitalization also causes the capital formation in the economy. Based on these outcomes, it can be cogently deduced that further development of Saudi stock market shall go a long way to substantiate the pace of the growth of the economy.
Key Words: Saudi Arabia, Stock market development, economic growth, Causality, VAR.
Introduction
Attaining accelerated economic growth is one of the central aims for the policy makers. Enhanced economic growth has favorable effect on the multifarious spheres of the economy. Umpteen researches have sifted through to illustrate the quintessence of economic growth. It is cogently revealed that the central direction of the purported studies in the sphere of economic growth is to unearth the cardinal ingredients that stimulate the pace of growth of the economy. Through the literature on the purported theme, it is unfolded that the levels of infrastructure, political stability, physical & human capital, development of technology, capital formation and financial intermediations are the prime ingredients for enhancing the pace of economic growth in the economy.
ISSN: 2306-9007 Ali, Rehman & Nasir (2016) 1164
I
www.irmbrjournal.com September 2016I
nternationalR
eview ofM
anagement andB
usinessR
esearchV
ol. 5 Issue.3R
M
B
R
United States.Capital formation assists in ascertaining the level of production, which per se, influence the growth of the economy. Studies like Romer (1986) and Lucas (1988) manifest the importance of capital formation in the enhancement of growth. Capital formation encompasses two facets, namely, the Gross Capital Formation (GCF) and Net Capital Formation (NCF).Like wise, the studies have manifested the potent of stock markets in enhancing the economic growth of the economies.Empirical studies covering cross country data reveals that there is positive influence of stock market in escalating the growth of the economy(Levine and Sara, 1996; Levine and Zervos ,1998; Henry,2000; Bekaert et al ,2005).In this very vein, the current endevour is undertaken to investigate the relationship between stock market capitalization and economic growth in Saudi Arabia. The study encompasses capital formation in a trivariate system.
The rest of this paper is ordered as follows: Section 2 provides an overview of Stock Market Capitalization, Capital Formation and Growth in the Saudi economy. Section 3 presents the literature review on the stipulated topic. Section 4 encompasses the methodology employed and the discussion of the results. Section 5 covers the conclusion of the study.
An overview of Stock Market Capitalization, Capital Formation and Growth in the
Saudi Economy
Saudi Arabia is the only Arab country to be ranked among the high income economies (G-20 economies).Since the starting of the twenty first century, Saudi economy has witnessed a period of unwavering oil boom. The economy yields more than 90 percent of the fiscal revenues and 80 percent of the export revenues from the trade in oil. Saudi economy exhibited the high growth on account of substantial hike in the oil prices. Thus the economy hinges on the dynamics of international oil markets. Increased oil prices resulted in acceleration of private arena, enhancement in the government outlays and in revamping the domestic settings. Further the rise in oil prices led to substantial fiscal revenues and waned the national debt level. Economic policies at the higher rung have been commercial -centric and have evinced interest in the promotion of private investment and job creation.Further, the government machinery has undeviatingly carried out multiple steps to diversify the economy and to enhance the pace of non-oil arena.
Through the World Bank report, it is revealed that during the time period of 1970 to 2012, the capital formation of the economy mounted to US$182.4 billion. The average annual growth of the capital formation in the economy was US $4.3 billion (359%). It is manifested through the report that the average annual growth of capital formation per capita in Saudi Arabia was US$148.5 or 71.6 per cent.
ISSN: 2306-9007 Ali, Rehman & Nasir (2016) 1165
I
www.irmbrjournal.com September 2016I
nternationalR
eview ofM
anagement andB
usinessR
esearchV
ol. 5 Issue.3R
M
B
R
From the World Bank report, it is manifested that the average annual GPD growth rate of Saudi Arabia has witnessed spectacular rise from 2.1 percent during 1990-2000 to 5.9 percent during the period of 2000-2009. IMF‟s computation reveals that the GDP for Saudi Arabia during 1990-2010, has been primarily on account of enhanced labour and capital ingredients. Explicitly, out of the average 3.2 percent GDP growth achieved by Saudi economy during the stipulated period, a 1.5 percentage point is on account of physical capital. Likewise, the growth rate progressed to 6.6 percent during the period of 2009-2013.In sum, during the period (2000-2014), the Saudi economy witnessed meteoric rise in the economic growth. The major economic and financial sector reforms at the domestic level have goaded the growth rate.The GDP growth is estimated to contract to 2.8 in the current year and likewise decrease to 2.4 in the ensuing year due to substantial drop in oil price. Though the current economic settings of the country can wane the economic growth in the short run, but it is sanguinely expected that the economic growth shall enhance in the long run.The extant literature pertains to the stock market and the growth in the economy.
Literature Review
Obstfeld (1994) reveals that the mechanism of internationally linked stock markets leads to sharing of international risk, which advances the resource allocation and stimulate the pace of growth.In line, Bencivenga, et. al. (1996) and Levine (1991) have shed light on the prowess of stock market in acceleration of economic growth.Beck & Levine (2004) examine the influence of stock markets and banks on economic growth employing a panel data set for the time span 1976–1998.The study revealed that the stock markets and banks have favorable weight on the domain of economic growth. Bekaert, Harvey & Lundblad (2005) examined data of multiple countries and revealed that the liberalization of the stock market contribute to an approximate one percent enhancement in the annual real economic growth over a time span of five years. Levine&Zervos (1996) investigate the association between the stock market development and economic growth. The study covered data pertaining to 41 countries from the 1976 to 1993.The study encompass the range of the development of stock market gauged by the volume, liquidity and diversification, while the economic growth was covered by real per capita growth rate. The study revealed robust linkage between the purported variables.Naik & Padhi (2015) investigate the impact of stock market development on economic growth employing a panel data of 27 emerging economies from 1995 to 2012.The study encompasses the stock market-based indicators such as market capitalization, value of share traded and turnover ratio. The study reports that the stock market development substantially adds to economic growth. Van Nieuwerburgh, Buelens & Cuyvers (2006) examines the long- period linkage between financial market development and economic development in Belgium. The study reveals substantial indications that stock market development caused economic growth in Belgium. Rousseau & Wachtel (2000) imparted a time dimension and investigate the relationship between equity markets and growth for 47 countries in a panel ambience with annual frequency data for 1980 -1995.The study underscore the significance of the stock markets deepening for economic growth.
Vazakidis and Adamopoulos (2009) examined the causal linkage between stock market development and economic growth for France for the period 1965-2007 employing a Vector Error Correction Model (VECM).The study unfolded that the economic growth has a positive effect on stock market development.Enisan & Olufisayo (2009) investigate the long run and causal linkage between stock market development and economic growth for seven countries in sub-Saharan Africa. The study reveals that the development of stock market is cointegrated with economic growth in Egypt and South Africa. Arestis, Demetriades and Luintel (2001) employing the time series data on selected five countries reveals that stock markets stimulate the growth pace in the economies.
ISSN: 2306-9007 Ali, Rehman & Nasir (2016) 1166
I
www.irmbrjournal.com September 2016I
nternationalR
eview ofM
anagement andB
usinessR
esearchV
ol. 5 Issue.3R
M
B
R
the linkage between stock market development and economic growth in Morocco from 2000 to 2013. The study reports long run linkage between stock market development & economic growth and exhibit unidirectional Granger-causalities directing from MASI, traded volume and stock market index to the real GDP. Mohtadi & Agarwal (2001) investigates the linkage between stock market and economic growth through the employment of a dynamic panel approach for 21 emerging markets over the time span of 21 years. The study manifests a positive linkage between the selected indicators of the stock market performance and economic growth.Olweny & Kimani (2011) examined the causal linkage between stock market and economic growth in Kenya for the time period 2001-2010.The study revealed that the causality runs in one direction from the NSE 20-share index to the GDP.Cooray, A. (2010) reveals that the stock market play a central ingredient in achieving the long growth of selected countries investigated. The study put forward a set of strategies in order to enhance the economic growth. Shahbaz, Ahmed & Ali (2008) examine the linkage between stock market development and economic growth in Pakistani economy from 1971 to 2006.Through the usage of J-J Co-integration and ARDL bounds testing approach, the study shows substantial linkage between stock market development and economic growth.
In line, selected studies focusing on the linkage between stock maket and capital formation are incorporated.Sarkar (2007) reveals that from 1950 to 2004, private fixed capital formation has no linkage with the share price movements in Indian economy. In line, Sarkar (2006) with a sample of 31 less developed countries manifest that cross-country variations in stock market capitalization do not clarify the cross-country variations in the growth rates of gross fixed capital formation. The time series analysis of 15 countries demonstrates that in the display of 10 cases, there is no favorable long-run linkage between the stock market turnover ratio and the growth of capital accumulation.
Back and Levine (2003) unfolds that favorable relationship appears between stock market development and capital formation. The stock markets support the business houses to garner long term finance for investments purpose. The study reiterates the potent of the capital market in generating substantial financial resources required to augment fixed capital in the country.Sarkar (2007) examined the data of 37 countries covering the developed and less developed countries during the time period 1976 to 2002. The study reveals that for the developed markets (encompassing US & UK), there is no favorable linkage between stock market and gross fixed capital formation. But the study reveals that stock markets having the French or German-origin civil law exhibit favorable linkage. Berndt & Morrison (1995) exhibits that industries with more percentage of high-tech capital leads to higher economic performance.Selected studies on the causal linkage between capital formation and economic growth are reviewed.
Uneze (2013) investigate the causal linkage between capital formation and economic growth in Sub-Saharan African countries employing recent panel cointegration and causality testing techniques. The study reveals that causality is both ways, signifing that higher economic growth contributes to higher capital formation and which further leads to higher economic growth. Levine and Renelt (1992) present positive substantial linkage between growth and the share of investment in GDP. Bond, Leblebicioglu, and Schiantarelli (2010) employing annual data for 75 countries for the time period 1960–2000, demonstrate favorable linkage between investment as a share of gross domestic product (GDP) and the long-run growth rate of GDP per worker.
ISSN: 2306-9007 Ali, Rehman & Nasir (2016) 1167
I
www.irmbrjournal.com September 2016I
nternationalR
eview ofM
anagement andB
usinessR
esearchV
ol. 5 Issue.3R
M
B
R
Data and Methodology
The study examines the relationship among stock market capitalization, capital formation and economic growth in the Saudi Arabia. Data is taken from World Bank and Saudi Arabian Monetary Agency (SAMA). Data cover the time period from 1985 to 2012. Capital Formation (CF) is measured by gross fixed capital formation in physical assets at purchase value at current price. Stock Market Capitalization (SMC) is measured by the market value of the shares and Economic Growth (GDP) is measured by Gross Dopmestic Product per capita.
Unit Root Tests
The Augmented Dickey-Fuller (ADF) and Phillips-Perron (PP) tests are used to verify the stationary trend in data. This study has applied unit root tests for data to observe the integrated order of variables.
The basic ADF equation for unit root is:
∆Yt = λ0 +λ1t + λ2 yt-1 +∑ ∆Yt-1 +e t
The Equation represents variables in the form of ∆Y t in a time period t, while λ0 is a constant term and ∆Y t = Y t -Yt-1where t represent the trend and et is noise error term used in the model.
Null hypothesis and Alternative hypothesis for the above mentioned equation are:
H0: λ2 = 0 (data is Non Stationary) H1: λ2< 0 (data is Stationary)
The H0 states that the data have a unit root and alternative hypothesis H1 states that data do not have a unit root.
Phillips-Perron (PP) Test is another test to establish the integrated order of the data. This test also considers the issues of serial correlation and heteroscedasticity in the data. The equation for this test is as under:
∆Z t=θZ t-1+α+e t
∆ denotes the first difference operator in the equation.The hypothesis for PP test is same as for ADF. Tables 1 and 2 show the results of unit root tests affirming that null hypothesis of no unit root cannot be rejected at levels as the absolute values of t statistic is less than the critical values in both tests. Unlikely at first difference where the t values are more than the critical values means H0 is rejected at the first difference. Therefore it can be established that all the variables under study are non-stationary at level and stationary at first difference.
Table 1 Adf Unit Root Test
Variables At level At first difference
With constant With constant linear trend
ConstanT With Costant Linear Trend t-stat C- value t-stat C- value t-stat C-
Value
ISSN: 2306-9007 Ali, Rehman & Nasir (2016) 1168
I
www.irmbrjournal.com September 2016I
nternationalR
eview ofM
anagement andB
usinessR
esearchV
ol. 5 Issue.3R
M
B
R
Table 2 PP Unit Root Test
Variables At level At first difference
With Constant With Constant and Linear Trend
With Constant With Constant and Linear Trend t-stat C- Value t-stat C- Value t-stat C- Value t-stat C- Value
GDP 2.1037 -3.6998 -2.009 -4.339 -5.2216 -3.7114 -6.551 -4.3743
SMC -0.854 -3.6998 -2.528 -4.339 -6.134 -3.7114 -6.018 -4.3743
CF .8804 -3.6998 -2.375 -4.339 -4.316 -3.7114 -4.45 -4.3743
Johansen Test for Co-integration
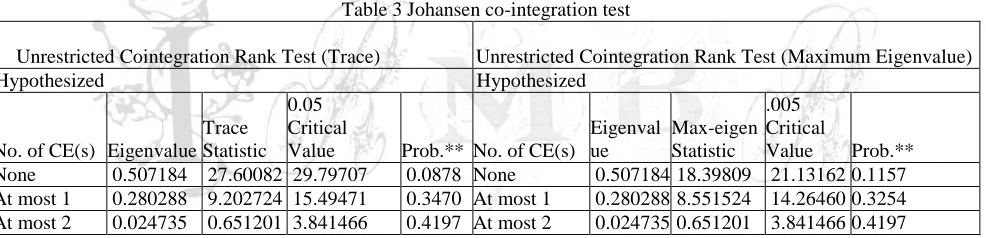
After resolving the issue of unit root, the co-integration test can be useful in order to judge the long run relationship among the variables. The co-integration theory states that although the variables in a model are non-stationary at levels but the linear relationship among them may still be stationary at difference. This study has applied multivariate co-integration approach which was developed by Johansen and Juselius (1990) to establish the long –run relationship among the variables under consideration. Table 3 below shows the results of Johansen co-integration test. It is evident from the results, that there is no co-integrated equation which implies the absence of any long run relationship among the variables. Trace test and Max-Eigen values are less than the critical values and respective p- values are also insignificant which asserts that Vector Error Correction Model (VECM) is not applicable in this specific case and suggest the use VAR model for further analysis.
Table 3 Johansen co-integration test
Unrestricted Cointegration Rank Test (Trace) Unrestricted Cointegration Rank Test (Maximum Eigenvalue)
Hypothesized Hypothesized
No. of CE(s) Eigenvalue Trace Statistic
0.05 Critical
Value Prob.** No. of CE(s)
Eigenval ue
Max-eigen Statistic
.005 Critical
Value Prob.** None 0.507184 27.60082 29.79707 0.0878 None 0.507184 18.39809 21.13162 0.1157 At most 1 0.280288 9.202724 15.49471 0.3470 At most 1 0.280288 8.551524 14.26460 0.3254 At most 2 0.024735 0.651201 3.841466 0.4197 At most 2 0.024735 0.651201 3.841466 0.4197
Trace test indicates no cointegration at the 0.05 level * denotes rejection of the hypothesis at the 0.05 level **MacKinnon-Haug-Michelis (1999) p-values
Unrestricted Vector Auto-regression (VAR) Model
Vector auto regression (VAR) is used to recognize the linear relationships for variables with multiple time series. The VAR model treats all variables as endogenous variables that mean a separate equation is generated for each variable. Each equation contains lagged values of all the variables as independent variables with the dependent variable itself. The basic equations used for VAR are given below:
GDPt,1 = α1 +φ11GDPt−1,1 + φ12SMCt−1,2 + φ13CFt−1,3 + wt,1 SMCt,2 = α2 +φ21GDPt−1,1 + φ22SMCt−1,2 + φ23CFt−1,3+ wt,2
CFt,3 = α3 +φ31GDP−1,1 + φ32SMCt−1,2 + φ33CFt−1,3 + wt,3
ISSN: 2306-9007 Ali, Rehman & Nasir (2016) 1169
I
www.irmbrjournal.com September 2016I
nternationalR
eview ofM
anagement andB
usinessR
esearchV
ol. 5 Issue.3R
M
B
R
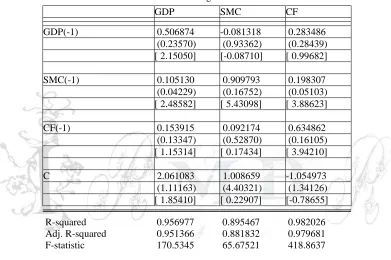
effect on economic growth and capital formation represented by CF has no significance as well .If stock market capitalization is taken as a dependent variable the lagged GDP, Capital formation and stock market capitalization does not have significant coefficient values. When capital formation is considered as dependent variable, the coefficients of GDP and CF are not significant and SMC have significant effect on the it.
Following are the equations with the values of the related coefficients:
GDP = 0.506874*GDP (-1) + 0.105130*SMC (-1) + 0.153915*CF (-1) +2.061083 SMC = -0.081318*GDP (-1) + 0.909793*SMC (-1) + 0.092174*CF (-1) + 1.008659 CF = 0.283486*GDP (-1) 0.198307*SMC (-1) + 0.634862*CF (-1) -1.054973
Table 4 Vector Autoregression Estimates
GDP SMC CF
GDP(-1) 0.506874 -0.081318 0.283486
(0.23570) (0.93362) (0.28439) [ 2.15050] [-0.08710] [ 0.99682]
SMC(-1) 0.105130 0.909793 0.198307
(0.04229) (0.16752) (0.05103) [ 2.48582] [ 5.43098] [ 3.88623]
CF(-1) 0.153915 0.092174 0.634862
(0.13347) (0.52870) (0.16105) [ 1.15314] [ 0.17434] [ 3.94210]
C 2.061083 1.008659 -1.054973
(1.11163) (4.40321) (1.34126) [ 1.85410] [ 0.22907] [-0.78655]
R-squared 0.956977 0.895467 0.982026 Adj. R-squared 0.951366 0.881832 0.979681 F-statistic 170.5345 65.67521 418.8637
The Selection of Lag Length
The outcomes of different lag length selection criteria that are stated in the table 5 shows that the optimal lag order for this model is one which is suggested by all of the selection methods.
Table 5
Lag LogL LR FPE AIC SC HQ
0 -19.08741 NA 0.001098 1.699031 1.844196 1.740833 1 45.06987 108.5738* 1.59e-05* -2.543836* -1.963176* -2.376627* 2 51.04791 8.737145 2.07e-05 -2.311378 -1.295223 -2.018762
* indicates lag order selected by the criterion
LR: sequential modified LR test statistic (each test at 5% level) FPE: Final prediction error
ISSN: 2306-9007 Ali, Rehman & Nasir (2016) 1170
I
www.irmbrjournal.com September 2016I
nternationalR
eview ofM
anagement andB
usinessR
esearchV
ol. 5 Issue.3R
M
B
R
Granger Causality Test
VAR can not ascertain the direction of causality so the study has utilized granger causality to identify the causal relationship between the variables. Granger Causality test can be described as under , if variables under consideration are incorporated.
∑ ∑ ∑
∑ ∑ ∑
∑ ∑ ∑
Where ECTt-1 is error correction term at lag order one and are white noise residual and
are the intercepts in the above model.
Table 6 shows Granger causality test, which reveals three causal relationships .The stock market capitalization causes economic growth where direction is from SMC to GDP at 5% level of significance. This is also suggested for capital formation and economic growth where the direction is from CF to GDP. Stock market capitalization also cause capital formation, the direction is from SMC to CF.
Table 6
Null Hypothesis: Obs F-Statistic Prob.
SMC does not Granger Cause GDP 27 10.6628 0.0033
GDP does not Granger Cause SMC 0.02304 0.8806
CF does not Granger Cause GDP 27 4.90194 0.0366
GDP does not Granger Cause CF 0.59160 0.4493
CF does not Granger Cause SMC 27 0.04686 0.8305
SMC does not Granger Cause CF 15.0523 0.0007
The Impulse Response Function
ISSN: 2306-9007 Ali, Rehman & Nasir (2016) 1171
I
www.irmbrjournal.com September 2016I
nternationalR
eview ofM
anagement andB
usinessR
esearchV
ol. 5 Issue.3R
M
B
R
Variance Decomposition Method
Variance decomposition method is another appropriate technique in order to explain the system dynamics. This specific method decomposes the variation in a variable into the component shocks in relation to other variables under consideration. It provides the information about specific random innovations to the variables in the model.
Tables 7, 8 & 9 Variance decomposition of GDP, SMC and CF GDP
Period S.E. GDP SMC CF
1 0.096834 100.0000 0.000000 0.000000 2 0.127000 85.70595 12.99586 1.298184 3 0.157999 67.08494 30.85903 2.056027 4 0.190625 52.40504 45.40139 2.193574 5 0.223056 42.21160 55.71049 2.077907 6 0.254054 35.22778 62.87144 1.900785 7 0.283012 30.34169 67.92866 1.729651 8 0.309705 26.82252 71.59500 1.582476 9 0.334123 24.21424 74.32509 1.460678 10 0.356365 22.23057 76.40846 1.360977 -.1
.0 .1 .2 .3
1 2 3 4 5 6 7 8 9 10
Response of GDP to GDP
-.1 .0 .1 .2 .3
1 2 3 4 5 6 7 8 9 10
Response of GDP to SMC
-.1 .0 .1 .2 .3
1 2 3 4 5 6 7 8 9 10
Response of GDP to CF
-.2 .0 .2 .4 .6
1 2 3 4 5 6 7 8 9 10
Response of SMC to GDP
-.2 .0 .2 .4 .6
1 2 3 4 5 6 7 8 9 10
Response of SMC to SMC
-.2 .0 .2 .4 .6
1 2 3 4 5 6 7 8 9 10
Response of SMC to CF
-.2 .0 .2 .4 .6
1 2 3 4 5 6 7 8 9 10
Response of CF to GDP
-.2 .0 .2 .4 .6
1 2 3 4 5 6 7 8 9 10
Response of CF to SMC
-.2 .0 .2 .4 .6
1 2 3 4 5 6 7 8 9 10
ISSN: 2306-9007 Ali, Rehman & Nasir (2016) 1172
I
www.irmbrjournal.com September 2016I
nternationalR
eview ofM
anagement andB
usinessR
esearchV
ol. 5 Issue.3R
M
B
R
SMC
Period S.E. GDP SMC CF
1 0.383563 5.132912 94.86709 0.000000 2 0.520768 4.928655 95.04366 0.027689 3 0.614638 4.883505 95.05716 0.059332 4 0.686146 4.908279 95.00413 0.087586 5 0.743686 4.962608 94.92561 0.111780 6 0.791602 5.027395 94.84017 0.132433 7 0.832459 5.093509 94.75634 0.150150 8 0.867900 5.156687 94.67788 0.165430 9 0.899039 5.215104 94.60623 0.178670 10 0.926669 5.268161 94.54165 0.190188
CF
S.E. GDP SMC CF
1 0.116837 22.15684 13.09637 64.74679 2 0.183673 27.74679 35.49440 36.75880 3 0.252763 25.84343 51.75561 22.40096 4 0.321262 22.69643 62.24222 15.06135 5 0.386668 19.93823 69.07128 10.99049 6 0.447698 17.78041 73.68091 8.538674 7 0.503868 16.13071 76.91247 6.956819 8 0.555149 14.86526 79.25650 5.878236 9 0.601752 13.88306 81.00749 5.109452 10 0.644005 13.10988 82.34867 4.541445
From the result of variance decomposition tables above, it can be seen that that about 74 per cent of GDP can be explained by the effects of stock market capitalization and it is about 1.3 per cent for capital formation. While 5.2 per cent of the stock market capitalization can be explained by the variations in GDP and it is only 0.19 per cent with respect to effect of capital formation. Capital formation is determined up to 13 per cent by the effects of GDP and it is 82 per cent in the case of stock market capitalization.
Conclusion
ISSN: 2306-9007 Ali, Rehman & Nasir (2016) 1173
I
www.irmbrjournal.com September 2016I
nternationalR
eview ofM
anagement andB
usinessR
esearchV
ol. 5 Issue.3R
M
B
R
implication that could be taken in consideration from the result of the purported study is the further development of the stock market.The kingdom should unfold more suitable framework for the Saudi stock market so as to enhance the pace of economic growth and capital formation.Agreements with the regional stock markets shall provide the cross–listings.Further,higher level of space in term of investment in the Saudi stock market for the foreign investors shall bring lead to more invesmtnent flows.
Acknowledgment
The authors would like to thank the Deanship of Scientific Research at King Saud University represented by the Research Center at CBA for supporting this research financially.
References
Arestis, P., Demetriades, P. O., & Luintel, K. B. (2001), Financial development and economic growth: the role of stock markets, Journal of money, credit and banking, 16-41.
Back, T. and Levine, R. (2003), Stock Markets, Banks and Growth: Panel Evidence, Journal of Banking and Finance, Vol. 29 (2) 56-78
Beck, T., & Levine, R. (2004),Stock markets, banks, and growth: Panel evidence, Journal of Banking & Finance, 28(3), 423-442.
Bekaert, G., Harvey, C. R., & Lundblad, C. (2005),Does financial liberalization spur growth? Journal of financial Economics, 77(1), 3-55.
Bencivenga, V.R., and B. Smith., and R.M. Starr,(1996),Equity Markets,Transaction Costs and Capital Accumulation: An Illustration." The World Bank Economic Review, Vol. 10: 241-65.
Berndt, E. R., & Morrison,C.J.(1995),High-tech capital formation and economic performance in US manufacturing industries An exploratory analysis.Journal of econometrics, 65(1), 9-43.
Blomstrom, M., Lipsey, R. E., & Zejan, M. (1993), Is fixed investment the key to economic growth? (No. w4436), National Bureau of Economic Research.
Bond, S., Leblebicioglu, A., & Schiantarelli, F. (2010), Capital accumulation and growth: a new look at the empirical evidence. Journal of Applied Econometrics,25(7), 1073-1099.
Cooray, A. (2010), Do stock markets lead to economic growth? Journal of Policy Modeling, 32(4), 448-460.
Enisan, A. A., & Olufisayo, A. O. (2009), Stock market development and economic growth: Evidence from seven sub-Sahara African countries. Journal of Economics and Business, 61(2), 162-171.
Henry, Peter Blair,(2000),„Do stock market liberalizations cause investment booms?,‟Journal of Financial Economics, 58, (1–2 ,October): 301–34.
International Monetary Fund, Annual Reports,
http://www.marketswiki.com/mwiki/Saudi_Stock_Exchange
http://www.marketwatch.com/story/5-things-to-know-about-the-saudi-arabia-stock-market-2014-07-22 http://www.nap.edu/read/1767/chapter/4
http://www.tadawul.com.sa/static/pages/en/Aboutus/Aboutus.html https://www.imf.org/external/np/sec/pr/2015/pr15383.htm International Monetary Fund, Annual Reports, Various Issues
K uznets, S. S.(1 971),Economic Growt h of Nations. Cambridge,Mass.Harvard University Press. K uznets, S.S. ( 1 973),Population,Capital and Growt h. New York:Norton.
Levine, R. (1991), “Stock Markets, Growth, and Tax Policy.” Journal of Finance, Vol. XLVI: 1445-1465 Levine, R., & Zervos,S.(1996),Stock market development and long-run growth. The World Bank Economic
Review, 10(2), 323-339.
Levine, R., and D. Renelt. (1992),“A Sensitivity Analysis of Cross-Country Growth Regressions.” American Economic Review 82: 942–963.
ISSN: 2306-9007 Ali, Rehman & Nasir (2016) 1174
I
www.irmbrjournal.com September 2016I
nternationalR
eview ofM
anagement andB
usinessR
esearchV
ol. 5 Issue.3R
M
B
R
Mehrara, M., & Musai, M. (2013),The Causality between Capital Formation and Economic Growth in MENA Region. International Letters of Social and Humanistic Sciences, 8, 1-7.
Mohtadi, H., & Agarwal, S. (2001),Stock market development and economic growth: evidence from developing countries. On line] Available at: http//www. uwm. edu/mohadi/PA-4-01. pdf.
Naceur, S. B., Ghazouani, S., & Omran, M. (2008),Does stock market liberalization spur financial and economic development in the MENA region?Journal of Comparative Economics, 36(4), 673-693. Naik, P. K., & Padhi, P. (2015),On the linkage between stock market development and economic growth in
emerging market economies: dynamic panel evidence. Review of Accounting and Finance, 14(4). Nurudeen, A. (2009), Does stock market development raise economic growth? Evidence from Nigeria. The
Review of Finance and Banking, 1(1), 015-026.
Obstfeld, M. (1994),“Risk-Taking, Global Diversification, and Growth”American Economic Review, Vol.84:1310-29.
Olweny, T. O., & Kimani, D. (2011),Stock market performance and economic growth: empirical evidence from Kenya using causality test approach.Advances in Management and Applied Economics, 1(3), 153-196.
Rousseau, P. L., & Wachtel, P. (2000),Equity markets and growth: cross-country evidence on timing and outcomes, 1980–1995. Journal of Banking & Finance, 24(12), 1933-1957.
Sarkar, P. (2007, November) Does Better Corporate Governance lead to Stock Market Development and Capital Accumulation? A Case Study of India. in conference on Corporate Governance in Emerging Markets, Sabanci University, Istanbul (pp. 15-17).
Sarkar, P. (2007, June). Stock Market Development and Capital Accumulation: What the Time Series Evidence Shows. In AISSEC Conference, University of Parma, Italy (21-23 January 2007.
Sarkar, P. (2006) Capital accumulation in less developed countries: does stock market matter?.
Shahbaz, M., Ahmed, N., & Ali, L. (2008),Stock market development and economic growth: ARDL causality in Pakistan. International Research Journal of Finance and Economics, 14(1), 182-195. Saudi Arabia Monetary Agency (SAMA) Annual Reports, Riyadh, Saudi Arabia.
Solow, R . M . ( 1 957), Technical change and the aggregate p r o d u c t i o n f u n c t i o n , Review of Economics and Statistics 39:312-320.
Tadawul , Annual Review, Saudi Equity Market, Riyadh, Saudi Arabia
Uneze, E. (2013),The relation between capital formation and economic growth: evidence from sub-Saharan African countries. Journal of Economic Policy Reform, 16(3), 272-286.
Van Nieuwerburgh, S., Buelens, F., & Cuyvers, L. (2006), Stock market development and economic growth in Belgium. Explorations in Economic History, 43(1), 13-38.
Vazakidis,A.and Adamopoulos,A.(2009),"Stock market development and economic growth." American Journal of Applied Sciences6.11 : 1932.
Wild, J. & Lebdaoui, H. (2014),Stock market performance and economic growth in Morocco. Global
Advanced Research Journal of Management and Business Studies, 3(5), 207-216.