P A L E O N T O L O G Y
Molecular identification of fungi microfossils
in a Neoproterozoic shale rock
S. Bonneville1*, F. Delpomdor2, A. Préat1, C. Chevalier3, T. Araki4, M. Kazemian4, A. Steele5, A. Schreiber6, R. Wirth6, L. G. Benning6,7
Precambrian fossils of fungi are sparse, and the knowledge of their early evolution and the role they played in the colonization of land surface are limited. Here, we report the discovery of fungi fossils in a 810 to 715 million year old dolomitic shale from the Mbuji-Mayi Supergroup, Democratic Republic of Congo. Syngenetically pre-served in a transitional, subaerially exposed paleoenvironment, these carbonaceous filaments of ~5 m in width
exhibit low-frequency septation (pseudosepta) and high-angle branching that can form dense interconnected mycelium-like structures. Using an array of microscopic (SEM, TEM, and confocal laser scanning fluorescence microscopy) and spectroscopic techniques (Raman, FTIR, and XANES), we demonstrated the presence of vestigial chitin in these fossil filaments and document the eukaryotic nature of their precursor. Based on those combined evidences, these fossil filaments and mycelium-like structures are identified as remnants of fungal networks and represent the oldest, molecularly identified remains of Fungi.
INTRODUCTION
Fungi are a eukaryotic kingdom that performs critical roles in the soil ecosystem (1). By forming vast microscopic filamentous networks (mycelium) in symbiosis with the roots of most plants (mycorrhiza), fungi can enhance rock weathering (2) and help the nutrient supply of plants, particularly in young, poorly evolved soils. Because of these abilities, ancestral fungi were crucial partners of the first phototrophs that colonized land surfaces (3). Although these associations are acknowledged as a requirement of terrestrial invasion, the timing of this evolutionary transition is largely unknown (4). The Rhynie cherts [407 million years (Ma) old] (5) with their superbly preserved fungi are considered a milestone of fungal fossil record and early colonization of land. However, despite their Devonian age, fungal remains in the Rhynie chert display a remarkable diversity (6), includ-ing members of Chytridiomycota, Blastocladiomycota, Glomeromycota, Mucoromycotina, and Ascomycota. Accordingly, molecular clock studies have placed the divergence of the main groups of Fungi within the Meso-Neoproterozoic (4). The terrestrialization of fungi dates from sometime between the Ordovician (443 to 485 Ma) to <800 Ma, while the earliest obligate biotrophic Glomeromycota fossils date from 455 to 460 Ma (4). The large uncertainty in the timing of fun-gal evolution and their transition to land essentially stems from the scarcity and the ambiguous nature of the Precambrian fungi that are notoriously difficult to distinguish from prokaryotic remains. A number of Precambrian remains (e.g., Caudosphaera, Hurionospora,
Shuiyousphaeridium, Horodyskia, and Tappania) (7–8), lichen-like fossils (9) from ~ 600 Ma, as well as filament fragments and spores from 0.9 billion to 1 billion years ago in Arctic Canada (10), mycelium-
like structures found in the Lakhanda group (1015 to 1025 Ma) (11), or even an older structure found in 2.4 billion–year–old basalt (12) were inferred to be of fungal nature, yet their conclusive attribution to Fungi remains problematic.
RESULTS
Geological setting
Here, we report the presence of filamentous networks (Figs. 1 and 2 and fig. S1) attributed to Fungi in dolomitic shale rock of the Mbuji- Mayi Supergroup (MMS) in the Sankuru-Mbuji-Mayi-Lomami-Lovoy (SMMLL) Basin, south-central of Democratic Republic of Congo (13) (fig. S2). The filamentous fossils were identified in a thin section cut in BIIc8 level (fig. S2) from a depth of 118.2 m in the Kanshi B13 drillcore (sample BK457b, core 118/4). The fungal networks were found embedded (Fig. 1F) in a homogenous mineral matrix preserved as cylindric filaments, as clearly visible in Figs. 1C and 2. This “three-dimensional” (3D) preservation results from an early dolomitic cementation [possibly due to schizohaline conditions (14)], which hindered substantial compaction during burial (see fig. S3 and “Paleoenvironment and petrography of the BIIc subgroup” in the Supplementary Materials for details). This BIIc8 dolomitic shale is a member of the BII group of the MMS that dominantly consists of shaley and stromatolitic dolostones with dolomitic shale interbeds. The lower BII group (i.e., BIIa-BIIb) accumulated on a marine outer-to-inner ramp, while the paleoenvironment of the upper BII (BIIc-BIId; fig. S2) evolved periodically toward a coastal, lagoon, perennial lacustrine pond with the deposition of a well-preserved fossil assemblage (15) and the development of cyanobacterial mats and stratiform stromatolites (16). The transition to terrestrial paleoenvironments in the upper BIIc is further evidenced by (i) the presence of coated pisoids and vadose/meteoric cements related to subaerial exposures (fig. S3) and (ii) a depleted, uniform light rare earth elements concentrations reflecting riverine water and continental sediment inputs (17) (“Paleoenvironment and petrography of BIIc subgroup” in the Supplementary Materials). The MMS deposition time frame is constrained (13) with an Ar-Ar age of 882.2 ± 9 Ma on a dolerite sill at the BI/BII group contact (fig. S2). Within BIIc, the
13C of carbonate rocks presents a large positive-to-negative excursion 1Biogéochimie et Modélisation du Système Terre, Département Géosciences,
Environnement et Société, Université Libre de Bruxelles, 50 Av. F. D. Roosevelt, 1050 Brussels, Belgium. 2Illinois State Geological Survey, University of Illinois at
Urbana-Champaign, 615 E. Peabody Dr., Champaign, IL 61820, USA. 3Center for
Microscopy and Molecular Imaging, Université Libre de Bruxelles, 12 rue des professeurs Jeener et Brachet, Charleroi 6041, Belgium. 4Diamond Light Source,
Harwell Science and Innovation Campus, Didcot, Oxfordshire OX11 0DE, UK.
5Geophysical Laboratory, Carnegie Institution of Washington, 1530 P St NW,
Washington, DC 20005, USA. 6German Research Centre for Geosciences, GFZ,
Telegrafenberg, 14473 Potsdam, Germany. 7Department of Earth Sciences, Free
University of Berlin, 12249 Berlin, Germany.
*Corresponding author. Email: steeve.bonneville@ulb.ac.be
Copyright © 2020 The Authors, some rights reserved; exclusive licensee American Association for the Advancement of Science. No claim to original U.S. Government Works. Distributed under a Creative Commons Attribution NonCommercial License 4.0 (CC BY-NC).
on September 17, 2020
http://advances.sciencemag.org/
Fig. 1. Textures and structures observed via light or scanning electron microscopy of a thin section from the fossiliferous dolomitic shale rock from BIIc8 (MMS). (A) Composite image of light microscopy (LM) views of dark, nontranslucide, interconnected filaments forming part of a large mycelium-like
structure covering ~0.2 mm2 detailed in fig. S1 (as well as other mycelium-like structures). Note that the area shown in (B) was exposed to WGA-FITC in Fig. 2.
(C) Scanning electron microscopy micrograph illustrating the presence of cells (~20 to 25 m in length) regularly spaced by putative septa or pseudosepta (white arrows) and showing putative anastomoses (red arrow).(D) LM image of a mycelium network of dark-colored filaments with Y- and T-branching (red arrows); black arrow marks the position of an FIB foil #4984 cut across a filament in the thin section. Inset shows a portion of mycelial network composed of dark, nontranslucide filaments branching at a right angle. (E) Histogram showing the width frequency distribution of filaments, with the solid line depicting the median at 5.5 m (the dashed line as first and third quartiles at 4.5 and 6.7 m). (F) Encrusted aspect of these fungal networks and the absence of tunneling patterns suggesting the syngenicity of these remains.
on September 17, 2020
http://advances.sciencemag.org/
(±7‰) coeval to the Bitter Springs 13C anomaly at ca. 810 Ma, while the age of the overlaying Kabele-Kabenga conglomerate is estimat-ed at 715 Ma (18) (fig. S2). Therefore, the estimated age of the fossil-iferous dolomitic shales from BIIc8 is between ca. 810 and 715 Ma.
Microfossil morphology
We document dark, nontranslucide, cylindrical filaments typically between 3.5 and 11.5 m in width (Figs. 1 and 2 and fig. S1), extending over several hundreds of micrometers in length (>1 mm of cumu-lated length in Fig. 1D). These filaments sometimes evolve into dense interconnected networks of ~500 m in diameter (Fig. 1B). In these mycelium-like structures, filaments exhibit multiple-order, high-
angle branching and, possibly, anastomosing filaments (Figs. 1 and 2 and fig. S1), common features of fungal networks yet rare for pro-karyotes. The width of filaments for extant and fossil fungi can easily range from 2 to >20 m (19). Thus, the size of the fossil filaments observed here fits well with fungal dimensions. However, size alone cannot be a reliable criterion to distinguish fungal from bacterial remains as prokaryotes also form filaments with large dimensions. A previous study (15) of rocks from the BIe-BIIc6 interval reported putative diversified prokaryotic and eukaryotic assemblages typical for the Tonian period (1000 to 720 Ma) with abundant sphaeromorph and acanthomorph acritarchs. In the BIIc8 unit, three putative fungal species—Eomycetopsis septata, Eomycetopsis cylindrica, and
Eomycetopsis rugosa—were documented (20) (depth interval between 118.4 and 122.90 m, i.e., 20 cm above our fossiliferous rocks at 118.2 m). They were described as cylindrical filaments aggregated in groups and parenchyma-like masses with septate filaments. At a later stage, those fossils first attributed to Fungi (20) were reassigned to tubular sheaths of cyanobacteria (21). Thus, to unequivocally determine whether the filamentous networks that we describe here represent Neoproterozoic fungal or cyanobacterial remains, an in-depth chemical characterization is required.
Chitin staining
One of the major constituents of fungal cell wall is chitin, a biopolymer of 1–4–bonded N-acetylglucosamine, which is abundant in fungi
and more generally in animal taxa (i.e., ciliates, arthropods, chryso-phytes, and diatoms), yet absent in prokaryotic organisms such as Actinomycetes (which can also form mycelium-like structures). Hence, chitin alone cannot be used as a unique defining trait of fungi; however, the chitin-producing organisms listed above are morpho-logically distinct from our fossils in that they do not form mycelial networks, and the presence of chitin within our filaments would be a strong argument for a fungal affinity. Chitin can be preserved throughout geological time. It has been detected in insects in an Oligocene shale (22) and in fungi preserved in Cretaceous amber (23), and it was even found in a 505-Ma-old marine sponge from the Burgess shale (24). Those discoveries support the idea that the main control of chitin preservation is not age but rather the environ-ment, with organic matter–rich sediment being ideal for preserva-tion (22). Here, we document the presence of chitin in the fossil filaments by staining with wheat germ agglutinin conjugated with fluorescein isothyocyanate (WGA-FITC), a highly specific dye of
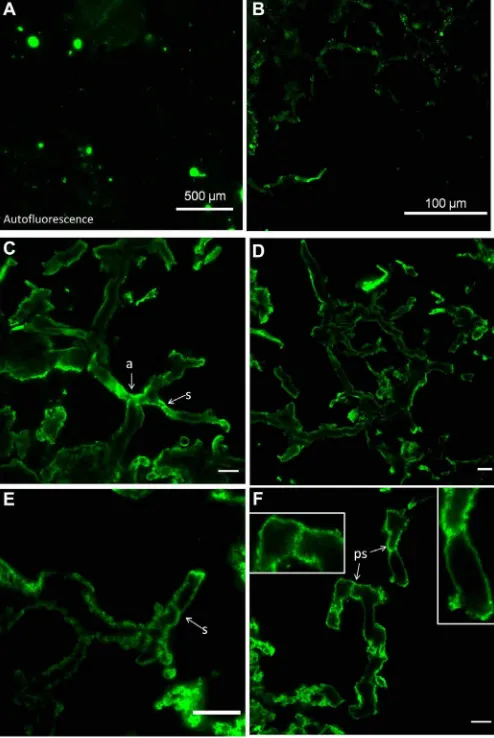
N-acetylglucosamine trimers (19). WGA-FITC has been widely used to discriminate between fungal hyphae and filamentous pro-karyotes in soils, sediments, and rocks, as well as in cyanobacteria- fungus endosymbiosis (i.e., Geosiphon-Nostoc) and has also been applied as a fungal marker in Eocene basalt (19) and in Cretaceous amber (23). We used confocal laser scanning fluorescence micros-copy and observed that the WGA-FITC binds to extensive portions of the mycelial structure (Fig. 2). In the mycelium, WGA-FITC was detected in the cell wall of filaments that appear cylindrical (rounded cross section of a filament in Fig. 2C), suggesting a preservation in three dimensions of the remains. A few septa were stained as well (Fig. 2, C to F) and, on some instances, what appear to be “incomplete septa” (pseudosepta) that do not fully separate adjacent cells (Figs. 2C and insets of 2F). Confocal views also allow observing some putative anastomosis of fungal filaments (Fig. 2C). In contrast to our observations in filamentous networks, staining was negative when WGA-FITC was exposed to inclusions of “nonfungal” organic matter in BIIc6 shale, Fig. 2. Confocal laser scanning fluorescence microscopy using WGA-FITC of
mycelium-like structure illustrated in Fig. 1. Overview image in (A) shows the
absence of large natural autofluorescence (i.e., without WGA-FITC) of the thin section. In contrast, with WGA-FITC labeling, the same area exhibits filamentous, mycelium-like structure visible in (B) (top section). (C to F) High-resolution confocal fluorescence views of the mycelium-like structures. The WGA-FITC binds specifically on the cell wall of the fossil filaments, which appears cylindrical (as evidenced by a rounded cross section of filaments). Several septa (s) are also stained. Note in (C) that the arrows highlight septa present in putative anastomosing filaments (a) illustrated in Fig. 1A (arrows; images are mirrored as confocal microscope is inverted). Insets in (F) illustrate septa (ps) with perforation or “bulged,” which resembles pseudosepta (39). Scale bars, 10 m (C to F).
on September 17, 2020
http://advances.sciencemag.org/
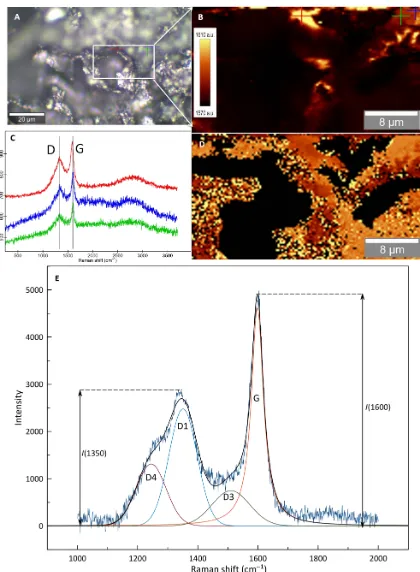
Fig. 3. Confocal raman spectroscopy of the filamentous network illustrated in Fig. 1A-B. (A) Reflected LM of a filamentous network in Fig. 1A. (B) G band intensity
map of the filament shown in (A). a.u., arbitrary units. (C) Representative spectra showing the D and G bands analyzed (marked “D” at ~1350 cm−1 and “G” at ~1600 cm−1
on the spectra) from the areas marked by crosses in (B). The coloration of the spectra corresponds to the color of the crosses seen in (B). (D) G band peak center map from the same area (i.e., B) that shows significant variations in the G band peak center across the filamentous network. (E) Representative Raman spectrum illustrating the deconvolution in D1, D3, D4, D5, and G bands used to calculate diagenetic peak temperature and the determination of the parameter I(1350)/I(1600). The thermal matu-ration of the fossilized filament was derived according to the FWHM-D1 geothermometer relationship in (26).
on September 17, 2020
http://advances.sciencemag.org/
indicating that WGA-FITC maintained its high-specificity binding when exposed to ancient, mature organic matter (fig. S4). Considering the fungus-like morphology, the colocalization/binding of the WGA-FITC with/to cell wall/septa and its specific affinity for chitin, we assert that the staining can be used as a clear indicator of chitinous remnants. Simultaneously, the detection of vestigial chitin in these filamentous fossils is a strong indication of their fungal origin. Organic matter ultrastructure in fossil filament
Raman microspectroscopy on filaments (Fig. 3) revealed two broad peaks at ~1350 cm−1 (Fig. 3D) and at ~1600 cm−1 (Fig. 3G) typically associated with low structural order, amorphous carbonaceous matter (25). Deconvolution of those two spectral features provided D1, D3, D4, and G bands (Fig. 3E), which are characteristic of organic matter that experienced advanced diagenesis or low-grade metamorphism (26). We calculated the peak temperature of the fossil filament (and of the dolomitic shale organic matter away from mycelium/filament structure) to a range between 150° and 250°C (Fig. 3), which is also in line with the Raman-derived temperature calculated for asphaltite inclusions in various BIIc dolostone (27). Note that the dissolution of fungal hypha and chitin was shown both to start at much higher temperature ~250° to 300°C and to complete at 380° to 390°C (28). Here, considering the peak temperature experienced by the fossil filaments, it is likely that they retain some characteristics or struc-tural compounds (e.g., chitin) that can be diagnostic of the original microorganism.
Recently, the Raman 1350 to 1600 cm−1 intensity ratio—I(1350)/
I(1600)—which was previously used to estimate the structural order of carbonaceous matter (29), was combined with the Fourier transform infrared (FTIR) branching index of aliphatic chains, R3/2 (derived from the 2800- to 3000-cm−1 spectral regions). The idea is to use the
I(1350)/I(1600) versus R3/2 trends to discriminate between pro-karyotic and eupro-karyotic fossils (29–31). Eukaryotic cells differ widely from the prokaryotic ones in terms of their cell structure and chemical compositions (i.e., different membranes, cell wall, and organelles), which result in different taphonomic behaviors and distinctive
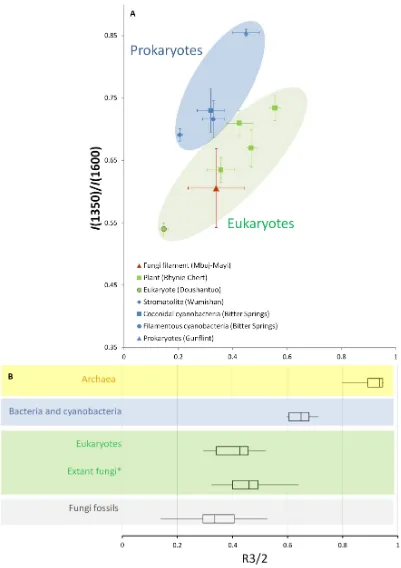
I(1350)/I(1600) versus R3/2 trends (29, 30). Synchrotron radiation– based (SR)–micro-FTIR (FTIR) spectra (Fig. 4) acquired on the fossil filaments revealed a strong aliphatic signal with an average branching index R3/2 of 0.34 ± 0.1. This rather low R3/2 value indicates the presence of long straight-chain aliphatic molecules and fits reason-ably well with known R3/2 values for extant eukaryotic groups (31) including fungi (Fig. 5). When compared with I(1350)/I(1600) ver-sus R3/2 signatures of known fossils of eukaryotic and prokaryotic microorganisms, our fossilized filaments with a I(1350)/I(1600) ratio of ~0.6 ± 0.06 fall well in the eukaryotic trend and clearly differ from a prokaryotic signature (Fig. 5). This combined Raman-FTIR
signature suggests a eukaryotic precursor for the organic matter of the fossil filament. This result, together with the morphology, dimen-sions, and the presence of chitin remnants, further supports the idea of a fungal origin for those fossil filaments.
Chemical characterization and molecular signature
Beyond the R3/2 ratio, the SR-FTIR data also revealed additional important information about the functional groups present in the fossil filaments (Fig. 4; table S1 for detailed assignments). First, the kerogenization of the fossil filaments is evidenced by aromatic bands at 1597 cm−1 (v C═C), 3070 cm−1 (v C─H), and 1270 cm−1
(C─O─C in aromatic ether/phenol groups) and by the strong
aliphatic signal with peaks at 2960 cm−1 (vas CH3), 2920 cm−1 (vas CH2),
2875 cm−1 (v
s CH2), and 2850 cm−1 (vs CH3), and at lower wave
numbers 1458 cm−1, 1408 cm−1 (as and s in CH2), and, finally,
727 cm−1, the latter being indicative of (CH
2)n polymethylenic chains
with n > 4. As kerogen matures, aromaticity tends to increase relative to the aliphatic character with fully aromatic, pure graphite being the ultimate end member of this process. Here, the transformation into graphite is far from complete as the aliphatic vibrations are still preeminent. As for the formation of those long aliphatic chains, it has been extensively studied in fossil and thermally matured cuticle of arthropods (22), which are made of a similar protein-chitin complex than fungal cell wall. With time, this structural assemblage is altered by the breaking of ester, amide, and glycosidic bonds, hence pro-ducing free aliphatic groups and unsaturated carbon that then polymerize into long polymethylenic chains (32, 33). Aliphatic molecules associated with vestigial chitin would then create a hydro-phobic, protective barrier against microbial or aqueous thermolytic degradation and may explain the excellent preservation of these organic remains (32, 34). In our case, even though the aliphatic signal is strong, the degradation of this protein-chitin complex into aliphatic compounds appears incomplete as we found sharp vibra-tions characteristic of amide at 3286 and 3070 cm−1 and especially at
1651 and 1540 cm−1, which are assigned respectively to amide A (v N─H), amide B and amide I (v C═O), amide II ( N─H). As for carbohydrates (usually between 950 and 1200 cm−1), they are depleted; however, we were still able to detect a pyranose peak (v C─C and vas
C─O) at 1170 cm−1. The fact that, in addition to the aromatic and aliphatic vibrations, amide and pyranose peaks are present is a testimony of the exceptional preservation of those filamentous re-mains. So far, the oldest fossil exhibiting organic remains other than kerogens was a Vauxia gracilenta sponge (505 Ma), in which vestigial chitin was identified (24). Our SR-FTIR data for the fossil filament are remarkably close to those reported for V. gracilenta (fig. S5 and table S1 for the respective peak positions), which supports the notion that vestiges of chitin are present (in line with the positive WGA-FITC staining). SR-FTIR spectra of the fossil filament differ, how-ever, from pure chitin (fig. S5). This is to be expected, because the precursor organic matter (i.e., fungal cell walls) of the fossil filaments contained not only chitin but also large amounts of phospholipids, proteins, and glucans. The latter together with the carbohydrate moieties of chitin were likely preferentially degraded, and thus, it appears logical to find carbohydrate bands to be almost absent in the SR-FTIR spectra of the fossil filament (apart from pyranose
vibrations at 1171 cm−1; Fig. 4 and fig. S5). With respect to amide I
and II vibrations, there is a good match with those of pure chitin— usually 1650 to 1660 cm−1 and 1550 to 1560 cm−1, respectively.
Together, those SR-FTIR data revealed that the fossil filament is
made of partially kerogenized organic matter, which exhibits vibra-tion bands consistent with vestigial “chitin,” hence supporting our previous positive WGA-FTIC staining essay.
Carbon and nitrogen speciation
Ultrathin sections of filaments were sampled perpendicularly across the filament by focused ion beam (FIB) milling (see Fig. 1D for localization and fig. S6 for detailed views) and analyzed by x-ray absorption near-edge structure (XANES) spectroscopy at the carbon and nitrogen K-edge. Synchrotron XANES analyses is an excellent nondestructive and direct method for quantifying speciation and bonding in organic molecules in organic-rich fossils. Recently, XANES
on September 17, 2020
http://advances.sciencemag.org/
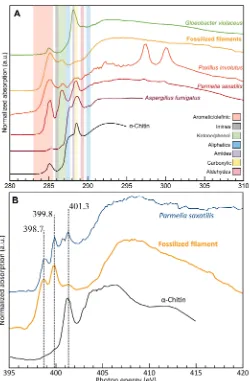
was used to detect chitin remnants in V. gracilenta (24) and to show that organic matter compositional heterogeneity (e.g., prokaryotic versus eukaryotic microorganism) can be maintained throughout pressure and temperature typically encountered during diagenesis (up to 250°C and 250 bars). Here, through deconvolution of our C-XANES (Fig. 6A and fig. S7), in the fossil filament we detected two characteristic peaks of -chitin at 285.1 eV (C═C 1 s-* transition in aromatic carbon) and at 288.6 eV (1 s-* transition of amide carbonyl and C─N bonds). Compared with pure chitin, the strengthening of the aromatic carbon peak (285.1 eV) and the occurrence of two additional features in the filament spectra (286.7 eV C═O/C═N bonds and 287.5 eV for aliphatic carbon) are consistent with the SR-FTIR results and illustrate the incomplete microbial degrada-tion, the subsequent dehydration/heating processes of the advanced diagenesis, and the resulting kerogenization of the fossil filament. For instance, the presence of a ketone peak (286.7 eV C═O/C═N; Fig. 6 and fig. S7) indicates the dehydration/heating of polysaccharide moieties in chitin and glucans of the fungal cell wall (33). The selec-tive degradation and the ensuing burial experienced by the fossil filament are also evidenced by the low levels of N in the fossil fila-ments: C:N ratio varies from 50 to 199 versus 5 to 30 in fresh fungi. Still, our N-XANES data confirmed the presence of amydil N with a peak at 401.3 eV that corresponds to the main spectral feature of chitin (32) on the nitrogen K-edge (Fig. 6B). Other peaks are also present in the N-XANES, at 398.7 and 399.7 eV, which are associated with pyridine and its derivatives (35). Those compounds were pre-viously detected in Carboniferous and Silurian arthropod cuticles (32) and were shown to form when chitinous tissues were subjected, experimentally, to temperatures and pressures typical of advanced diagenesis (34). Those pyridine peaks (398.7 and 399.7 eV) in addi-tion to the amide peak (401.3 eV) were also found in the N-XANES
of fungal hypha from the lichen Parmelia saxatalis (Fig. 6B). When compared with other modern fungal species, the C- and N-XANES of our fossil filaments exhibit the same trend than when it is com-pared with chitin, i.e., more intense aromatic/olefinic and imine/ ketone/phenolic peaks (at 285.1/398.8 to 399.9 eV and 286 to 287.2 eV) and reduced amide/carboxylic peaks (at 288.6 eV/401.3 eV). Equivalent C- and N-XANES trends were observed in a recent experimental study (36) simulating burial-induced maturation of various modern microorganisms during advanced diagenesis. This difference in C-XANES is particularly marked for Aspergillus fumigatus, but also visible C-XANES of Paxillus involutus and for P. saxatalis although to a lesser extent (Fig. 6A). Those two fungal species exhibit significant aromatic/olefinic peaks and generally have C-XANES spectra close to one of our fossil filaments with common absorption peaks centered at ~285, 286.7, and 288.6 eV. As an element of comparison, cyanobacteria Gloeobacter violaceus have distinctive C- and N-XANES (25) with sharp amide peaks at 288.1 and 401.3 eV, a moderate aromatic peak at 285 eV, and a shoulder for aldehydes at 289.4 eV, which differ markedly from fungal and fossil filament XANES spectra (Fig. 6). Although not directly diagnostic, the fossil filaments exhibit C- and N-XANES spectral features consistent with the presence of ves-tigial chitin and also share some similarities with modern fungal species.
Syngeneticity of the fossil filaments
The question naturally arises as to when these filamentous networks formed relative to their host rocks. We did not detect any living fungal cells or fresh fungal organic matter, which precludes recent contamina-tion. Rather, we showed that filamentous organic matter has undergone partial kerogenization as a result of advanced diagenesis, which suggests burial over geological time scales. We also found that all organic matter found in the BI-BII groups of MMS, i.e., asphaltite (27), dolomitic shale organic matter (in the vicinity of filamentous net-works), and fossil assemblages (37) including our fossil filaments, exhibit the same range of Raman peak temperature of 150° to 250°C, indicating a common thermal exposure. Further, in several ultrathin FIB sections, we detected paragenetic jarosite [KFe3+3(OH)6(SO4)2],
quartz around the filament (fig. S6). Alunite [KAl3(SO4)2(OH)6] was
also identified within fossil filaments (not shown). Those phases are likely related to evaporite-leaching fluid circulation induced by the Lufilian orogen (~560 to 480 Ma) (38). This important compres-sional event is known to have been the cause of large sulfur mineral-ization events in the Katangan Basin (southeast of the SMMLL Basin) and also that such mineralization was related to thermo-chemical (280° to 390°C) sulfate reduction of evaporite-leaching fluid (38). This upward fluid migration in the adjacent SMMLL Basin is evidenced by anhydrite (CaSO4) in faults in the BIIb/d as
well as by gypsum in BIe2 (16). This fluid circulation would explain the occurrence of jarosite/alunite as well as the thermal maturation (150° to 250°C) of the fossil filaments. Thus, on the basis of paragenetic mineralization alone, a minimum Cambrian-Ordovician age can be inferred. Furthermore, the fungal filaments were not restricted to cracks or voids and not related to tunneling—a known feature of fungal endolithic colonization. In addition, a previous study (20) that sampled in close vicinity to our dolomitic shale in the BIIc8 level also described similar cylindrical, septated filaments (obtained as palynomorph via acidic maceration). Thus, we consider the fossil filament described here as syngenetic, with the host dolomitic shale rock formed ca. 810 to 715 Ma ago.
Fig. 4. Synchrotron-FTIR (average over 31 10 by 10–m areas) of fragments of fossilized filaments illustrated in Fig. 1E. Assignments of absorption bands
and vibration modes ( = deformation; = stretching; s = symmetric; as = asymmetric) are indicated in parentheses (see table S1 for full details). Note the strong contributions of amide functional groups (at 1650, 1540, and 3286 cm−1) and aliphatic CH2 and
CH3 moieties in the 2800 to 3000 cm−1 region, which is also evidenced by the presence
of 727 cm−1 peak indicating long (CH2)n chains with n ≥ 4. (Inset) Detail of the 2800 to
3000 cm−1 spectral region used to calculate the branching index (i.e., R3/2—the
relative ratio of CH3 to CH2 carbon molecules) based on the intensity of their respective
asymmetric stretching.
on September 17, 2020
http://advances.sciencemag.org/
Fig. 5. Combined FTIR and Raman biosignatures of fungi microfossils. (A) Plots of the FTIR parameter R3/2 versus Raman parameter I(1350)/I(1600) of fossilized fil-ament from MMS (red) and comparison to eukaryotic (green) and prokaryotic (blue) fossils from previous studies (29–31). Within the Rhynie chert plant fossils, several regions were measured including cell wall, epiderm, protoplasm, and extracellular carbon. Our fossilized filaments fall close to the protoplasm of plants. The colored areas provide possible discrimination between eukaryote and prokaryote fossils based on their respective organic matter R3/2 and I(1350)/I(1600). The average values with SDs are plotted. (B) Box-and-whisker plot of the R3/2 ratio of a range of modern organisms spanning across the three domains of life [data for eukaryotes, prokaryotes, and Archaea are from (46, 47)]. R3/2 ratio quantifies the extent of branching and length of aliphatic moieties of the precursor membrane and can be used as a domain-specific proxy. As fossilization proceeds, it seems that the R3/2 values tend to decline (47), which also seem to be the case here for fungi. *Note that “Extant fungi” values were calculated from the FTIR spectra (48–51) of Rhizopus sp., Motierella alpina, Mucor circinelloides, Paxillus involutus, Aspergillus nidulans, Neurospora sp., Penicillium glabrum, and Umbelopsis isabellina.
on September 17, 2020
http://advances.sciencemag.org/
DISCUSSION
We report the presence of ancient fungal filaments and mycelium- like structures preserved in a Neoproterozoic dolomitic shale (ca. 810 and 715 Ma). This discovery proves definitively that filaments, found earlier in (20), which were later reassessed as cyanobacterial tubular sheaths, were in fact remains of fungal origin. Hence, this finding extends the record of fungi fossils by more than 250 Ma with respect to previously reported oldest fungi fossil dating from the mid-
Ordovician (460 to 55 Ma). Considering that our study merged sev-eral complementary, in situ, and spatially resolved molecular iden-tifications by confocal Raman (Fig. 3), synchrotron-FTIR (Figs. 4
and 5 and fig. S5 and table S1), staining (Fig. 2), and XANES (Fig. 6), we contend that the identification of chitin biosignatures in our sam-ples is, by far, more comprehensive than the evidence reported (10) recently, where only FTIR was used. In our study, confocal laser
scanning fluorescence microscopy was instrumental in demonstrating the presence of vestigial chitin and the occurrence of key fungal fea-tures such as septa and anastomosing filaments in those mycelium- like structures. Taking advantage of the unique sensitivity and spatial
resolution of synchrotron-based FTIR, XANES, and Raman
spectroscopy, the present study revealed that the molecular bio-signature of the filamentous fossils has been exceptionally preserved despite their 715- to 810-Ma-long geological history. We believe that with the early cementation and burial in a shale rock rela-tively rich in organic matter (presumably preventing oxidative degradation) and a rather low peak-temperature (150° to 250°C), the fossil filaments have benefited from a very favorable pres-ervation context over time scales. This exceptional prespres-ervation made possible a whole range of chemical characterizations.
Although the width of the filament (Fig. 1E) is consistent with either fungal or filamentous prokaryotic precursors, we could infer that these remains had most likely a eukaryotic origin by combining SR-FTIR with Raman spectral signatures (Fig. 5). We further
showed that despite a kerogenization process evidenced by intense aromatic signals and a low C:N ratio (50–199), the fossil filaments exhibit SR-FTIR, C-XANES, and N-XANES spectra sharing sig-nificant similarities with modern fungal species and chitinous fossil such as V. gracilenta and that they are not similar to typical pro-karyotic microbes. We could even detect amide functional groups (C-XANES absorption at 288.2 eV, N-XANES at 401.3 eV, and FTIR bands at 1651 and 1540 cm−1) that were likely to be involved in the cell wall protein-chitin complex synthesized by the once living fungi— hence confirming our positive WGA-FITC staining of vestigial chitin by confocal laser scanning fluorescence microscopy. On the basis of the combined evidence of presence of vestigial chitin, eukaryotic nature, syngenecity, size, and morphology, the filaments and mycelium-like structures are identified as the fossilized remnants of fungal networks.
In our view, the observed septation of the hypha does not indicate a dikaryan affinity, which appears unlikely considering the Neoproterozoic age of the remains and the much later timing of the Dikarya evolution (Basidiomycota and Ascomycota). Instead, the low frequency of the septation and also the presence of incomplete septa (pseudosepta) in the fossil filaments resemble more Blastocladiomycota hypha (39). This basal phylum regroups parasitic or saprotroph fungal species and is found in both aquatic and terrestrial environments. Hence, considering the very shallow, periodically subaerially exposed, lacustrine nature of the upper BIIc paleoenvironment where the fungal remains were discovered, one may hypothesize that those fungi were in asso-ciation with (either parasitic or symbiotic) or decomposers of an early photosynthetic community in transition toward terrestrial life (40). Ephemeral ponds, with their frequent wet-drying cycles (e.g., along the shores), might have been favorable environments for physical interactions between fungi and algae. Those early associa-tions with photosynthetic organisms were presumably restricted to free living, and possibly lichenized, green algae or cyanobacteria (9), which may have represented a primitive form of cryptogamic cover Fig. 6. X-ray absorption near edge spectroscopy at the C and N K-edge performed
on FIB foil 4984. (A) Compilation of C-XANES spectra for a range of modern fungi
(Paxillus involutus and Aspergillus fumigatus), fungal hypha in lichen (Parmelia saxatalis), cyanobacteria (Gloeobacter violaceus) (36), -chitin, and fossil filament (FIB foil #4984; fig. S7 for detailed views). The colored bands denote the energy range for which various C functional groups are expected (see table S2). For the fossilized filament, the main peaks are centered at 285.1 eV (aromatic C═C), 286.7 (ketone and phenol C), and a shoulder in amide and carboxylic energy bands (288 to 288.7 eV). A complete deconvolution of the C-edge for fossilized filament was performed (fig. S7). Note that for P. involutus, the XANES was acquired on the FIB section at the interface between fungi and biotite; the double peak between 297 and 300 eV are, thus, absorption peaks for potassium. (B) N-XANES spectra of fossilized filament, fungal hypha in
Parmelia saxatalis, and -chitin (32). The fossilized filament exhibits spectral features at 398.7 (imine), at 399.8 eV related to pyridine (35), and a shoulder at 401.3 eV, which corresponds well with the main spectral feature of the -chitin (N 1 s-3p/* transition in amide). Note that all those features are visible in the spectra of P. saxatalis.
on September 17, 2020
http://advances.sciencemag.org/
(41). Although no such symbiotic relationships have been observed directly here, it is worth noting that the upper BIIc shale beds, in addition to fungal remains, exhibit an abundant and diverse assem-blage of microfossils including 11 eukaryotic, acantomorph, presum-ably algal species (15). Hence, our study represents the oldest, documented fungi to date and pushes well into the Neoproterozoic the possibility that fungi helped to colonize land surface, almost 300 Ma before the first evidence of land plants. Overall, our discoveries also lend support to previous assumptions regarding the role of fungi in land colonization and, by extension, on the evolution of Earth’s biogeochemical cycles (40, 42). Neoproterozoic soil development driven by early terrestrial biota has generated increasing amounts of pedogenic clay minerals that helped to stabilize organic matter and enhanced carbon burial, which, in turn, contributed to the stepwise oxygenation of the Late Precambrian.
MATERIALS AND METHODS
The dolomitic shale sample (BK457b, 118.2 m, core 118/4) from BIIc8 was cut to produce three petrographic, noncovered thin sections, of which one showed five areas where mycelia were apparent. The sections were studied using light microscopy, scanning electron microscopy (SEM), chitin staining with WGA-FITC with fluorescence micros-copy, and SR-FTIR. Furthermore, nine FIB foils were sampled to be analyzed by synchrotron–XANES spectroscopy and by analytical transmission electron microscopy (TEM).
Scanning electron microscopy
The images in Fig. 1 and figs. S1 and S6A were obtained with an Ultra55 Field Emission Gun-SEM (Zeiss), operated at 2.00-kV accelerating voltage. The samples were uncoated.
Confocal Raman imaging spectroscopy
Raman spectra and images were collected using a Witec -Scanning Near-Field Optical Microscope customized to incorporate confocal Raman spectroscopic imaging. The excitation source was a frequency- doubled solid-state yttrium-aluminum-garnet (YAG) laser (532 nm) operating between 0.3- and 1-mW output power (dependent on objective), as measured at the sample using a laser power meter. Objective lenses used included a ×100 long working distance (LWD) and a ×20 LWD with a 50-m optical fiber acting as the confocal
pin hole. Spectra were collected on a Peltier-cooled Andor EMCCD (electron multiplying charge-coupled device) chip after passing through an f/4 300-mm focal length imaging spectrometer typically using a 600 lines/mm grating. The lateral resolution of the instrument was as small as 360 nm in air when using the ×100 LWD objective, with a focal plane depth of ~800 nm.
Typically, 2D imaging and single spectra modes were used during this study. Single-spectrum mode allowed the acquisition of a spectrum from a single spot on the target. Average spectra were produced typically using integration times of 30 s per accumulation and 10 accumulations to allow verification of weak spectral fea-tures. Target areas were identified on the thin section in reflected light. The height and width of the field of interest within the light microscopy image were then measured and divided by the lateral resolution of the lens being used to give the number of pixels per line. The instrument then took a Raman spectrum (0 to 3600 cm−1 using the 600 lines/mm grating) at each pixel using an integration time of between 1 s per pixel.
A cosmic ray reduction routine was used to reduce the effects of stray radiation on Raman images, as was image thresholding to reject isolated bright pixels. Fluorescence effects were inhibited by the use of specific peak fitting in place of spectral area sums and by the confocal optics used in the instrument. The effects of interfering peaks were removed by phase masking routines based on multiple peak fits as compared with standardized mineral spectra. This prod-uces an average spectrum over the number of pixels chosen in the area of interest. Peak center maps were produced by using a Gaussian fit to the G band and then confirmed by taking representative spectra from the range of peak centers as seen in Fig. 3.
Confocal laser scanning fluorescence microscopy
The incubation with WGA-FITC lasted for 1 hour. The concentra-tion of the WGA-FITC in the incubaconcentra-tion medium was 80 g ml−1
WGA-FITC in 10 mM phosphate buffer at pH 7.8. After incubation, the samples were thoroughly washed with MilliQ water. Confocal fluorescence imaging was realized on a Zeiss LSM-7 10 confocal microscope using both Zeiss ×2 0/0 8 PlanApochromat and Zeiss ×63/1.4 PlanApochromat objectives and with specific excitation using a 488-nm Argon ion laser. Fluorescence detection was realized using a 500 to 550 bandpass emission filter and the Zeiss Airyscan GaAsP detector to increase signal-to-noise ratio and resolution. Images were acquired using the Zeiss ZenBlack software (Zeiss, Oberkochen, Germany). Fluorescence images of the BK233 sample were done on a Zeiss AxioObserver Z1 widefield microscope using a Zeiss ×20/0.8 PlanApochromat objective and a 493-nm light-emitting diode excitation. Detection was done on a Hamamatsu Flash4.0 sCMOS camera with a 1.5-s exposure time. Image adjustments (i.e., brightness and contrast) and Z projections were done using Fiji soft-ware (43).
Synchrotron radiation–FTIR
The FTIR measurements were all done at the beamline B22 at Diamond Light Source (UK). All measurements were conducted in a transmission mode with the samples—fragments of filamentous network—manually deposited on CaF2 slides. We used the Hyperion
3000 SR-FTIR setup to analyze our sample with the 36× objective. Usually, 512 or 1024 scans were accumulated at a resolution of 4 cm−1 between 500 and 4000 cm−1 (later cut between 1000 and
3500 cm−1) and generally with a 10 × 10–m aperture. Spectra were
then baseline corrected using the concave rubber band routine in OPUS Spectroscopy software (Bruker).
Ion milling by FIB
Nine ultrathin foils, typically 15 x 7 x 0.15 m, were sampled from various filamentous networks using an FIB single-beam instrument (FEI FIB 200 TEM) at the German Research Centre for Geosciences Potsdam following the procedure described in (44). This ion milling procedure maintained textural and chemical integrity even in the case of sensitive materials. Milling was conducted at low-gallium ion currents to minimize gallium implantation or redeposition of the sputtered materials on the sample surface and to prevent significant changes in the speciation of complex carbon-based polymers.
X-ray absorption near-edge structure spectroscopy
All XANES measurements were all done at the I08-SXM beamline at the Diamond Light Source (UK). Collection of XANES spectra at the C (from 280 to 310 eV) and N (from 395 to 420 eV) K-edges
on September 17, 2020
http://advances.sciencemag.org/
were performed on all nine FIB foils. Using a Fresnel zone plate, monochromatic x-rays were focused on the sample. To collect 2D images, the sample was raster scanned, and the transmitted x-rays were detected with a photo diode at a fixed energy with a spot size of 50 nm using a dwell time of 3 ms per energy step per pixel. Combining the images from each energy step (0.1 eV in fine regions or 0.5 eV in pre- or postedge) produced 3D image “stacks” of x-ray absorption of the FIB foils after the normalization with the incident x-ray intensity. All subsequent XANES data processing was performed by MANTiS (45), and deconvolution was done using MagicPlot Pro.
High-resolution TEM
TEM was performed on FIB foils at the GFZ Potsdam using an FEI Tecnai G2 F20 X-Twin microscope equipped with a Gatan imaging filter 5GIF Tridiem for acquisition of energy-filtered images, an EDAY x-ray analyzer with an ultrathin window, and a Fischione high-angle annular dark-field detector (HAADF) allowing imaging (by Z-contrast) in the scanning transmission electron microscopy (STEM) mode. The system was operated at 200 kV with a field emission gun electron source. Energy-dispersive x-ray analysis in a scanning transmission mode (STEM) was applied. Electron energy loss spectroscopy (EELS) analysis was used to derive C:N ratio values in FIB foil.
SUPPLEMENTARY MATERIALS
Supplementary material for this article is available at http://advances.sciencemag.org/cgi/ content/full/6/4/eaax7599/DC1
Paleoenvironment and petrography of the BIIc subgroup Fig. S1. High-resolution SEM micrographs of the mycelial networks. Fig. S2. Geological map of the SMMLL Basin and synthetic stratigraphic and chemostratigraphic column of the MMS.
Fig. S3. Optical micrographs of petrographic thin sections cut at the depth or in close vicinity of the fossiliferous sediment in BIIc8 (15) (BK 457b, 118.2 m) showing subaerial exposure feature and little to no compaction of fossiliferous dolomitic shale.
Fig. S4. Fluorescence micrographs of thin sections in the BIIc6 shale bed (controls of WGA-FITC staining specificity).
Fig. S5. Comparison of FTIR spectra of fossil filaments, cyanobacteria, extant fungi, fossil sponge V. gracilenta, and -chitin.
Fig. S6. SEM, TEM (HAADF) micrographs, and elemental (STEM-EDS) and mineralogical analyses (selected-area electron diffraction) on FIB foil #4984 sampled collected fossil filament and associated paragenetic mineral phases.
Fig. S7. Deconvolution of the C-XANES edge for fossil filament FIB foil #4984. Table S1. FTIR assignments based on the following references.
Table S2. Peaks detected in XANES at the C and N 1s edges and used for the deconvolution in fig. S7.
References (52–58)
REFERENCES AND NOTES
1. L. L. Taylor, S. A. Banwart, P. J. Valdes, J. R. Leake, D. J. Beerling, Evaluating the effects of terrestrial ecosystems, climate and carbon dioxide on weathering over geological time: A global-scale process-based approach. Philos. Trans. R. Soc. Lond. Ser. B Biol. Sci. 367, 565–582 (2012).
2. S. Bonneville, D. J. Morgan, A. Schmalenberger, A. Bray, A. Brown, S. A. Banwart, L. G. Benning, Tree-mycorrhiza symbiosis accelerate mineral weathering: Evidences from nanometer-scale elemental fluxes at the hypha–mineral interface.
Geochim. Cosmochim. Acta 75, 6988–7005 (2011).
3. M.-A. Selosse, C. Strullu-Derrien, Origins of the terrestrial flora: A symbiosis with fungi?
BIO Web Conf. 4, 00009 (2015).
4. M. L. Berbee, T. Y. James, C. Strullu-Derrien, Early Diverging Fungi: Diversity and Impact at the Dawn of Terrestrial Life. Annu. Rev. Microbiol. 71, 41–60 (2017).
5. D. F. Mark, C. M. Rice, N. H. Trewin, Discussion on ‘A high-precision U–Pb age constraint on the Rhynie Chert Konservat-Lagerstätte: time scale and other implications’.
J. Geol. Soc. Lond. 170, 701 (2013).
6. C. Strullu-Derrien, P. Kenrick, S. Pressel, J. G. Duckett, J.-P. Rioult, D.-G. Strullu, Fungal associations in Horneophyton ligneri from the Rhynie Chert (c. 407 million year old) closely
resemble those in extant lower land plants: novel insights into ancestral plant–fungus symbioses. New Phytol. 203, 964–979 (2014).
7. T. N. Taylor, M. Krings, E. L. Taylor, in Fossil Fungi (Academic Press, 2015), pp. 27–39; www.sciencedirect.com/science/article/pii/B9780123877314000037.
8. N. J. Butterfield, Probable Proterozoic fungi. Paleobiology 31, 165–182 (2005). 9. X. Yuan, S. Xiao, T. N. Taylor, Lichen-like symbiosis 600 millions years ago. Science 308,
1017–1020 (2005).
10. C. C. Loron, C. François, R. H. Rainbird, E. C. Turner, S. Borensztajn, E. J. Javaux, Early fungi from the Proterozoic era in Arctic Canada. Nature 570, 232–235 (2019).
11. T. N. Hermann, V. N. Podkovyrov, A discovery of riphean heterotrophs in the Lakhanda group of Siberia. Paleontol. J. 44, 374–383 (2010).
12. S. Bengtson, B. Rasmussen, M. Ivarsson, J. Muhling, C. Broman, F. Marone, M. Stampanoni, A. Bekker, Fungus-like mycelial fossils in 2.4-billion-year-old vesicular basalt. Nat. Ecol. Evol. 1, 0141 (2017).
13. F. Delpomdor, U. Linnemann, A. Boven, A. Gärtner, A. Travin, C. Blanpied, A. Virgone, H. Jelsma, A. Préat, Depositional age, provenance, and tectonic and paleoclimatic settings of the late Mesoproterozoic–middle Neoproterozoic Mbuji-Mayi Supergroup, Democratic Republic of Congo. Palaeogeogr. Palaeoclimatol. Palaeoecol. 389, 4–34 (2013).
14. D. A. Petrash, N. Gueneli, J. J. Brocks, J. A. Méndez-Dot, G. González-Arismendi, S. W. Poulton, K. O. Konhauser, Black shale deposition and early diagenetic dolomite cementation during Oceanic Anoxic Event 1: The mid-Cretaceous Maracaibo Platform, northwestern South America. Am. J. Sci. 316, 669–711 (2016).
15. B. K. Baludikay, J.-Y. Storme, C. François, D. Baudet, E. J. Javaux, A diverse and exquisitely preserved organic-walled microfossil assemblage from the Meso–Neoproterozoic Mbuji-Mayi Supergroup (Democratic Republic of Congo) and implications for Proterozoic biostratigraphy. Precambrian Res. 281, 166–184 (2016).
16. F. Delpomdor, C. Blanpied, A. Virgone, A. Préat, in Geology and Resource Potential of the
Congo Basin, M. J. de Wit, F. Guillocheau, M. C. J. de Wit, Eds. (Springer Berlin Heidelberg,
2015), pp. 59–76; http://link.springer.com/10.1007/978-3-642-29482-2_4. 17. F. Delpomdor, C. Blanpied, A. Virgone, A. Préat, Paleoenvironments in Meso–
Neoproterozoic carbonates of the Mbuji-Mayi Supergroup (Democratic Republic of Congo) – Microfacies analysis combined with C–O–Sr isotopes, major-trace elements and REE+Y distributions. J. Afr. Earth Sci. 88, 72–100 (2013).
18. L. Cahen, Le système de la Bushimaie au Katanga. Bull. Société Belge Géologie Hydrol.
Paléontol. 56, 217–253 (1947).
19. M. Ivarsson, S. Bengtson, V. Belivanova, M. Stampanoni, F. Marone, A. Tehler, Fossilized fungi in subseafloor Eocene basalts. Geology 40, 163–166 (2012).
20. P. K. Maithy, Micro-organisms from the Bushimay system (Late Precambrian) of Kanshi, Zaire.
Paleobotanist 22, 133–149 (1973).
21. C. V. Mendelson, J. W. Schopf, in The Proterozoic Biosphere: A Multidisciplinary Study, J. W. Schopf, C. Klein, Eds. (Cambridge Univ. Press, 1992), p. 1348.
22. B. A. Stankiewicz, D. E. Briggs, R. P. Evershed, M. B. Flannery, M. Wuttke, Preservation of chitin in 25-million-year-old fossils. Science 276, 1541–1543 (1997).
23. M. Speranza, C. Ascaso, X. Delclos, E. Penalver, Cretaceous mycelia preserving fungal polysaccharides: Taphonomic and paleoecological potential of microorganisms preserved in fossil resins. Geol. Acta 13, 363–385 (2015).
24. H. Ehrlich, J. K. Rigby, J. P. Botting, M. V. Tsurkan, C. Werner, P. Schwille, Z. Petrášek, A. Pisera, P. Simon, V. N. Sivkov, D. V. Vyalikh, S. L. Molodtsov, D. Kurek, M. Kammer, S. Hunoldt, R. Born, D. Stawski, A. Steinhof, V. V. Bazhenov, T. Geisler, Discovery of 505-million-year old chitin in the basal demosponge Vauxia gracilenta. Sci. Rep. 3, 3497 (2013).
25. J. Alleon, S. Bernard, C. Le Guillou, J. Marin-Carbonne, S. Pont, O. Beyssac, K. D. McKeegan, F. Robert, Molecular preservation of 1.88 Ga Gunflint organic microfossils as a function of temperature and mineralogy. Nat. Commun. 7, 11977 (2016).
26. Y. Kouketsu, T. Mizukami, H. Mori, S. Endo, M. Aoya, H. Hara, D. Nakamura, S. Wallis, A new approach to develop the Raman carbonaceous material geothermometer for low-grade metamorphism using peak width: Raman CM geothermometer using FWHM. Island Arc 23, 33–50 (2014).
27. F. Delpomdor, S. Bonneville, K. Baert, A. Préat, An introduction to the precambrian petroleum system in the Sankuru-Mbuji-Mayi-Lomami-Lovoy basin, south-central Democratic Republic of Congo. J. Pet. Geol. 41, 5–27 (2018).
28. S. Deguchi, K. Tsujii, K. Horikoshi, In situ microscopic observation of chitin and fungal cells with chitinous cell walls in hydrothermal conditions. Sci. Rep. 5, 11907 (2015).
29. Y. Qu, A. Engdahl, S. Zhu, V. Vajda, N. McLoughlin, Ultrastructural heterogeneity of carbonaceous material in ancient cherts: Investigating biosignature origin and preservation. Astrobiology 15, 825–842 (2015).
30. Y. Qu, S. Zhu, M. Whitehouse, A. Engdahl, N. McLoughlin, Carbonaceous biosignatures of the earliest putative macroscopic multicellular eukaryotes from 1630 Ma Tuanshanzi Formation, north China. Precambrian Res. 304, 99–109 (2018).
on September 17, 2020
http://advances.sciencemag.org/
31. M. Igisu, Y. Ueno, M. Shimojima, S. Nakashima, S. M. Awramik, H. Ohta, S. Maruyama, Micro-FTIR spectroscopic signatures of Bacterial lipids in Proterozoic microfossils.
Precambrian Res. 173, 19–26 (2009).
32. G. D. Cody, N. S. Gupta, D. E. G. Briggs, A. L. D. Kilcoyne, R. E. Summons, F. Kenig, R. E. Plotnick, A. C. Scott, Molecular signature of chitin-protein complex in Paleozoic arthropods. Geology 39, 255–258 (2011).
33. G. D. Cody, J. Brandes, C. Jacobsen, S. Wirick, Soft X-ray induced chemical modification of polysaccharides in vascular plant cell walls. J. Electron Spectrosc. Relat. Phenom. 170, 57–64 (2009).
34. N. S. Gupta, in Chitin, N. S. Gupta, Ed. (Springer Netherlands, 2011), vol. 34, pp. 153–168; http://link.springer.com/10.1007/978-90-481-9684-5_8.
35. S. Mitra-Kirtley, O. C. Mullins, J. Van Elp, S. J. George, J. Chen, S. P. Cramer, Determination of the nitrogen chemical structures in petroleum asphaltenes using XANES spectroscopy.
J. Am. Chem. Soc. 115, 252–258 (1993).
36. J. Alleon, S. Bernard, C. Le Guillou, D. Daval, F. Skouri-Panet, M. Kuga, F. Robert, Organic molecular heterogeneities can withstand diagenesis. Sci. Rep. 7, 1508 (2017). 37. B. K. Baludikay, C. François, M. C. Sforna, J. Beghin, Y. Cornet, J.-Y. Storme, N. Fagel,
F. Fontaine, R. Littke, D. Baudet, D. Delvaux, E. J. Javaux, Raman microspectroscopy, bitumen reflectance and illite crystallinity scale: comparison of different geothermometry methods on fossiliferous Proterozoic sedimentary basins (DR Congo, Mauritania and Australia). Int. J. Coal Geol. 191, 80–94 (2018).
38. W. Heijlen, D. A. Banks, P. Muchez, B. M. Stensgard, B. W. D. Yardley, The nature of mineralizing fluids of the Kipushi Zn-Cu deposit, Katanga, Democratic Repubic of Congo: Quantitative fluid inclusion analysis using laser ablation ICP-MS and bulk crush-leach methods. Econ. Geol. 103, 1459–1482 (2008).
39. R. J. Meyer, M. S. Fuller, Structure and development of hyphal septa in Allomyces.
Am. J. Bot. 72, 1458–1465 (1985).
40. L. P. Knauth, M. J. Kennedy, The late Precambrian greening of the Earth. Nature 460, 728–732 (2009).
41. J. de Vries, J. M. Archibald, Plant evolution: Landmarks on the path to terrestrial life.
New Phytol. 217, 1428–1434 (2018).
42. M. Kennedy, M. Droser, L. M. Mayer, D. Pevear, D. Mrofka, Late precambrian oxygenation; inception of the clay mineral factory. Science 311, 1446–1449 (2006).
43. J. Schindelin, I. Arganda-Carreras, E. Frise, V. Kaynig, M. Longair, T. Pietzsch, S. Preibisch, C. Rueden, S. Saalfeld, B. Schmid, J.-Y. Tinevez, D. J. White, V. Hartenstein, K. Eliceiri, P. Tomancak, A. Cardona, Fiji: an open-source platform for biological-image analysis.
Nat. Methods 9, 676–682 (2012).
44. R. Wirth, Focused Ion Beam (FIB) combined with SEM and TEM: Advanced analytical tools for studies of chemical composition, microstructure and crystal structure in geomaterials on a nanometre scale. Chem. Geol. 261, 217–229 (2009).
45. M. Lerotic, R. Mak, S. Wirick, F. Meirer, C. Jacobsen, MANTiS: a program for the analysis of X-ray spectromicroscopy data. J. Synchrotron Radiat. 21, 1206–1212 (2014). 46. M. Igisu, S. Nakashima, Y. Ueno, S. M. Awramik, S. Maruyama, In situ Infrared
Microspectroscopy of ∼850 Million-Year-Old Prokaryotic Fossils. Appl. Spectrosc. 60, 1111–1120 (2006).
47. M. Igisu, T. Yokoyama, Y. Ueno, S. Nakashima, M. Shimojima, H. Ohta, S. Maruyama, Changes of aliphatic C–H bonds in cyanobacteria during experimental thermal maturation in the presence or absence of silica as evaluated by FTIR microspectroscopy.
Geobiology 16, 412–428 (2018).
48. A. Szeghalmi, S. Kaminskyj, K. M. Gough, A synchrotron FTIR microspectroscopy investigation of fungal hyphae grown under optimal and stressed conditions.
Anal. Bioanal. Chem. 387, 1779–1789 (2007).
49. K. Forfang, B. Zimmermann, G. Kosa, A. Kohler, V. Shapaval, FTIR spectroscopy for evaluation and monitoring of lipid extraction efficiency for oleaginous fungi.
PLOS ONE 12, e0170611 (2017).
50. M. Kardas, A. G. Gozen, F. Severcan, FTIR spectroscopy offers hints towards widespread molecular changes in cobalt-acclimated freshwater bacteria. Aquat. Toxicol. 155, 15–23 (2014).
51. J. J. Ojeda, M. E. Romero-González, S. A. Banwart, Analysis of Bacteria on Steel Surfaces Using Reflectance Micro-Fourier Transform Infrared Spectroscopy. Anal. Chem. 81, 6467–6473 (2009).
52. F. Delpomdor, A. Préat, Early and late Neoproterozoic C, O and Sr isotope chemostratigraphy in the carbonates of West Congo and Mbuji-Mayi supergroups: A preserved marine signature? Palaeogeogr. Palaeoclimatol. Palaeoecol. 389, 35–47 (2013). 53. L. G. Benning, V. R. Phoenix, N. Yee, M. J. Tobin, Molecular characterization
of cyanobacterial silicification using synchrotron infrared micro-spectroscopy.
Geochim. Cosmochim. Acta 68, 729–741 (2004).
54. M. Rinaudo, Chitin and chitosan: Properties and applications. Prog. Polym. Sci. 31, 603–632 (2006).
55. Y.-C. Lee, C.-C. Chiang, P.-Y. Huang, C.-Y. Chung, T. D. Huang, C.-C. Wang, C.-I. Chen, R.-S. Chang, C.-H. Liao, R. R. Reisz, Evidence of preserved collagen in an Early Jurassic sauropodomorph dinosaur revealed by synchrotron FTIR microspectroscopy.
Nat. Commun. 8, 14220 (2017).
56. V. Bobroff, H.-H. Chen, S. Javerzat, C. Petibois, What can infrared spectroscopy do for characterizing organic remnant in fossils? Trends Anal. Chem. 82, 443–456 (2016). 57. P. Barré, A. F. Plante, L. Cécillon, S. Lutfalla, F. Baudin, S. Bernard, B. T. Christensen, T. Eglin,
J. M. Fernandez, S. Houot, T. Kätterer, C. Le Guillou, A. Macdonald, F. van Oort, C. Chenu, The energetic and chemical signatures of persistent soil organic matter. Biogeochemistry 130, 1–12 (2016).
58. O. Dhez, H. Ade, S. G. Urquhart, Calibrated NEXAFS spectra of some common polymers.
J. Electron Spectrosc. Relat. Phenom. 128, 85–96 (2003).
Acknowledgments: The Africa Museum (Tervuren, Belgium) is thanked for granting access to the Kanski drillcore. We thank Diamond Light Source and their beamline scientists for access to beamline B22 (SM15050) and I08 (SP14953) that contributed to the results presented here. K. Baert (Vrije Universiteit Brussel) and P. Madau (4MAT Department, Université Libre de Bruxelles) are acknowledged for help in the early stage of the study. C. Strullu-Derrien, N. McLoughlin, and three other anonymous referees are thanked for constructive reviews and S. Elrick (ISGS) for comments on the manuscript. Funding: This research was supported by the “Van Buren” funds from ULB and the Fonds National de la Recherche Scientifique (FRS-FNRS PDR T.1012.14). We also acknowledge the financial support of the Helmholtz Recruiting Initiative grant no. I-044-16-01 to L.G.B. Author contributions: S.B. directed the research and wrote the manuscript. R.W. did all TEM-related analysis, imaging, and interpretation. A.Sc. did the ion milling. S.B. and L.G.B. acquired and interpreted the FTIR dataset. C.C. performed the WGA staining. T.A., M.K., S.B., L.G.B., and A.St. acquired, data processed, and interpreted the XANES data. A.St. did the Raman analysis. F.D. and A.P. did the stratigraphy and
sedimentological analysis. All authors discussed the results and commented on the manuscript. Competing interests: The authors declare that they have no competing interests. Data and materials availability: All data needed to evaluate the conclusions in the paper are present in the paper and/or the Supplementary Materials. Additional data related to the paper may be requested from the authors. Correspondence and requests should be addressed to S.B.
Submitted 19 April 2019 Accepted 20 November 2019 Published 22 January 2020 10.1126/sciadv.aax7599
Citation: S. Bonneville, F. Delpomdor, A. Préat, C. Chevalier, T. Araki, M. Kazemian, A. Steele, A. Schreiber, R. Wirth, L. G. Benning, Molecular identification of fungi microfossils in a Neoproterozoic shale rock. Sci. Adv. 6, eaax7599 (2020).
on September 17, 2020
http://advances.sciencemag.org/
DOI: 10.1126/sciadv.aax7599 (4), eaax7599. 6
Sci Adv
ARTICLE TOOLS http://advances.sciencemag.org/content/6/4/eaax7599
MATERIALS
SUPPLEMENTARY http://advances.sciencemag.org/content/suppl/2020/01/17/6.4.eaax7599.DC1
REFERENCES
http://advances.sciencemag.org/content/6/4/eaax7599#BIBL
This article cites 54 articles, 8 of which you can access for free
PERMISSIONS http://www.sciencemag.org/help/reprints-and-permissions
Terms of Service
Use of this article is subject to the
is a registered trademark of AAAS. Science Advances
York Avenue NW, Washington, DC 20005. The title
(ISSN 2375-2548) is published by the American Association for the Advancement of Science, 1200 New Science Advances
License 4.0 (CC BY-NC).
Science. No claim to original U.S. Government Works. Distributed under a Creative Commons Attribution NonCommercial Copyright © 2020 The Authors, some rights reserved; exclusive licensee American Association for the Advancement of
on September 17, 2020
http://advances.sciencemag.org/


![Lexical access via a simple co occurrence network (Trouver les mots dans un simple réseau de co occurrences) [in French]](data:image/gif;base64,R0lGODlhAQABAIAAAP///wAAACH5BAEAAAAALAAAAAABAAEAAAICRAEAOw==)