C O M M E N T A R Y
Open Access
Biodiversity Conservation in the REDD
Gary D Paoli
1*, Philip L Wells
1, Erik Meijaard
2,3, Matthew J Struebig
4,5, Andrew J Marshall
6, Krystof Obidzinski
7,
Aseng Tan
8, Andjar Rafiastanto
8, Betsy Yaap
1, JW Ferry Slik
9, Alexandra Morel
10, Balu Perumal
11, Niels Wielaard
12,
Simon Husson
13, Laura D
’
Arcy
13Abstract
Deforestation and forest degradation in the tropics is a major source of global greenhouse gas (GHG) emissions.
The tropics also harbour more than half the world
’
s threatened species, raising the possibility that reducing GHG
emissions by curtailing tropical deforestation could provide substantial co-benefits for biodiversity conservation.
Here we explore the potential for such co-benefits in Indonesia, a leading source of GHG emissions from land
cover and land use change, and among the most species-rich countries in the world. We show that focal
ecosys-tems for interventions to reduce emissions from deforestation and forest degradation in Indonesia do not coincide
with areas supporting the most species-rich communities or highest concentration of threatened species. We
argue that inherent trade-offs among ecosystems in emission reduction potential, opportunity cost of foregone
development and biodiversity values will require a regulatory framework to balance emission reduction
interven-tions with biodiversity co-benefit targets. We discuss how such a regulatory framework might function, and caution
that pursuing emission reduction strategies without such a framework may undermine, not enhance, long-term
prospects for biodiversity conservation in the tropics.
Introduction
Carbon emissions from deforestation and forest
degrada-tion contribute 12-20% of anthropogenic global
green-house gas (GHG) emissions annually [1,2], primarily
from the tropics [3]. Tropical countries also harbour over
half (51.1%) of the world
’
s 48,170 threatened species [4],
raising the possibility that reducing GHG emissions by
curtailing tropical deforestation might also provide
valu-able co-benefits for biodiversity conservation [5]. Here
we explore potential biodiversity impacts of anticipated
emission reduction strategies in Indonesia, the world
’
s
third largest source of GHG emissions [6] and among the
most species-rich countries in the world. We address
calls in this journal [7,8] and elsewhere [9-11] for a
stron-ger regulatory framework governing emission reduction
strategies in forests to ensure that biodiversity co-benefits
are achieved. We caution that in Indonesia and other
tro-pical countries, pursuing emission reduction strategies in
forests without such a framework may worsen, not
enhance, long-term biodiversity conservation.
The Reducing Emissions from forest Degradation and
Deforestation (REDD) scheme of the post-Kyoto UN
Framework Convention on Climate Change (UNFCCC)
treaty seeks to involve developing countries in global
GHG reduction efforts by creating financial incentives
to improve forest management and protection [12].
Under REDD, and its derivative REDD+, which
recog-nizes forest carbon stock enhancements (sequestration)
from improved conservation and sustainable
manage-ment of forests, developing countries that reduce forest
based emissions below an established
‘
business as usual
’
projection will be rewarded through payments from
donor funds or market sale of emission reduction
credits.
REDD clearly provides an opportunity for biodiverse,
carbon-rich tropical countries to protect threatened
bio-diversity as a co-benefit of maintaining forests and the
carbon they store [11,13]. However, it remains unclear
how biodiversity provisions will be included within
REDD, raising questions about the extent to which it will
improve biodiversity conservation over the long-term
[5,14,15]. Estimated terrestrial carbon and biodiversity
are positively correlated globally [11], but this pattern
does not necessarily hold at sub-national scales where
REDD will typically be implemented. This raises concern
* Correspondence: [email protected]1Daemeter Consulting, Bogor, Indonesia
Full list of author information is available at the end of the article
that preferential targeting of carbon-rich ecosystems may
intensify pressures on relatively carbon-poor ecosystems
that nevertheless support equal or greater levels of
biodiversity [15-17].
Discussion
REDD in Indonesia
Indonesia, where REDD will be pursued as a set of
sub-national programs, illustrates the need for explicit
biodi-versity provisions to ensure that biodibiodi-versity co-benefits
are achieved, and unanticipated negative outcomes are
avoided.
Indonesia is a rapidly growing developing country, with
economic growth of 4.5-6.3% annually over the past
three years [18] due in part to expanding natural resource
industries such as oil palm, fiber plantations and pulp.
Continued growth of these sectors is central to
govern-ment plans to expand exports and create jobs. The
Min-istry of Forestry recently announced a 10-year plan to
develop nine million ha of fiber plantations to supply a
two-fold expansion of pulp and paper capacity [19].
Simi-larly, up to 10 million ha of new oil palm plantations are
projected for development by 2020 to meet growing
demand for palm oil derived products [20,21]. Together,
these industries will require an estimated 19 million ha of
land for new plantations over the next 10 years.
Plantation expansion notwithstanding, Indonesia has
also made voluntary commitments to reduce emissions
by 26% by 2020, or up to 41% if financial support is
forthcoming from the international community [22].
Such commitments have drawn significant attention,
including a recent offer from Norway of US$1 billion to
Indonesia for assistance with implementing REDD [23],
and up to 45 REDD projects under development as of
early 2010 [24,25].
Sources of forest based emissions in Indonesia
Approximately 85% of Indonesia
’
s estimated 3.01 Gt
CO
2annual emissions in 2005 originated from
defores-tation and degradation [6]. The main sources of these
emissions are lowland dipterocarp forests on
well-drained mineral soils and peat swamp forest on
water-logged peatlands, with estimated original extent of
c. 128.1 million ha and c. 20.1 million ha, respectively
(Table 1). Estimated aboveground carbon is similar in
forests on mineral soils and peat (211 ± 55 vs. 230 ± 66
t C ha
-1, respectively, mean ± SD; Table 1, see
Addi-tional File 1: Datafile_1.xls for original data). However,
belowground carbon stocks differ markedly, with up to
c. 20 times more carbon in the un-decomposed organic
matter of peat compared to mineral soils (137 ± 26 vs
2425 ± 726 t C ha
-1; Table 1). Total carbon stocks are
thus, on average, eight times higher in lowland forests
on peat than on mineral soils, with corresponding
higher total estimated GHG emissions arising from their
conversion (Table 1).
Historically, deforestation rates on peat were much
lower than on mineral soils, reflecting higher costs,
lower yield and technological challenges of developing
peatlands [62]. From 1985-1997, relative losses of
low-land forest on mineral soils in Sumatra and Kalimantan
were nearly three times higher than forests on the
coastal alluvial plains dominated by peat (61% vs 24% in
Sumatra; 58% vs 23% in Kalimantan; data from [63]).
Increased use of technology, however, such as
excava-tors, coupled with expanding trade and rising demand
for land have stimulated large-scale drainage of forested
peatlands for transmigration projects and agricultural
development [64-66]. Drainage and resulting oxidation
of carbon-dense peat, combined with annual fires
[60,61], made peat the source of nearly half (45%, 1.35
Gt CO
2yr
-1) of Indonesia
’
s annual emissions, and 3% of
global emissions, in 2005 (Table 1; [6,67]). Further,
destructive synergies with extreme drought linked to El
Nino Southern Oscillation increase risk of catastrophic
fires, such as the 1997-98 peat land fires in Kalimantan
that caused emissions estimated to represent 13-40% of
global emissions originating from fossil fuels during that
period [68].
Reconciling plantation expansion with emissions
reduction
One option to expand plantations and meet emission
reduction targets in Indonesia would be to concentrate
new plantations on degraded, deforested land, of which
c. 23 million ha in critical condition were mapped across
Indonesia in 2006 [69]. Planting such
‘
degraded lands
’
has proven to be a challenge, however, due to the scarcity
of land meeting an ecologically and socially sound
defini-tion of degraded, and the fact that much deforested land
is in fact under some form of management by local
communities.
Unexpected outcomes for biodiversity
Tropical lowland forests on peat or mineral soils are
priority areas for biodiversity conservation, yet are
typi-cally underrepresented in protected area networks
rela-tive to upland habitats [72]. Greater protection of
Indonesian peatlands under REDD therefore would not
only achieve emission reductions, but also help conserve
a unique ecosystem that supports specialized aquatic
and plant biodiversity [73-76], and provides wilderness
habitat for some of Indonesia
’
s most endangered large
vertebrates, including Sumatran tigers, Asian elephants,
orangutan and false gharial [77-80]. Nevertheless, if
REDD is implemented with a disproportionate focus on
peat, and Indonesia pursues goals for 19 million ha of
new plantations over the next 10 years, then the
poten-tial for REDD to promote conservation for the majority
of Indonesia
’
s threatened species will not have been
realized. Worse yet, REDD could effectively increase
pressure to convert lowland mineral forest areas. This
will severely limit biodiversity co-benefits of REDD in
Indonesia, and risk undermining efforts to conserve
bio-diversity in the long-term, for three reasons.
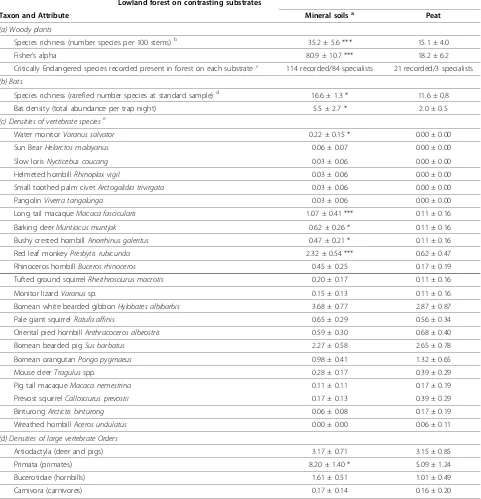
First, overall biodiversity levels in peat forest are
sub-stantially lower than in lowland forest on mineral soils
[81-83], reflecting the water-logged, nutrient-poor status
and lower productivity of peat forests [84-86]. Peat forest
plant diversity is less than half that of forest on mineral
soils (Table 2; see Additional File 1: Datafile_1.xls for
ori-ginal data). Only 21 (15%) of Indonesia
’
s 140 Critically
Endangered lowland plant species have been recorded in
peat, including three as specialists, compared to 104
(74%) found in lowland forest on mineral soils, 84 as
spe-cialists (Table 2; see Additional File 3: Datafile_3.xls for
original data). Peat forests also harbour significantly
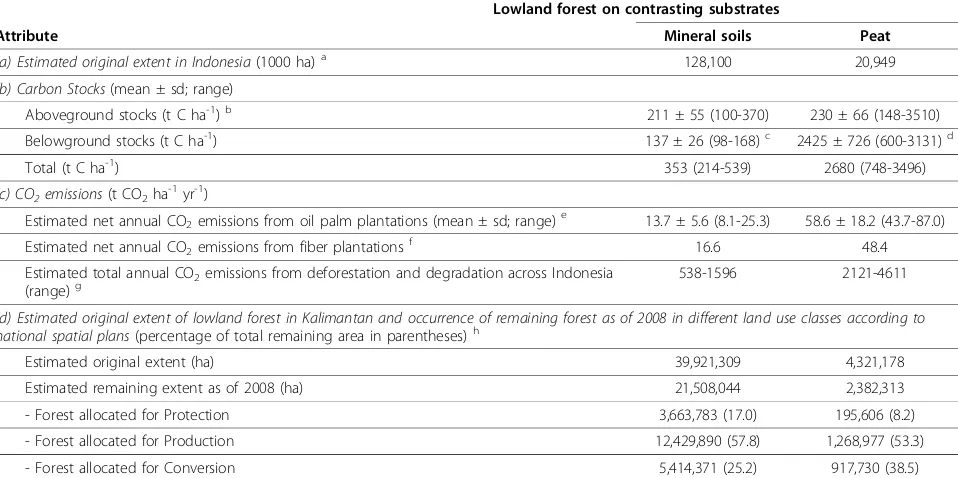
Table 1 Physical attributes and emission estimates for lowland tropical forest (<500 m a.s.l.) on peat and mineral
substrates in Indonesia
Lowland forest on contrasting substrates
Attribute Mineral soils Peat
(a) Estimated original extent in Indonesia(1000 ha)a 128,100 20,949
(b) Carbon Stocks(mean ± sd; range)
Aboveground stocks (t C ha-1)b 211 ± 55 (100-370) 230 ± 66 (148-3510)
Belowground stocks (t C ha-1) 137 ± 26 (98-168)c 2425 ± 726 (600-3131)d
Total (t C ha-1) 353 (214-539) 2680 (748-3496)
(c) CO2emissions(t CO2ha-1yr-1)
Estimated net annual CO2emissions from oil palm plantations (mean ± sd; range)e 13.7 ± 5.6 (8.1-25.3) 58.6 ± 18.2 (43.7-87.0)
Estimated net annual CO2emissions from fiber plantationsf 16.6 48.4
Estimated total annual CO2emissions from deforestation and degradation across Indonesia
(range)g 538-1596 2121-4611
(d) Estimated original extent of lowland forest in Kalimantan and occurrence of remaining forest as of 2008 in different land use classes according to national spatial plans(percentage of total remaining area in parentheses)h
Estimated original extent (ha) 39,921,309 4,321,178
Estimated remaining extent as of 2008 (ha) 21,508,044 2,382,313
- Forest allocated for Protection 3,663,783 (17.0) 195,606 (8.2)
- Forest allocated for Production 12,429,890 (57.8) 1,268,977 (53.3)
- Forest allocated for Conversion 5,414,371 (25.2) 917,730 (38.5)
Comparisons are made between (a) estimated original extent of forest on peat and mineral substrates across Indonesia; (b) carbon stocks and (c) emission levels from both Kalimantan and Sumatra; and (d) estimated original and remaining 2008 lowland forest cover in Kalimantan on peat and mineral soil, separated by national land use classification.
a
Estimated extent of 2008 forest cover derived from SPOT Veg imagery (1 km2resolution) by SarVision, overlaid with SRTM to define areas <500 m a.s.l. [26] and Wetlands International map of peat lands to define areas with surface peat >50 cm depth [27-29]. Total extent of lowland forest on mineral soils was estimated as all other forest <500 m a.s.l. not on peat, and includes lowland rain forest on well drained mineral soils (c. 107 of 128 million ha, 84% of the total], as well as forest on limestone, ultrabasic rock, nutrient poor sandy soils on which kerangas (heath) forest develops, mangroves and freshwater swamps.
b
See Additional File 1: Datafile_1.xls; [30-49].
c
Data from [50].
d
Data from [13,51-53].
e
See Additional File 1: Datafile_1.xls; [54-58].
f
Data from [55].
g
Includes emissions originating from deforestation, degradation, peat land decomposition from drainage and fires; data from [59-61].
h
Table 2 Biodiversity attributes of lowland tropical forest (<500 m a.s.l.) on peat and mineral soil substrates in Sumatra
and Kalimantan, Indonesia
Lowland forest on contrasting substrates
Taxon and Attribute Mineral soilsa Peat
(a) Woody plants
Species richness (number species per 100 stems)b 35.2 ± 5.6 *** 15.1 ± 4.0
Fisher’s alpha 80.9 ± 10.7 *** 18.2 ± 6.2
Critically Endangered species recorded present in forest on each substratec 114 recorded/84 specialists 21 recorded/3 specialists
(b) Bats
Species richness (rarefied number species at standard sample)d 16.6 ± 1.3 * 11.6 ± 0.8
Bat density (total abundance per trap night) 5.5 ± 2.7 * 2.0 ± 0.5
(c) Densities of vertebrate speciese
Water monitorVaranus salvator 0.22 ± 0.15 * 0.00 ± 0.00
Sun BearHelarctos malayanus 0.06 ± 0.07 0.00 ± 0.00
Slow lorisNycticebus coucang 0.03 ± 0.06 0.00 ± 0.00
Helmeted hornbillRhinoplax vigil 0.03 ± 0.06 0.00 ± 0.00
Small toothed palm civetArctogalidia trivirgata 0.03 ± 0.06 0.00 ± 0.00
PangolinViverra tangalunga 0.03 ± 0.06 0.00 ± 0.00
Long tail macaqueMacaca fascicularis 1.07 ± 0.41 *** 0.11 ± 0.16
Barking deerMuntiacus muntjak 0.62 ± 0.26 * 0.11 ± 0.16
Bushy crested hornbillAnorrhinus galeritus 0.47 ± 0.21 * 0.11 ± 0.16
Red leaf monkeyPresbytis rubicunda 2.32 ± 0.54 *** 0.62 ± 0.47
Rhinoceros hornbillBuceros rhinoceros 0.45 ± 0.25 0.17 ± 0.19
Tufted ground squirrelRheithrosciurus macrotis 0.20 ± 0.17 0.11 ± 0.16
Monitor lizardVaranussp. 0.15 ± 0.13 0.11 ± 0.16
Bornean white bearded gibbonHylobates albibarbis 3.68 ± 0.77 2.87 ± 0.87
Pale giant squirrelRatufa affinis 0.65 ± 0.29 0.56 ± 0.34
Oriental pied hornbillAnthracoceros albirostris 0.59 ± 0.30 0.68 ± 0.40
Bornean bearded pigSus barbatus 2.27 ± 0.58 2.65 ± 0.78
Bornean orangutanPongo pygmaeus 0.98 ± 0.41 1.32 ± 0.65
Mouse deerTragulusspp. 0.28 ± 0.17 0.39 ± 0.29
Pig tail macaqueMacaca nemestrina 0.11 ± 0.11 0.17 ± 0.19
Prevost squirrelCallosciurus prevostii 0.17 ± 0.13 0.39 ± 0.29
BinturongArctictis binturong 0.06 ± 0.08 0.17 ± 0.19
Wreathed hornbillAceros undulatus 0.00 ± 0.00 0.06 ± 0.11
(d) Densities of large vertebrate Orders
Artiodactyla (deer and pigs) 3.17 ± 0.71 3.15 ± 0.85
Primata (primates) 8.20 ± 1.40 * 5.09 ± 1.24
Bucerotidae (hornbills) 1.61 ± 0.51 1.01 ± 0.49
Carnivora (carnivores) 0.17 ± 0.14 0.16 ± 0.20
Comparisons are made between (a) woody plants, (b) bats, and (c & d) large vertebrates. Plant data compiled from published and unpublished literature, and mammal data are derived from field surveys. All data are mean ± 95% CI.
•P< 0.05, **P< 0.01, ***P< 0.001
a
Forest on lowland mineral (non-swamp) soils excluding forest on limestone, ultrabasic rock and coarse textured sandy soil types on which kerangas vegetation develops.
b
Compilation of published and unpublished records of‘local scale’(defined as <3 ha total sample plot area) woody plant surveys for stems≥10 cm diameter at breast height (see Additional File 1: Datafile_1.xls for original data; references [87-101]). The index‘Species per 100 stems’was computed as species per stem (total species number divided by total stem number) scaled to 100 stems. Total stem number per sample was similar between peat and mineral soils samples, 430 ± 328 vs 505 ± 265, respectively. Data compiled from n = 22 for peat and n = 24 for mineral areas. Richness and Fisher’s alpha compared using two-tailed t-test adjusted for unequal variance.
c
fewer bat species (Table 2) and support lower densities of
birds [107], bats and several keystone terrestrial and
arboreal vertebrates, though not all (e.g. the orangutan,
Table 2).
Second, biogeographically distinct sub-types of
low-land forest on mineral soils are under-represented in
Indonesia
’
s protected area network [108,109], and many
existing protected areas remain threatened by illegal
log-ging, conversion to agriculture and fires [110,111].
Third, according to 2008 data, c. 5.4 million ha of
remaining lowland mineral forest in Kalimantan (25% of
the total) is zoned for conversion to non-forest
agricul-tural uses, such as oil palm (Table 1). A further c. 12.4
million ha (58%) is zoned as production forest, which
can be legally converted to fiber plantations. Combined,
more than 80% of remaining species-rich lowland forest
on mineral soils in Kalimantan (c. 17.8 million ha) is
eli-gible for conversion.
There is a risk that preferential targeting of
carbon-dense peatland under REDD will worsen long-term
pro-spects for biodiversity conservation in Indonesia by
intensifying pressures to establish plantations in forested
mineral soil areas that offer lower emission reduction
potential (Table 1) but support richer biodiversity and
higher concentrations of threatened species (Table 2).
This problem is not unique to Indonesia [19]. Similar
unintended consequences from REDD could intensify
pressure on relatively low-carbon, floristically-rich
cer-rado
ecosystems suitable for soy expansion in Brazil,
and logged forests throughout the tropics, which store
less carbon, but not necessarily less biodiversity than
their unlogged counterparts [112,113].
Safeguarding biodiversity co-benefits of REDD
Despite meaningful progress made at COP 15 toward
developing a REDD framework, it remains unclear
whether and how biodiversity will be treated within
REDD. A properly structured market mechanism could,
in theory, promote more equal balance of REDD
inter-ventions across ecosystems with different biodiversity
attributes and threat levels (see example of an auction
based system in
8
). In the short-term, however, such an
approach would likely gain traction only in voluntary
carbon markets (e.g., Gold Standard emission credits of
the CCBA carbon standard, [114]), and such markets
are currently too limited to have global impact [115].
Instead, we believe that a regulatory approach will be
required to ensure REDD delivers substantial long-term
biodiversity co-benefits in tropical countries. We make
three recommendations for regulation to be effective:
Recommendation 1
Countries must prepare their own explicit national targets
for ecosystem and species protection across the full range
of native ecosystem types and biogeographic sub-regions
(where applicable). Where such plans already exist - for
example, to meet commitments under the Convention on
Biodiversity (CBD) - they must be re-evaluated, updated
and revised in a transparent manner, preferably in
accor-dance with methods approved by the UNFCCC (e.g.
following [116]).
Recommendation 2
Using these targets, gap analyses should be conducted to
identify ecosystem types currently under-represented in
the protected area network (or within degraded
pro-tected areas that have lost their conservation value) and
new areas required for priority species that have
insuffi-cient habitat to maintain large viable populations.
Recent work by [109] for Sumatra provides a useful
model to evaluate ecosystem representation.
Recommendation 3
With co-financing from REDD to offset opportunity
costs of foregone (or restricted) development, results
from the above can be used to redefine acceptable
land-use practices within priority areas needed to fill
biodi-versity conservation gaps. Examples might include: (i)
re-classifying land use status of forested areas slated for
conversion to non-conversion forest uses; (ii) restricting
silvicultural practices in specific production forest areas
to reduce impacts and maintain high biodiversity value;
or (iii) re-assigning forested areas of exceptional
impor-tance for strict protection as parks or nature reserves.
If such a national planning process were made a
pre-requisite for multi-lateral and bi-lateral REDD funding,
and REDD payments linked not only to verified emission
reductions but also to biodiversity co-benefits, then net
positive impacts on biodiversity would be ensured, and
the negative potential impacts we describe would be
reduced. A target-based approach also respects the
that are considered specialists on azonal extreme geological features, including limestone, ultrabasic rock, or kerangas forest types that form on podzolized soils on coarse textured sedimentary rocks. Species treated as specialists on peat or mineral soils are defined as taxa with records from only one ecosystem type. A full accounting of CR species recorded as present in peat is provided in Additional File 2: Datafile_2.xls.d
Based on harp-trap inventories of insectivorous bats captured at three locations each in forests on peat in Kalimantan (Danau Sentarum, Sungai Putri, Tanjung Puting), and forests on mineral soils in Kalimantan (Barito Ulu, Sungai Lesan) and Sabah (Danum Valley). Individual captures at each site were rarefied 1000 times in EstimateS to compare species richness at a standard number of individuals (n = 128, the capture number in the smallest inventory at Danau Sentarum). Capture rate - total bat abundance per trapping effort at a site - is a surrogate estimate of density.
e
Vertebrate densities were measured along permanent census routes in lowland forest on peat and mineral soil substrates at Gunung Palung National Park, West Kalimantan, Indonesia. Table shows total number of independent observations (Mean no. km-2
sovereignty of countries to prepare their own targets, and
fulfils objectives of the CBD, both for recipient (tropical)
countries and donor (developed) nations who are
signa-tories to the convention.
Conclusion
Implementing REDD to optimize biodiversity co-benefits
involves trade-offs with emissions reduction and cost. At
a global scale, planning REDD interventions to meet
bio-diversity targets, rather than maximize avoided emissions,
increases estimated cost only slightly [10]. Further study
is required to understand cost impacts at sub-national
scales where REDD will be implemented. Spatially
expli-cit methods are being developed to make systematic
comparison among alternative land use scenarios for
meeting biodiversity targets [117] and can be readily
adapted to incorporate emission reduction potentials or
other socio-political targets [118].
Protecting tropical forests is a good idea for mitigating
global climate change and conserving globally threatened
biodiversity. The devil, however, is in the details:
scien-tists, citizens and government must work closely to
determine where REDD funds should be spent to achieve
an acceptable balance between emission reductions from
forest and enhanced long-term biodiversity conservation.
Additional material
Additional file 1: Species richness, biomass and emission parameters for lowland forest on peat and mineral soils in Indonesia, Brunei and Malaysia. This file provides raw data and citations for information presented in tables and text of the manuscript comparing biodiversity, biomass and emission characteristics of lowland forest on peat and mineral soil substrates.
Additional file 2: Summary of REDD projects, programs and policy initiatives in Kalimantan and Sumatra, Indonesia. This file provides a summary of REDD activities in Sumatra and Kalimantan, including name, location, supporting institution(s), approximate size (ha) of areas covered by the activities and substrate (peat or mineral soils).
Additional file 3: Summary of dipterocarp tree species recorded in lowland forest on peat soils in Sumatra, Kalimantan, Sarawak and Sabah, and their conservation status on the IUCN Red List. This file provides a tabular summary of published and unpublished records for dipterocarp species recorded in at least one peat swamp forest site. Individual citations, conservation status under ICUN and some additional notes are provided for each species.
Acknowledgements
GDP, PLW and BY thank Aisyah Sileuw and staff at Daemeter Consulting for support of activities leading to the manuscript. Susan Page is acknowledged for sharing records on tree species in peat swamp. MJS was supported by a Leverhulme Trust Early Career Fellowship and wishes to thank Sephy Noerfahmy, Dorothea Pio and Tigga Kingston for sharing their bat data for biodiversity analyses. AJM thanks Universitas Tanjungpura, the Indonesian Institute of Sciences, the State Ministry of Research and Technology, the Directorate General for Nature Conservation and the Gunung Palung National Park Bureau for research permission; and J. William Fulbright Foundation, Louis Leakey Foundation, Department of Anthropology at Harvard University, and University of California at Davis for financial support.
We acknowledge Cam Webb, Antonia Gorog and Lex Hovani for useful discussions on this subject and three anonymous reviewers for constructive feedback.
Author details
1Daemeter Consulting, Bogor, Indonesia.2People and Nature Consulting
International, Jakarta, Indonesia.3School of Archaeology and Anthropology, Australian National University, Canberra, Australia.4Durrell Institute of
Conservation and Ecology, University of Kent, Canterbury, UK.5School of Biological & Chemical Sciences, Queen Mary University of London, London, UK.6Department of Anthropology, University of California at Davis, Davis,
USA.7Center for International Forestry and Agricultural Research, Bogor,
Indonesia.8Fauna and Flora International Indonesia Program, Jakarta,
Indonesia.9Xishuangbanna Tropical Botanical Garden, Chinese Academy of Sciences, Menglun, China.10Environmental Change Institute, University of
Oxford, UK.11Global Environment Centre, Selangor, Malaysia.12SarVision, University of Wageningen, The Netherlands.13The Orangutan Tropical
Peatland Project, Center for International Cooperation in Tropical Peatlands, Palangkaraya, Indoensia.
Authors’contributions
GDP, PLW, MJS and AJM contributed and analyzed data, and wrote the manuscript; EM, KO and BY participated in writing and the development of ideas; AT, AR, AM, BP, NW, SH and LD contributed data on biomass, plant species, emissions and/or land cover; FS contributed biomass data and the computation of Fisher’s alpha for plants. All authors read and approved the final manuscript.
Competing interests
The authors declare that they have no competing interests.
Received: 10 September 2010 Accepted: 23 November 2010 Published: 23 November 2010
References
1. Metz B, Davidson O, Bosch P, Dave R, Meyer L, (eds):Climate Change 2007: Mitigation.Contribution of Working Group III to the Fourth Assessment Report of the Intergovernmental Panel on Climate ChangeCambridge: Cambridge University Press; 2007.
2. van der Werf GR, Morton DC, RS DeFries, Olivier JGJ, Kasibhatla PS, Jackson RB, Collatz GJ, Randerson JT:CO2emissions from forest loss. Nature Geoscience2009,2:737-738.
3. Laurance W:A new initiative to use carbon trading for tropical forest conservation.Biotropica2007,39:20-24.
4. IUCN:IUCN Red List of Threatened Species, Version 20102.[http://www. iucnredlist.org], Downloaded on 15 August 2010..
5. Grainger A, Boucher DH, Frumhoff PC, Laurance WF, Lovejoy T, McNeely J, Niekisch M, Raven P, Sodhi NS, Venter O, Pimm SL:Biodiversity and REDD at Copenhagen.Current Biology2009,19:R974-R976.
6. PEACE:Indonesia and Climate Change: Current Status and Policies.A report prepared by the World Bank, Department of International Development (DFID] and PT Pelangi Energi Abadi Citra Enviro (PEACE); 2007, 1-90 [http://siteresources.worldbank.org/INTINDONESIA/Resources/ Environment/ClimateChange_Full_EN.pdf].
7. Gurney KR, Raymond L:Targeting deforestation rates in climate change policy: a“Preservation Pathway”approach.Carbon Balance and Management2008,3:2.
8. Obersteiner M, Huettner MM, Kraxner F, McCallum I, Aoki K, Bottcher H, Fritz S, Gusti M, Havlik P, Kindermann G, Rametsteiner E, Reyers B:On fair, effective and efficient REDD mechanism design.Carbon Balance and Management2009,4:11.
9. Bekessy SA, Wintle BA:Using carbon investment to grow the biodiversity bank.Conservation Biology2008,22:510-513.
10. Venter O, Laurance WF, Iwamura T, Wilson KA, Fuller RA, Possingham HP:
Harnessing carbon payments to protect biodiversity.Science2009,
326:1368.
12. UNFCCC:Copenhagen accord. FCCC/CP/2009/L.7.United Nations Framework Convention on Climate Change (UNFCCC], Bonn, Germany; [http://unfccc.int/resource/docs/2009/cop15/eng/l07.pdf].
13. Venter O, Meijaard E, Possingham H, Dennis R, Sheil D, Wich S, Hovani L, Wilson K:Carbon payments as a safeguard for threatened tropical mammals.Conservation Letters2009,2:123-129.
14. Ebeling J, Yasué M:Generating carbon finance through avoided deforestation and its potential to create climatic, conservation and human development benefits.Philosophical Transactions of the Royal Society of London, Series B2008,363:1917-1924.
15. Miles L, Kapos V:Reducing greenhouse gas emissions from deforestation and forest degradation: global land-use implications.Science2008,
320:1454-1455.
16. Stickler CM, Nepstad D, Coe MT, McGrath DG, Rodrigues HO, Walker WS, Soares-Filho BS, Davidson EA:The potential ecological costs and co-benefits of REDD: a critical review and case study from the Amazon region.Global change Biology2009,15:2803-2824.
17. ATBC and STE: Association for Tropical Biology and Conservation and the Society for Tropical Ecology:The Marburg Declaration.Marburg, Germany; 2009.
18. International Monetary Fund:World Economic Outlook Database.2010 [http://www.imf.org/external/pubs/ft/weo/2010/01/weodata/index.aspx]. 19. Obidzinski K, Chaudhury M:Transition to timber plantation based forestry
in Indonesia: towards a feasible new policy.International Forestry Review 2009,2:79-87.
20. Kementerian Lingkungan Hidup:Delegasi RI: menuju industri kelapa sawit yang berkelanjutan.Press Release; 2009.
21. Post Jakarta:18 million hectares of land for palm oil.2009 [http://www. thejakartapost.com/news/2009/12/02/indonesia-allocates-18-million-hectares-land-palm-oil.html].
22. Jatzo F:Indonesia cutting emissions by up to 41 per cent: How?East Asia Forum2009.
23. LOI:Letter of Intent between the Government of the Kingdom of Norway and the Government of the Republic of Indonesia on
“Cooperation on reducing greenhouse gas emissions from deforestation and forest degradation”.2010 [http://www.forestsclimatechange.org/ fileadmin/photos/Norway-Indonesia-LoI.pdf].
24. Madeira EM:REDD in Design: Assessment of Planned First Generation Activities in Indonesia to Reduce Emissions from Deforestation and Degradation (REDD).RFF Discussion Paper 09-49, Resources for the Future, Washington, DC; 2009.
25. Sills E, Madeira EM, Sunderlin WD, Wertz-Kanounnikoff S:The evolving landscape of REDD+ projects.Edited by: Angelsen A, Brockhaus M, Kanninen M, Sills E, Sunderlin WD, Wertz-Kanounnikoff S. Realising REDD+: National strategy and policy options. CIFOR, Bogor, Indonesia; 2009:265-280. 26. Jarvis A, Reuter HI, Nelson A, Guevara E:Hole-filled seamless SRTM data
V4, International Centre for Tropical Agriculture (CIAT).2008 [http://srtm. csi.cgiar.org].
27. Wahyunto S, Ritung , Subagjo H:Maps of Area of Peatland Distribution and Carbon Content in Sumatera, 1990-2002.Wetlands International-Indonesia Programme & Wildlife Habitat Canada (WHC). Reproduced within Interactive Atlas of Indonesia’s Forests (CD-ROM), World Resources Institute: Washington, DC; 2003.
28. Wahyunto S, Ritung , Subagjo H:Map of Peatland Distribution Area and Carbon Content in Kalimantan, 2000-2002.Wetlands International-Indonesia Programme & Wildlife Habitat Canada (WHC). Reproduced within Interactive Atlas of Indonesia’s Forests (CD-ROM), World Resources Institute: Washington, DC; 2005.
29. Wahyunto , Heryanto Bambang, Bekti Hasyim, Widiastuti Fitri:Maps of Peatland Distribution, Area and Carbon Content in Papua, 2000-2001 Wetlands International-Indonesia Programme & Wildlife Habitat Canada (WHC).Reproduced within Interactive Atlas of Indonesia’s Forests (CD-ROM), World Resources Institute: Washington, DC; 2006.
30. Lawrence D:Erosion of tree diversity during 200 years of shifting cultivation in Bornean rain forest.Ecological Applications2004,
14:1855-1869.
31. Webb CO:Seedling ecology and tree diversity in a Bornean rain forest.
PhD Thesis, Dartmouth College, Hanover, New Hampshire, USA. 32. Asdak C, Jarvis PG, Gardingen PV:Modelling rainfall interception in
unlogged and logged forest areas of Central Kalimantan, Indonesia.
Hydrology and Earth System Sciences1998,2:211-220.
33. Wilkie P, Argent G, Cambell E, Saridan A:The diversity of 15 ha of lowland mixed dipterocarp forest, Central Kalimantan.Biodiversity and
Conservation2004,13:695-708.
34. Mirmanto E, Proctor J, Green J, Nagy L, Suriantata :Effects of nitrogen and phosphorus fertilization in a lowland evergreen rainforest.Philosophical Transactions of the Royal Society of London, Series B1999,354:1825-1829. 35. Ashton PS:Ecological studies in the mixed dipterocarp forests of Brunei
State.Oxford Forestry Memoirs 25; 1964.
36. Davies SJ, Becker P:Floristic composition and stand structure of mixed dipterocarp and heath forests in Brunei Darussalam.Journal of Tropical Forest Science1996,8:542-569.
37. Proctor J, Anderson JM, Chai P, Vallack HW:Ecological Studies in Four Contrasting Lowland Rain Forests in Gunung Mulu National Park, Sarawak: I. Forest Environment, Structure and Floristics.Journal of Ecology 1983,1:237-260.
38. Newbery DM, Campbell EJF, Proctor J, Still MJ:Primary lowland dipterocarp forest at Danum Valley, Sabah, Malaysia. Species composition and patterns in the understorey.Vegetatio1996,
122:193-220.
39. Laumonier Y, Edin A, Kanninen M, Munandar AW:Landscape-scale variation in the structure and biomass of the hill dipterocarp forest of Sumatra: Implications for carbon stock assessments.Forest Ecology and Management2010,250:505-513.
40. Yamakura T, Hagihara A, Sukardjo S, Ogawa H:Aboveground biomass of tropical rain forest stands in Indonesian Borneo.Vegetatio1986,68:71-82. 41. Fox JED:A Handbook to Kabili-Sepilok Forest Reserve.Sabah Forest
Record No. 9. Borneo Literature Bureau, Kuching. Sabah Forest Department; 1973.
42. Paoli GD, Curran LM, Slik JWF:Soil nutrients affect spatial patterns of aboveground biomass and emergent tree density in southwestern Borneo.Oecologia2008,155:287-299.
43. Lasco RD:Forest carbon budgets in Southeast Asia following harvesting and land cover change.Science in China (Series C)2002,45:55-64. 44. Hairiah KSM, Sitmopul M, van Noordwick, Palm C:Carbon stocks of
tropical land use systems as part of the global C balance; effects of forest conversion and options for‘clean development’activities.
Alternatives to Slash and Burn (ASB) Lecture Note 4a, International Center for Research in Agroforestry, Southeast Asian Regional Research Programme, Bogor, Indonesia.
45. Jaya A, Siregar UJ, Massijaya MY:Biomass content and biodiversity of peat swamp forest under various land cover conditions.Proceedings of the International Symposium on Tropical Peatland Management: Wise Use of Tropical Peatland: 14-15 July 2009; Bogor2009.
46. Waldes N, Page SE:Forest structure and tree diversity of a peat swamp forest in Central Kalimantan, Indonesia.InProceedings of the International Symposium on Tropical Peatland: Peatlands for People - Natural Resource Functions and Sustainable Management.Edited by: Rieley JO, Page SE. BBPT and Indonesian Peat Association; 2002:16-22.
47. Rahayu S, Lusiana B, van Noordwick M:Above ground carbon stock assessment for various land use systems in Nunukan, East Kalimantan.
Edited by: Lusiana B, van Noordwick M, Rahayu S. Carbon Stock Monitoring in Nunukan, East Kalimantan: A spatial and modelling approach. World Agroforestry Center, Southeast Asia, Bogor, Indonesia; 2005:21-34. 48. Ludang Y, Palangka Jaya H:Biomass and carbon content in tropical forest
of Central Kalimantan.Journal of Applied Sciences in Environmental Sanitation2007,2:7-12.
49. Diemont WH, Nabuurs GJ, Rieley JO, Rijksen HD:Climate change and management of tropical peatlands as a carbon reservoir.Edited by: Rieley JO, Page SE. Biodiversity and Sustainability of Tropical Peatlands. Samara Publishing, Cardigan, U.K; 1997:363-368.
50. Brown S, Iverson LR, Prasad A, Liu D:Geographical distributions of carbon in biomass and soils of tropical Asian forests.Geocarta International1993,
4:45-59.
51. Page SE, Banks CJ, Rieley JO:Tropical peatlands: distribution, extent and carbon storage - uncertainties and knowledge gaps.Proceedings of the International Symposium and Workshop on Tropical Peatland: carbon-climate-human interactions on tropical peatland: carbon pools, fire, mitigation, restoration and wise use: 27-29 August 2007; Yogyakarta2007, 19-24. 52. Agus F:Environmental risks of farming on peat land.Proceedings of
53. Jaenicke J, Rieley JO, Mott C, Kimman P, Siegert F:Determination of the amount of carbon stored in Indonesian peatlands.Geoderma2009,
147:151-158.
54. Melling L, Hatano R, Goh KJ:Soil CO2 flux from three ecosystems in tropical peatland of Sarawak, Malaysia.Tellus2005,57B:1-11. 55. Verchot LV, Petkova E, Obidzinski K, Atmadja S, Yuliani EL, Dermawan A,
Murdiyarso D, Amira S:Reducing forestry emissions in Indonesia.Center for International Forestry Research (CIFOR), Bogor, Indonesia; 2010. 56. Dewi S, Khasanah N, Rahayu S, Ekadinata A, van Noordwijk M:Carbon
Footprint of Indonesian Palm Oil Production: a Pilot Study.Bogor, Indonesia. World Agroforestry Centre - ICRAF, SEA Regional Office; 2009. 57. Brinkmann :Greenhouse Gas Emissions from Palm Oil Production:
Literature review and proposals from the RSPO Working Group on Greenhouse Gases Final report, 9 October 2009.
58. Agus F, Runtunuwu E, June T, Susanti E, Komara H, Syahbuddin H, Las I, van Noordwijk M:Carbon dioxide emission in land use transitions to plantation.Jurnal Litbang Pertanian2009,28:119-126.
59. DNPI:Dewan Nasional Perubahan Iklim Indonesia: Indonesia Greenhouse Gas Abatement Cost Curve.Jakarta; 2010 [http://www.dnpi.go.id/report/ DNPI-Media-Kit/reports/indonesia-ghg_abatement_cost_curve/ Indonesia_ghg_cost_curve_english.pdf].
60. Hooijer A, Silvius M, Wösten H, Page S:PEAT-CO2, Assessment of CO2 emissions from drained peatlands in SE Asia.Delft Hydraulics report Q3943 (2006); 2006, 1-41.
61. Hooijer A, Page S, Canadell JG, Silvius M, Kwadijk J, Wosten H, Jauhiainen J:
Current and future CO2emissions from drained peatlands in Southeast
Asia.Biogeosciences2010,7:1505-1514.
62. Andriesse JP:Nature and Management of Tropical Peat Soils.FAO Soils Bulletin, 59. Rome; 1988.
63. Holmes D:Indonesia: Where Have All the Forests Gone?Environment and Social Development, East Asia and Pacific Region Discussion Paper. World Bank, Washington, DC; 2002, 1-52.
64. Mutert E, Fairhurst TH, von Uexkull HR:Agronomic management of oil palms on deep peat.Better Crops International1999,13:22-27.
65. Sargeant HJ:Vegetation Fires in Sumatra, Indonesia Oil Palm Agriculture in the Wetlands of Sumatra.Destruction or Development? European Union and Ministry of Forestry, Jakarta, Indonesia; 2001.
66. Miettinen J, Liew SC:Degradation and development of peatlands in Peninsular Malaysia and in the islands of Sumatra and Borneo since 1990.Land Degradation and Development2010,21:285-296.
67. Herzog T:World Greenhouse Gas Emissions in 2005.WRI Working Paper, World Resources Institute, Washington, DC; 2009, 1-5.
68. Page SEF, Siegert JO, Rieley , Boehm HDV, Jaya A, Limin S:The amount of carbon released from peat and forest fires in Indonesia during 1997.
Nature2002,420:61-65.
69. Ministry of Forestry (MoF):Forestry statistics of Indonesia.Department of Forestry, Ministry of Forestry, Jakarta, Indonesia; 2009.
70. Simamora AP:Stop converting peatlands, govt study recommends.The Jakarta Post, Jakarta; 2010 [http://www.thejakartapost.com/news/2010/01/ 18/stop-converting-peatlands-govt-study-recommends.html], 18 January 2010.
71. Gaveau DLA, Wich S, Epting J, Juhn D, Kanninen M, Leader-Williams N:The future of forests and orangutans (Pongo abelii) in Sumatra: predicting impacts of oil palm plantations, road construction, and mechanisms for reducing carbon emissions from deforestation.Environmental Research Letters; 2009:4:11.
72. Joppa LN, Pfaff A:High and far: biases in the location of protected areas.
PLoS ONE2009,4:e8273.
73. Ng PKL, Tay JB, Lim KKP:Diversity and conservation of blackwater fishes in Peninsular Malaysia, particularly in the North Selangor peat swamp forest.Hydrobiologia1994,285:203-218.
74. Kottelat M, Whitten T:Freshwater biodiversity in Asia: with special reference to fish.World Bank Technical Paper No 343 World Bank, Washington DC; 1996.
75. Page SE, Rieley JO, Doody K, Hodgson S, Husson S, Jenkins P, Morrogh-Bernard H, Otway S, Wilshaw S:Biodiversity of tropical peat swamp forest: A case study of animal diversity in the Sungai Sebangau catchment of Central Kalimantan, Indonesia.InTropical peatlands.Edited by: Rieley JO, Page SE. Cardigan: Samara Publishing Limited; 1997:231-242.
76. Wikramanayake E, Dinerstein E, Loucks JC, Olson MD, Morrison J, Lamoreux J, McKnight M, Heda P:Terrestrial Ecoregions of the Indo-Pacific. A Conservation AssessmentUSA: Island Press; 2002.
77. Meijaard E:The importance of swamp forest for the conservation of orang utans (Pongo pygmaeus pygmaeus) in Kalimantan, Indonesia.In Proceedings of the International Symposium on the Biodiversity, Environmental Importance and Sustainability of Tropical Peat and Peatlands.Edited by: Page SE, Rieley JO. Samara Publishing Limited; 1997:243-254.
78. Bezuijen M, Webb GJW, Hartoyo P, Samedi :Peat swamp forest and the false gharialTomistoma schlegelii(Crocodilia, Reptilia) in the Merang River, eastern Sumatra, Indonesia.Oryx2001,35:301-307.
79. Uryu Y,et al:Deforestation, degradation, biodiversity loss and CO2
emission in Riau, Sumatra, Indonesia.WWF Technical Report, Jakarta, Indonesia; 2008.
80. Husson SJ, Wich SA, Marshall AJ, Dennis RD, Ancrenaz M, Brassey R, Gumal M, Hearn AJ, Meijaard E, Simorangkir T, Singleton I:Orangutan distribution, density, abundance and impacts of disturbance.In Orangutans: Geographic variation in behavioral ecology and conservation. Edited by: Wich SA, Utami S, Mitra Setia T, van Schaik CP. Oxford: Oxford University Press; 2009:77-96.
81. Whitmore TC:Tropical rain forests of the Far East.2 edition. Oxford: Oxford University Press; 1984.
82. IUCN:The conservation atlas of tropical forests: Asia and the PacificLondon: Macmillan; 1991.
83. Ashton PS:Conservation of Borneo biodiversity: do small lowland parks have a role, or are big inland sanctuaries sufficient? Brunei as an example.Biodiversity and Conservation2009,19:343-356.
84. Janzen DH:Tropical blackwater rivers, animals, and mast fruiting by the Dipterocarpaceae.Biotropica1974,6:69-103.
85. Mirmanto E, Polosokan R:Preliminary study on growth, mortality and recruitment of tree species in peat swamp forest at Tanjung Puting National Park, Central Kalimantan.InProceedings of the International Symposium on Tropical Peat Lands.Edited by: Rieley JO, Banks CJ, Ragjagukguk B. Hokkaido University 1999:165-172.
86. Nishimua TB, Suzuki E, Kohyama T, Tsuyuzaki S:Mortality and growth of trees in peat-swamp and heath forests in Central Kalimantan after severe drought.Plant Ecology2006,193:301-313.
87. Purwaningsih , Yusuf R:Vegetation Analysis of Suaq Belimbing peat swamp Forest, Gunung Leuser National Park-South Aceh.Proceedings of the International Symposium on Tropical Peat LandsHokkaido University & Indonesian Institute of Sciences. Bogor, Indonesia; 1999, 275-282. 88. Siregar M, Sambas EN:Composition of Peat Swamp Forest in
Mensemat-Sambas, West Kalimnatan.Proceedings of the International Symposium on Tropical Peat LandsHokkaido University & Indonesian Institute of Sciences. Bogor, Indonesia; 1999, 153-164.
89. Saribi AH, Riswan SS:Peat swamp forest in Nyaru Menteng Arboretum, Palangkaraya, Central Kalimantan, Indonesia: Its tree species diversity and secondary succession.Paper presented at the Seminar on Tropical Ecology held by Japanese Society of Tropical Ecology, 21-22 June 1997, Shiga, Japan.
90. Yamada I:Peat swamp forests in Borneo and Sumatra - Original state, development and disasters during the past 50 years with a proposal for future eco-resource management.Tropics2006,15:329-336.
91. Santosa Y, Kartono AP, Muin A:Pendugaan potensi dan studi
keanekaragaman jenis vegetasi di calon lokasi pelepas-liaran orang utan di Kabupaten Seruyan, Propinsi Kalimantan Tengah.Report for Orangutan Foundation International and Infinite Earth Rimba Raya Project; 2008.
92. Anderson JAR:The ecology and forest types of the peat swamp forests of Sarawak and Brunei in relation to their silviculture.PhD Dissertation, Edinburgh, England; 1961.
93. Anderson JAR:The flora of the peat swamps of Sarawak and Brunei, including a catalogue of all recorded species of flowering plants, ferns and fern allies.The Gardens Bulletin, Singapore1963,20:131-228. 94. Anderson JAR:The tropical peat swamps of western Malaysia.Mires:
Swamp, Bog, Fen and Moot: Ecosystems of the World 4B, Elsevier, Amsterdam; 1983, 181-199.
96. Eichhorn KAO, Slik JWF:The plant community of Sungai Wain, East Kalimantan, Indonesia: Phytogeographical status and local variation.
Blumea Supplement2006,18:15-35.
97. Miyagi Y, Tagawa H, Suzuki E, Wirawan N, Oka NP:Phytosociological study on the vegetation of Kutai National Park, East Kalimantan, Indonesia.
Memorial Kagoshima University Research Center, Occasional Papers1988,
14:51-62.
98. van Valkenburg JLCH:Non-Timber Forest Products of East Kalimantan. Potentials for Sustainable Use. Tropenbos Series 16.The Tropenbos Foundation, Wageningen, The Netherlands; 1997.
99. Kitayama K:An altitudinal transect study of the vegetation on Mount Kinabalu, Borneo.Vegetatio1992,102:149-171.
100. Pendry CA, Proctor J:Altitudinal zonation of rain forest on Bukit Belalang, Brunei: soils, forest structure and floristics.Journal of Tropical Ecology 1997,13:221-241.
101. Ashton PS:Dipterocarpaceae.Flora Malesiana; 19829, Series 1.
102. Newman MF, Burgess PF, Whitmore TC:Royal Botanic Garden Edinburgh.
Borneo Island Medium and Heavy Hardwoods: Dipterocarpus, Drybalanops, Hopea, Shorea (balau/selangan batu), UpunaUnited Kingdom: The Charlesworth Group; 1998.
103. Newman MF, Burgess PF, Whitmore TC:Royal Botanic Garden Edinburgh.
Borneo Island Light Hardwoods: Anisoptera, Parashorea, Shorea (red, white and yellow meranti)United Kingdom: The Charlesworth Group; 1998. 104. Laumonier Y:Geobotany 22.The vegetation and physiography of Sumatra
Netherlands: Kluwer Academic Publishers; 1997.
105. Simbolon H, Mirmanto E:Checklist of plant species in the peat swamp forests of Central Kalimantan, Indonesia.Proceedings of the International Symposium on Tropical peatlands, 22-23 November 1999; BogorUniversity of Hokkaido & Indonesian Institute of Sciences; 2000, 179-190.
106. Purwaningsih :Sebaran ekologi jenis-jenis Dipterocarpaceae di Indonesia.
Biodiversitas2004,5:89-95.
107. Gaither JC:Understorey avifauna of a Bornean peat swamp forest: Is it depauperate?Wilson Bulletin1994,106:381-390.
108. MacKinnon J:Protected areas systems review of the Indo-Malayan Realm.The Asian Bureau for Conservation and World Conservation Monitoring Center; Cambridge: Call Printers Limited; 1997.
109. Laumonier Y, Uryu Y, Stüwe M, Budiman A, Setiabudi B, Hadian O: Eco-floristic sectors and deforestation threats in Sumatra: identifying new conservation area network priorities for ecosystem-based land use planning.Biodiversity and Conservation2010,19:1153-1174. 110. Curran LM, Trigg SN, McDonald AK, Astiani D, Hardiono YM, Siregar P,
Caniago I, Kasischke E:Lowland forest loss in protected areas of Indonesian Borneo.Science2004,303:1000-1003.
111. Gaveau DLA, Epting J, Lyne O, Linkie M, Kumara I, Kanninen M, Leader-Williams N:Evaluating whether protected areas reduce tropical deforestation in Sumatra.Journal of Biogeography2009,11:2165-2175. 112. Cannon CH, Peart DR, Leighton M:Tree species diversity in commercially
logged Bornean rainforest.Science1998,281:1366-1368.
113. Meijaard E, Sheil D, Nasi R, Augeri D, Rosenbaum B, Iskandar D, Setyawati T, Lammertink MJ, Rachmatika I, Wong A, Soehartono T, Stanley S, O’Brien T: Life after logging: reconciling wildlife conservation and production forestry in Indonesian Borneo CIFOR, WCS and UNESCO, Bogor, Indonesia; 2005. 114. CCBA:Climate, Community & Biodiversity Project Design Standards,
Second Edition CCBA.Arlington, VA; 2008, 1-50 [http://www.climate-standards.org].
115. Karousakis K:Promoting biodiversity co-benefits in REDD.OECD Publishing; 2010, 1-26, OECD Environment Working Papers, No 11. 116. Pressey RL, Humphries CJ, Margules CR:Beyond opportunism-key
principles for systematic reserve selection.Trends in Ecology & Evolution 1993,8:124-128.
117. Wilson K, Meijaard E, Drummond S, Grantham H, Boitani L, Catullo G, Christie L, Dennis R, Dutton I, Falcucci A, Maiorano L, Possingham H, Rondinini C, Turner W, Venter O, Watts M:Conserving biodiversity in production landscapes.Ecological Applications2010,20:1721-1732. 118. Ghazoul J, Butler RA, Mateo-Vega J, Koh LP:REDD: a reckoning of environment and development implications.Trends in Ecology and Evolution2010,25:396-402.
doi:10.1186/1750-0680-5-7
Cite this article as:Paoliet al.:Biodiversity Conservation in the REDD.
Carbon Balance and Management20105:7.
Submit your next manuscript to BioMed Central
and take full advantage of:
• Convenient online submission
• Thorough peer review
• No space constraints or color figure charges
• Immediate publication on acceptance
• Inclusion in PubMed, CAS, Scopus and Google Scholar
• Research which is freely available for redistribution