Open Access
Research
Contamination of rural surface and ground water by endosulfan in
farming areas of the Western Cape, South Africa
Mohamed A Dalvie*
1
, Eugene Cairncross
2
, Abdullah Solomon
2
and
Leslie London
1
Address: 1Occupational and Environmental Health Research Unit, Department of Public Health, Medical School, University of Cape Town, Anzio
Road, Observatory 7925, Cape Town, South Africa and 2Department of Physical Science, Peninsula Technicon, Box 1906, Bellville 7535, South
Africa
Email: Mohamed A Dalvie* - aqiel@cormack.uct.ac.za; Eugene Cairncross - cairncrosse@pentech.ac.za; Abdullah Solomon - solomona@pentech.ac.za; Leslie London - ll@cormack.uct.ac.za
* Corresponding author
Abstract
Background: In South Africa there is little data on environmental pollution of rural water sources by agrochemicals.
Methods: This study investigated pesticide contamination of ground and surface water in three intensive agricultural areas in the Western Cape: the Hex River Valley, Grabouw and Piketberg. Monitoring for endosulfan and chlorpyrifos at low levels was conducted as well as screening for other pesticides.
Results: The quantification limit for endosulfan was 0.1 µg/L. Endosulfan was found to be widespread in ground water, surface water and drinking water. The contamination was mostly at low levels, but regularly exceeded the European Drinking Water Standard of 0.1 µg/L. The two most contaminated sites were a sub-surface drain in the Hex River Valley and a dam in Grabouw, with 0.83 ± 1.0 µg/L (n = 21) and 3.16 ± 3.5 µg/L (n = 13) average endosulfan levels respectively. Other pesticides including chlorpyrifos, azinphos-methyl, fenarimol, iprodione, deltamethrin, penconazole and prothiofos were detected. Endosulfan was most frequently detected in Grabouw (69%) followed by Hex River (46%) and Piketberg (39%). Detections were more frequent in surface water (47%) than in groundwater (32%) and coincided with irrigation, and to a lesser extent, to spraying and trigger rains. Total dietary endosulfan intake calculated from levels found in drinking water did not exceed the Joint WHO/FAO Meeting on Pesticide Residues (JMPR) criteria.
Conclusion: The study has shown the need for monitoring of pesticide contamination in surface and groundwater, and the development of drinking water quality standards for specific pesticides in South Africa.
Background
As water pollution by pesticides can affect many biologi-cal systems, the widespread use of potentially harmful pesticides has recently come under scrutiny in South Afri-ca [1,2]. Once contaminated, the groundwater may take a
long time to clear [3] and there is always the danger of bioaccumulation.
Expenditure on agrochemicals has increased markedly over the past decade [4] and a far greater variety of
Published: 10 March 2003
Environmental Health: A Global Access Science Source 2003, 2:1
Received: 18 December 2002 Accepted: 10 March 2003
This article is available from: http://www.ehjournal.net/content/2/1/1
chemicals are used locally compared to other developing countries [5,6]. There is, however, little environmental monitoring of pesticides [7].
Pesticide exposures are associated with a growing number of chronic health effects [8,9], with local farm workers be-ing at particular risk due to unsafe application methods [10] and adverse living and working conditions [5]. While concern for water pollution by pesticides has mobilised considerable resources in other countries, particularly in the developed world, little research has been undertaken in South Africa [11]. Available literature [12–17] reports the presence of a number of pesticides in rivers and dams. In the Western Cape, Davies et al. [15] detected six pesti-cides in Elgin dams and three in Caledon dams, with en-dosulfan present in 26 of 27 Elgin dams at concentrations as high as 626 µg/L. Recently, Schultz et al. [13] found in-creased endosulfan presence in the Lourens River after washout during the first rains. However, no contamina-tion was found in a study undertaken in the Hex River Val-ley, [17] probably due to the use of monitoring equipment with high detection limits. (Personal commu-nication, Dr John Weaver, Watertek, Sept 1995). The aim of this study was to investigate pesticide pollution of wa-ter supplies in agricultural areas of the Weswa-tern Cape, South Africa. The objectives were to identify rural water sources in the Western Cape at high risk of agrochemical contamination, to identify and quantify the presence of agrochemicals at these selected sites and to explore the im-plications for human health.
For assessment of the possible chronic health and envi-ronmental effects of long-term exposure to pesticides, ex-tended monitoring of ground, surface and drinking water, as well as analytical techniques with sufficiently low levels of detection are essential.
Methods
Identification of study areas ("areas of concern") and sam-pling sites
Identification of areas with the potential for water con-tamination by pesticides was conducted through review of secondary data, interviews with rural health care provid-ers, farmprovid-ers, environmental officers and other agricultural personnel and field observation. Access to sites was nego-tiated with local agricultural organisations and assistance was sought from geohydrologists to identify areas and sites most vulnerable to pesticide contamination.
Three intensive agricultural districts, Piketberg, Grabouw and the Hex River Valley were selected as study areas (Fig-ure 1). All three areas have a Mediterranean climate with winter rainfall. The Hex River and Piketberg districts are semi-arid (receiving < 300 mm rain per year), while Grabouw is in a high rainfall area (> 400 mm per year).
Grape farming is practised in the Hex River district (Figure 2). The most important source of water for drinking and irrigation is a mountain dam. Soil conditions are condu-cive to pesticides reaching the water table and contami-nating groundwater (water table < 1 m, unconfined aquifer, coarse soils with low clay content) [18].
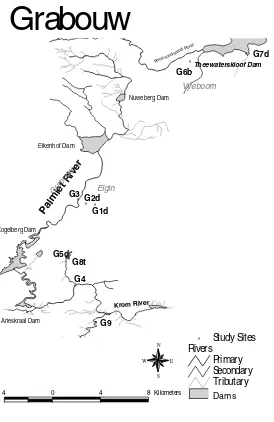
The Grabouw district (Figure 3) includes two pomefruit
farming areas (Grabouw and Vyeboom). In both areas, the soil is complex but generally promotes run-off to sur-face water sites [18]. The high annual rainfall tends to en-courage run-off.
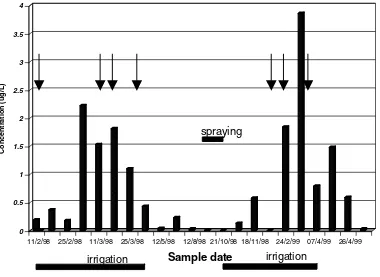
Piketberg (Figure 4) is an important farming region
cov-ering a much larger area than the 2 other study districts. Fruit farming is practised on the Piketberg mountains and wheat farming in the valley. The soil in both areas is mul-ti-textured, but generally leachable and prone to run-off [18]. The water table is moderately shallow (< 5 m). There are substantially more wells in this area than in the Hex River and Grabouw. The Berg is the major river running through the area and water is purified for domestic con-sumption at a number of places along its course. The pu-rification scheme at Wittewaters is a major source of drinking water in the rural Western Cape and is fed by the Misverstand Dam, situated amidst extensive wheat farms, where aerial spraying of pesticides is commonly practiced. The Berg River, flowing through fruit farming areas also flows into the Misverstand Dam.
Sampling sites in the three areas, summarised in Table 1 and shown in Figures 2, 3, and 4, were chosen to provide a spread of ground, sub-surface and surface water. Some sampling points were added in the course of the study to enable a better understanding of contamination patterns at the different sites.
Sampling sites in the Hex River region were along the Hex River. The two sub-surface drains (Bdr and Cdr) eventual-ly feed into the Hex River.
Grabouw/Vyeboom sites were selected on farms belong-ing to one of two major apple-packbelong-ing co-operatives in the region.
Unlike the other 2 areas, in Piketberg sampling access to farms was arranged by the local environment officer, who is the municipal official responsible for public health functions in rural areas.
Field sampling
collected once monthly in each area on a rotating cycle, and twice in the week after the first rainfall trigger (> 10 mm over 24 hours or > 15 mm over 48 hours), using a standardised procedure (the same method each time). Al-though an attempt was made to take dam and river sam-ples as far away from the bank as possible and submerging sampling bottles about 1 m deep, this was not always pos-sible due to problems with access and shallow water levels.
Samples were collected directly in clean, dry, 2.5 and 1 L amber glass bottles fitted with a screw cap lined with clean aluminium foil. Samples were kept at ambient tempera-ture in a holding box for transport to the laboratory where they were stored in a refrigerator until extraction. Sample pH, water temperature, subjective assessment of water lev-el (low, medium or high) and the occurrence of spraying
within 1 km of the sampling point were recorded (These results are not shown because they did not add to the in-terpretation of the findings (See London et. al. [18]).
Choice of pesticides for analysis
Not all pesticides could be monitored due to the prohibi-tive costs of multi-residue screening methods. Instead, a comprehensive list of pesticides used in the three areas was shortened [18] to thirty-one pesticides for analyses, conditioned by the availability and existence of local methods for analysis.
Analyses were conducted jointly by the Analytical Chem-istry laboratories of the Peninsula Technikon (PEN-TECH), which was the project laboratory, and the State Forensic (SF) Laboratory, both of which are in Cape Town. The SF undertook analyses conducted as a battery
Figure 1
Location of study areas for pesticide sampling in the Western Cape, South Africa
#
WESTERN_CAPE
Piketberg
Hex River
Grabouw CAPE TOWN
Western Cape National Roads
# Cape Town
Study Areas
300 0 300 600 Kilometers
N
E W
S
Study Areas
Atlantic Ocean
Indian Ocean
for all thirty-one pesticides (quantification limit, 0.1 µg/ L) in line with their statutory function of providing a screening service for monitoring of pesticide residues in food. Based on their preliminary results and on anticipat-ed findings, PENTECH developanticipat-ed methods to analyse five pesticides, including endosulfan (isomers I and II and en-dosulfan sulphate), BHC. DDT, dichlorvos and chlorpyrifos.
Iprodione, azinphos-methyl, prothiofos, deltamethrin and fenarimol were detected on six occasions at low levels at ten different sites [18], whereas chlorpyrifos and endo-sulfan were detected on screening by either the State labo-ratory, or the Agricultural Research Council Laboratory
(ARC) on a number of occasions. Consequently, PEN-TECH focused on investigating analytical methods for chlorpyrifs and endosulfan. The results for endosulfan, a commonly recognised endocrine disruptor [19,20], are presented in this paper. The results for the other pesticides did not change the overall findings of the study.
Analyses
Sample extraction
PENTECH used solid phase extraction following EPA methods [21,22]. Samples, which were vacuum pre-fil-tered through S&S filter paper (ref. No. 334508) were ex-tracted within seven days of collection (more than 80 % were extracted within three days) using Bond Elute
Figure 2
Location of sampling sites for pesticides in the Hex River Valley
# # #
# # #
#
#
#
#
# #
E
K
F L
M
G
Ar
Br
Dd
Cdr
Hw
Bdr He De Doorns
x Rive
r Sand
River
Mountains Valley Rivers
Primary Tributary
# Study Sites
10 0 10 Kilometers
N
E W
S
Figure 3
Location of sampling sites for pesticides in the Grabouw/Vyeboom Area #
# # #
# # #
#
#
Pal mie
tR iver
Riviers ondere
ndRiv er
Krom River
G9 G3
G4 G1d G2d
G5d G8t
G6b
G7d
Eikenhof Dam
Nuweberg Dam
Kogelberg Dam
Arieskraal Dam
Theewaterskloof Dam
4 0 4 8 Kilometers Dams2.shp
Rivers Primary Secondary Tributary
# Study Sites
N
E W
S
Grabouw
Vyeboom
Elgin
Gra bouw
Figure 4
Location of sampling sites for pesticides in the Pikerberg Area
# ##
#
#
#
#
Berg River
P4
P5
P6 P7b P2d
P1b
P3b
0 10 Kilometers
Mountains Valleys Rivers
Berg River Platkloof River Tributary
# Study Sites
N
E W
S
Piketberg
Broodkraal Goe
dver wac
Extraction Cartridges (C18, 10 ml LRC, 500 mg sorbent mass). The column was conditioned with 2 volumes (2 – 10 ml) of ethyl acetate, and 1 volume each of methanol and deionised water.
High-pressure chromatography grade solvents were used. 250 ml of filtered sample was column aspirated at 20 – 25 ml per minute under vacuum. The column was then washed with one volume (10 ml) deionised water and thoroughly dried for 15 minutes under vacuum. Pesticides were eluted into a borosilicate glass vial with 2 × 10 ml ethyl acetate which was then left to evaporate at room temperature. 1 ml hexane was added to dissolve the resi-due, for GC analysis.
Analytical methodology
Standards were prepared from analytical standards (> 98% purity) [21,22]. Gas chromatography was used for identification and quantification of extracted samples
us-ing a Varian 3300 GC with an electron capture detector (ECD). A 2 µl sample was injected onto a capillary col-umn with a BPX 5 stationary phase. The temperature was increased from 170°C at a rate of 7°C/min to 290°C and held there for 5 minutes. Injector and detector tempera-tures were 250°C and 300°C, respectively.
Quality control and quality assurance
Quality Control at PENTECH included:
• Duplicate sampling and analysis of one site at least once per sample run. Duplicate samples were run after eight samples had been injected.
• A reagent blank and a laboratory control sample (LCS) run with each set of samples. Both were subjected to the same analytical procedure as those used on the study sam-ples. The LCS was spiked with the target analytes at a
con-Table 1: Sampling points in the three study areas
Hex River Valley E* River point high up the valley, towards the top of the production area
F River point in the middle of the river's course through the valley, at densely agricultural area G River point at lowest end of the valley, after confluence with a fresh river from pristine area L* River point between F and G
M* River point – between E and F, before discharge of Bdr
Ar Farm reservoir near vineyards containing spring and mountain water Br Farm reservoir containing mountain water near vineyard
Cdr Open surface drain (1 m); drains superficial vineyard run-off
Bdr Closed surface drain (1 m); drains vineyard run-off from farm and from neighbouring farms. Dd Open farm dam receives water from the Hex River
H Shallow well (5 m deep), containing groundwater used for domestic consumption
J Tap at Irrigation Board offices: representing potable water supply to the valley from distant mountain dam close to Ceres
K* Point on another river near F
Grabouw / Vyeboom G1d Dam receives irrigation drainage, flows into Palmiet river G2d Farm dam, water pumped from Palmiet.
G3 River point (Palmiet) in midst of intensive agriculture G4 River point lower in the course of the Palmiet
G5d Dam receiving water from Palmiet river, other dams and irrigation run-off; purified for domestic use. G6b Well (in Vyeboom) used by farmers for domestic use, 30 m in depth
G7* A stream flowing from agricultural area in Vyeboom into the Theewaterskloof Dam (supplies just over 50% of Cape Town's drinking water). The stream is part of the dam when the dam is full.
G8t Tap water using output of G5d
G9 River point on Palmiet after joining Krom
Piketberg P1b Well (depth = 100 m) in intensive farming area; used for domestic water supply P2d Dam receiving well and surface water but near the top of the mountain P3b Well (depth = 70 m) in intensive farming area; used for domestic water supply
P4r Stream running down the mountain from P2d through Moravian Mission and into the Berg River. Used for domestic consumption.
P5r Site on Berg River mid-way further on from P4r
P6r Site on Berg River at pumping station providing municipal water P7b Well (depth = 100 m) on wheat farm on the plain below the mountain. P8r Tap at water purification scheme at Wittewaters (Berg River)
centration range expected for the samples in deionized water.
• Recoveries < 70% or > 130% for LCS prompted investi-gation and, if necessary reanalysis.
• Mixed standards injected prior to a sample run and at the end. Peak shape, resolution and response evaluation by comparison with previous chromatograms was done to
ensure optimal performance of the entire analytical system.
Quality Assurance was with the GLP-accredited Agricul-tural Research Council (ARC) and SF laboratories. Eleven (4 Piketberg, 2 Grabouw and 5 Hex River) samples sets were forwarded to the SF laboratory and two (Hex River) to the ARC, including one (Hex River) set to both labora-tories. One set each to both laboratories included a
dupli-Table 2: Quantification limits for endosulfan
Isomer Concentration of Standard Used (µg/L)
Empirical Mean Value (µg/L) Empirically Derived Limit (µg/L) EPA Limit (µg/L) [21]
Alpha-endosulfan 0.171 0.103 0.11 0.030
Beta-endosulfan 0.182 0.206 0.13 0.030
Endosulfan sulphate 0.266 0.290 0.13 0.030
* Empirically-derived quantification limit = 2 x Std Deviation of 7 samples of low concentration of respective standard
Table 3: Endosulfan levels detected in Hex River Valley
Date Sites and Concentration in µg/L
E F G Cdr Bdr Ar Br Dd H J K L M
11/2/98 nd 0.24 nd nd 0.19 0.44 0.16 nd ns ns ns ns ns 18/2/98 nd 0.32 nd nd 0.37 0.11 nd nd ns ns ns ns ns 25/2/98 nd 0.24 nd nd 0.18 (0.08) nd nd ns ns ns ns ns 4/3/98 nd 0.29 nd nd 2.22 0.28 0.204 nd ns ns ns ns ns 11/3/98 nd 0.16 nd (0.07) 1.53 0.16 nd nd ns ns ns ns ns 18/3/98 nd 0.22 nd nd 1.81 0.14 nd nd ns ns ns ns ns 25/3/98 nd 0.20 nd nd 1.10 (0.08) nd nd ns ns ns ns ns 22/4/98 nd 0.26 nd nd 0.43 nd nd nd nd ns ns ns ns 12/5/98 nd nd nd nd (0.04) nd nd nd nd ns ns ns ns 19/5/98 nd (0.06) (0.03) nd 0.23 0.06 ns nd nd ns ns ns ns 12/8/98 (0.03) (0.04) nd nd (0.03) (0.02) 0.20 nd nd ns ns ns ns 23/9/98 (0.03) 1.56 nd ns (0.01) (0.02) ns 0.2 nd (0.03) nd nd ns 21/10/98 nd (0.04) 0.264 ns nd 0.19 (0.09) (0.05) 0.23 nd nd ns ns 12/11/98 nd nd nd ns 0.13 nd nd nd nd nd ns nd ns 18/11/98 nd nd nd ns 0.58 nd (0.06) 0.58 nd nd 0.4 nd ns 13/1/99 nd nd nd ns ns nd nd 0.25 0.89 ns ns ns ns 24/2/99 nd 1.02 0.45 ns 1.84 nd 0.51 0.47 nd 0.15 ns 0.37 ns 17/3/99 ns 1.25 0.19 ns 3.86 1.02 nd 0.35 nd 0.62 ns ns ns 07/4/99 ns 0.54 nd ns 0.79 nd nd (0.09) nd nd ns ns ns 20/4/99 0.35 0.29 (0.05) ns 1.48 ns 0.79 (0.08) nd ns ns ns ns 26/4/99 0.47 0.27 nd ns 0.59 nd ns 0.2 ns ns ns ns ns 13/5/99 (0.02) (0.03) ns ns (0.03) nd ns nd ns 0.43 ns ns nd Mean (SD) 0.05
(0.13) 0.32 (0.42)
0.05 (0.12)
0.006 (0.021)
0.830 (0.988)
0.124 (0.235)
0.112 (0.214)
0.103 (0.17)
0.086 (0.250)
0.154 (0.24)
0.133 (0.23)
0.0925 (0.185)
0 (0)
N 20 22 21 11 21 21 18 22 13 8 3 4 1
% positive samples*
25 82 24 9 95 57 39 41 15 50 33 25 0
cate sample of Bdr, with one falsely labelled (I). Additionally, all three laboratories analysed a set of seven samples from Bdr (Hex River).
Samples for the SF laboratory were stored at 5°C and sent within 24 hours, while that for the ARC were couriered in polystyrene containers.
The SF laboratory used solid phase and the ARC liquid-to-liquid extraction. The ARC laboratory used a 2 m 3% OV-17 column and the SF laboratory, a DB1 column. All three laboratories use GC methods with Electron Capture De-tectors (ECD) but with different columns and tempera-ture programmes. This served to confirm pesticide identification. No confirmation with another detector was possible at PENTECH because of the lack of a second detector.
The results of the QA analyses [18], suggested that the lab-oratory analytical procedures followed in this study were able to achieve adequate precision and inter-laboratory agreement, consistent with normative practice for such strategies.
Results
The quantification limit (empirically-derived quantifica-tion limit = 2 x Std Deviaquantifica-tion of 7 samples of low concen-tration of respective standard for endosulfan analyses) at PENTECH was 0.1 µg/L (Table 2).
Endosulfan data are quoted as the sum of isomers I and II plus endosulfan sulphate, unless otherwise specified. En-dosulfan concentrations are expressed as µg/L, because of the different molecular weights of the isomers and endo-sulfan sulphate.
Field results
Hex River
Table 3 lists and summarises endosulfan levels and the number of detections in the Hex River region.
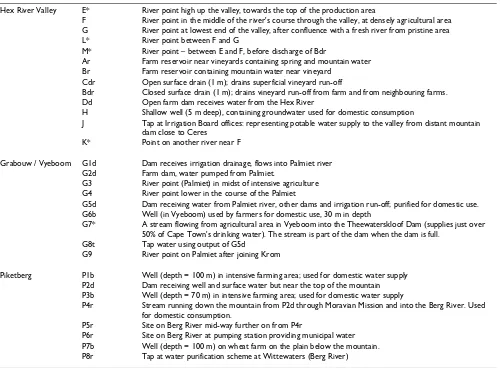
Bdr, the drain that receives sub-surface run-off from a number of different farms, consistently produced the highest detections. There were virtually no detections in the other drain Cdr, which dried up completely towards the end of the study.
The dam (Dd) had little contamination before September 1998, but consistent detections thereafter. This might have been due to the decreased water level resulting from irrigation, thereby concentrating chemicals released from sediments, especially endosulfan, with a soil half-life of 120 days and sorption coefficient (Koc) of 17.52 L/g [23]. This explanation was, however, not supported by evi-dence of any significant pH changes in the dam water due
to chemical release. The detections did correspond tempo-rally with endosulfan spraying in the region.
Both reservoirs (Ar and Br) were erratically contaminated, generally at low levels.
River detections (points E, F and G, Table 3) appeared to peak in mid-valley (F) and to be diluted in the lower valley (point G) after confluence with a tributary. Howev-er, point L, which lies between F and the confluence point, had similar levels of pesticide as G, suggesting that dilu-tion occurs before L. Site L was, however, sampled only four times. There were no obvious point sources (e.g. pesticide mixing stands) identified along the course of the river (although a mixing stand was sited some 30 m from the river at L). No inference could be drawn on site K, ly-ing on a river that joins the Hex River, because it was sam-pled only three times with endosulfan detected in one sample.
Detections during the spraying months, September to mid October (endosulfan sprayed 1–2 times during this peri-od), were low in all the sites. Subsequent irrigation (Sep-tember to May), especially during January to March (about 125 mm per month), appeared to be associated with enhanced detection because higher endosulfan levels were found during February to April 1999 at most sites. Raised levels were also found in F and Bdr during the same period in 1998. Raised levels during January-April could also have been due to rainfall triggers on 10,16 February; 7, 22 March and 21 April in 1998 and 9, 17, 25, 27 Janu-ary and 9 and 19 March in 1999. There were detections in drinking water sources (H) and (J).
In summary, low-level endosulfan detections were wide-spread in the Hex River region. Bdr and F (the mid-point of the river) were clearly "hot-spots" with regularly higher levels than other sites. Of the three mechanisms which could explain pesticide movement (rain washout, irriga-tion washout and spray activities), irrigairriga-tion and rainfall washout appear to be the most important although there is some temporal relationship to spraying. The effect is demonstrated in Figure 5 showing endosulfan detected in Bdr.
Piketberg
Table 4 presents total endosulfan levels for Piketberg, and also provides a summary of the detections.
Figure 5
Endosulphan levels in sampling point, Bdr: a sub-surface vineyard drain in the Hex River valley Rainfall Trigger (> 10 mm over 24 hrs or > 15 mm over 48 hrs)
0 0.5 1 1.5 2 2.5 3 3.5 4
Conc
e
n
tra
ti
on (ug/
L)
11/2/98 25/2/98 11/3/98 25/3/98 12/5/98 12/8/98 21/10/98 18/11/98 24/2/99 07/4/99 26/4/99
Sample date
irrigation
irrigation
spraying
Table 4: Endosulfan levels detected in Piketberg
DATE Sites and Concentration in µg/L
P1b P2d P3b P4r P5r P6r P7b P8t
13/5/98 0.13 nd nd (0.02) nd nd ns ns
20/5/98 ns nd ns nd nd nd nd nd
1/7/98 nd (0.09) nd nd nd nd nd nd
2/9/98 nd 0.12 nd (0.01) (0.04) nd (0.02) ns
7/10/98 (0.05) 0.24 0.249 nd nd (0.07) (0.01) 26.3 11/11/98 0.13 0.20 (0.01) 0.20 0.07 0.25 1.15 0.06
25/11/98 nd nd nd nd nd nd nd nd
27/01/99 nd nd nd nd 1.05 ns nd 1.123
17/02/99 0.47 0.67 nd 0.18 0.1 nd 0.21 (0.09)
10/03/99 0.44 0.13 nd 0.36 0.34 ns 0.59 0.16
31/03/99 nd nd nd 0.24 nd ns nd nd
22/04/99 nd (0.08) (0.08) nd nd ns 0.27 nd
28/04/99 nd nd nd nd nd nd nd ns
Mean (SD) 0.10 (0.17) 0.118 (0.185) 0.03 (0.07) 0.078 (0.123) 0.123 (0.294) 0.04 (0.088) 0.19 (0.35) 2.774 (8.277)
n 12 13 12 13 13 8 12 10
% positive samples *
42 54 25 46 38 25 50 50
ns = Not sampled; nd = not detected (no discernable peak, less than 0.01 µg/L; () = less than quantification limit; * positive samples = samples in which endosulfan was detected (including those below the quantification limit)
Table 5: Endosulfan levels detected in Grabouw
DATE SITES & CONCENTRATION in µg/L
G3r G4r G7d G1d G5d G2d G8T G6b G9r
23/4/98 (0.01) nd (0.09) (0.06) (0.08) 1.08 ns nd ns 7/5/98 nd nd (0.09) 0.32 (0.09) 0.81 (0.09) ns ns
27/5/98 (0.06) 0.59 nd 0.24 nd 1.78 nd ns ns
29/7/98 nd nd nd nd nd 0.16 ns ns ns
6/9/98 nd nd nd (0.03) 0.70 (0.05) (0.07) ns ns
12/10/98 nd 0.10 0.20 (0.07) nd 0.10 nd ns ns
17/11/98 0.18 0.98 0.90 1.09 1.61 4.41 0.49 ns ns
2/12/98 0.62 nd 0.82 0.88 0.79 9.11 0.54 ns ns
18/1/99 0.50 1.09 1.14 0.34 1.2 5.84 0.59 0.26 ns
18/2/99 0.30 1.38 ns 0.96 0.50 ns 0.80 ns ns
03/3/99 0.47 (0.03) 0.54 0.56 0.63 9.50 1.06 ns ns
24/3/99 0.91 nd 0.91 nd 0.45 6.44 1.77 nd ns
15/4/99 0.55 nd 0.15 0.16 0.50 1.85 0.88 ns 0.29
23/4/99 nd 0.27 nd nd 0.21 ns 0.17 ns ns
05/5/99 nd nd nd nd 0.10 nd ns nd nd
Mean (SD) 0.24 (0.299) 0.296 (0.476) 0.35 (0.42) 0.31 (0.38) 0.46 (0.48) 3.16 (3.5) 0.538 (0.532) 0.065 (0.13) 0.145 (0.205)
n 15 15 14 15 15 13 12 4 2
% positive samples*
60 58 64 73 80 92 83 25 50
1998 and 18–20 April 1999) did not enhance contamination.
Endosulfan in P8t was substantially raised in October 1998, coinciding with peak spraying (one-two times) in surrounding fruit and grape growing areas. Endosulfan levels also peaked in two of the wells (P1b and P7b) short-ly after the spraying period, suggesting movement through the soil after application.
Endosulfan in the two Berg River sites (P5 and P6) was lower than the Hex River, although one site, P6, was not sampled consistently due to inaccessibility. Higher levels in January 1999 could partly reflect applications upstream in fruit and wine farming areas.
Detections in the dam (P2d) on occasion corresponded with those in the connecting stream (P4) lower down the water course.
Grabouw / Vyeboom
Table 5 presents total endosulfan levels detected in Grabouw, and also summarises the results.
Detection of endosulfan in all sites was consistent with the timing of spraying activities on farms in the area, with endosulfan levels being raised in November after the Oc-tober spray and during January to March 1999 after the December spray. The latter period also corresponds with maximum irrigation practices in the area. Regular trigger rains during May-December 1998 and January, April-June and October-December 1999 also enhances endosulfan levels.
The time and level of endosulfan detected in the two sites on the Palmiet River was broadly similar.
Table 5 shows that the four dams sampled in the area, were consistently and relatively highly contaminated compared to other study sites. Raised levels in dams were measured well beyond the period of application. pH data did not suggest any mobilisation of sediments. Davies [15] also previously identified endosulfan as a common contaminant of dams in the Grabouw region.
Sites supplying drinking water yielded fairly consistent low levels of endosulfan. Particularly high levels for the dam (G2d) that supplies water to one household were noted. There was also intermittent presence of endosulfan in the stream (G7d) feeding the Theewaterskloof Dam supplying drinking water to Metropolitan Cape Town.
Overall number of samples with endosulfan
Table 6 summarises the number of samples in which en-dosulfan was detected above the water quality criterion (0.9 µg/L) of the Inland California Surface Water Plan [CAISWP, [24]], and those above and below the study quantification limit and EEC single pesticide limit (0.1
µg/L), in relation to study area and ground and surface water. Endosulfan was found most frequently in Grabouw, 72 (69%) out of 104 samples compared to Hex River, 85 (46%) out of 184 samples and Piketberg, 37 (39%) out of 94 samples (Table 6). Both ground and sur-face water sites regularly exceeded the European Commu-nity (EEC) [25] water standard (0.1 µg/L) used universally for all pesticides. Twenty-three percent of all samples (n = 194) exceeded the less stringent CAISWP [24] water qual-ity criterion (0.9 µg/L).
The slightly higher frequency of endosulfan detected in Grabouw compared to Hex River and Piketberg might be explained by the more frequent rainfall and the higher levels of spraying with endosulfan during the irrigation period.
Table 6: Number of samples in which endosulfan was detected in the three areas sampled, and in groundwater and surface water.
Endosulfan, area and number of samples in which endosulfan was detected (percentage)
LEVEL ENDOSULFAN
HEX RIVER PIKETBERG GRABOUW TOTAL
ALL 85 (46) 37 (39) 72 (69) 194 (51)
> QL, EEC 60 (33) 24 (26) 59 (57) 143 (37)
> CAISWP 11 (6) 4 (4) 30 (29) 143 (37)
Groundwater Surface Water
ALL 17 (32) 177 (47)
>QL, EEC 12 (23) 131 (40)
> EEC 7 (14) 38 (12)
Although the results are based on relatively few ground-water sites and samples (only five sites in the three study areas, totalling fifty-three samples over the study), detec-tions of endosulfan appear lower for groundwater (23%) compared to surface water (40%).
It is also worth noting that the SF laboratory sporadically detected a number of other pesticides commonly used in deciduous fruit farming in both the Hex River and Grabouw/Vyeboom areas. These detections (of azinphos-methyl, fenarimol, iprodione, deltamethrin, penconazole and prothiofos) occurred at times more or less consistent with usage of these agents in the industry, and at relatively low levels (below 2 µg/l) although not as low as detec-tions achieved at PENTECH. However, their presence in the samples adds consistency to the picture obtained and to the construct validity of the overall results.
Discussion
This study shows evidence of consistent low-level endo-sulfan in rural water sources in the Western Cape and war-rants greater attention to establishing mechanisms for pesticide surveillance of water sources in South Africa. That nineteen of the contaminated sites were drinking or domestic water sources is of particular concern. Compari-son of the levels obtained to some human health guideline/standard would therefore be important. How-ever, only two endosulfan drinking water standards (EEC, CAISWP) are available, with the EPA, WHO and South Af-rica currently having no endosulfan standard [26–28]. With regard to aquatic safety the guideline is 0.003 µg/L in Australia [29] while in South Africa [28] the chronic effect
value is set at 0.01 µg/L and the acute effect value, 0.02 µg/ L.
Table 7 shows a modelling of daily intake of pesticides for study populations using selected sampling points for drinking water. The modelling assumes two scenarios: a worst case scenario where drinking water concentrations are characterised at the highest concentration detected at the site; and a scenario where the concentrations found at each site are averaged using a root mean square conver-sion. These are then used to estimate total daily intake of pesticide and compared to published acceptable daily in-takes (ADIs) [30] to calculate a percentage of ADI derived through water consumption. Estimates which were deter-mined assuming that the average person consumes 2 L of water per day and weighs 60 kg, were low when compared to WHO acceptable daily intake. Drinking water intake is thought to pose a health risks if it exceeds 1 to 10% of ADI. Only the peak estimate for the site providing purified water to the West Coast exceeded 10%, while the average estimates of this site was also the only one that exceeded 1%. It is therefore reasonable to infer that these levels are not of immediate concern. However, it should be noted that the calculations in Table 7 do not take account of vul-nerable groups such as children who have a higher con-sumption per kg body weight.
Nonetheless, thresholds for concern are being continually revised downward as more empirical evidence emerges. The presence of endosulfan, which has class two human toxicity, very high aquatic toxicity [29] and is a known endocrine disruptor with estrogenic effects comparable to estradiol [31] warrants attention.
Table 7: Modeling of daily intake of endosulfan for study populations using selected sampling points for drinking water (µg/L)
AREA Point Peak concentration (µg/L)
Daily intake* based on peak Root mean square concentration
(µg/L)
Daily intake* based on root mean square concentration
(µg/kg) %ADI (µg/kg) %ADI
ENDOSULFAN
Grabouw G6 0.26 0.009 0.14 0.13 0.004 0.07
G7 1.14 0.038 0.63 0.53 0.017 0.30
G8 1.77 0.059 0.98 0.74 0.025 0.41
Piketberg P1 0.44 0.015 0.24 0.15 0.005 0.09
P3 0.25 0.009 0.14 0.31 0.010 0.17
P4 0.36 0.012 0.20 0.14 0.005 0.09
P7 0.27 0.009 0.15 0.22 0.007 0.12
P8 26.3 0.877 14.6 10.7 0.360 6.00
Hex River J 0.62 0.021 0.34 0.27 0.009 0.15
H 0.89 0.030 0.49 0.25 0.008 0.14
A few studies have previously detected endosulfan in wa-ter sources [13,15,24,32–34] and the levels found in this study are consistent with the range (0.1–100 µg/L) found in groundwater [24,32] and surface water [33] in those studies. Pesticide detections in this study, however, appear to be more frequent than found in previous studies, prob-ably a function of increased frequency of sampling [35]. Endosulfan spraying in Grabouw ranges from 0.5–1.5 kg active ingredient per hectare.
The findings in this study contrast with those found by Weaver [17] in the Hex River Valley in 1990, where no evidence was found for pesticides reaching ground water. However, that study analysed a different set of pesticides, made use of less sensitive analytical techniques and fo-cused primarily on groundwater. Detections in both sur-face and groundwater (including sampling point H, which was identical in the two studies) were in any case found to be low in this study. However, of importance is that detections are not confined to the Hex River but are ubiquitous in all three study areas. Out of 382 samples, there were 37% endosulfan detections above the EU limit of 0.1 µg/L.
Endosulfan has been reported as having a low pollution likelihood [36], but other factors such as soil characteris-tics, shallow water tables and intensive spraying [24,32,37], could explain its relatively frequent detection in this study.
Endosulfan levels in all three areas were the highest and most frequent during January to March, corresponding mainly with irrigation practices, but also with rainfall events. Previously, Domagalski [35], also found irrigation to be an important trigger for both leaching and run-off events. Recently, Schultz et al. [13] found rainfall washout to increase endosulfan in the Lourens River located in the South-Western Cape (from 0.06 µg/L to 0.16 µg/L), but levels were substantially lower and detections less fre-quent, than that measured in this study and the effect of irrigation was not measured. Correlation between rainfall and endosulfan detection in our study might therefore have been influenced by irrigation patterns.
The reliance on grab sampling was a limitation in the study. Intermittent monitoring may give false estimates of true exposures, or inadequate characterisation of contam-ination patterns. For example, Domagalski [35] showed that thrice weekly sampling of surface water in the San Joaquin River Basin was more than twice as likely to iden-tify concentrations exceeding state water standards than single weekly sampling. Efforts to develop methods that sample water sources on a continuous basis, to provide an integrated assessment of water contamination by
pesti-cides, should be explored. Integrated sampling methods are, however, not practical at present.
Other limitations in the study include the use of manual grab samples, and the non-measurement of specific con-ductance and dissolved oxygen due to a lack of resources.
Conclusions
The results in the study indicate that monitoring of pesti-cide levels in South African water resources is warranted, preferably with cost-effective and practical methodolo-gies. The findings also indicate that epidemiological stud-ies investigating the health effects of endosulfan should be undertaken. Furthermore, policies aimed at reducing the potential contamination of water by pesticides need to be developed and implemented.
Competing interests
The authors are not aware of any competing interests.
Authors' contributions
AD co-ordinated the study, assisted with the design, col-lected data and drafted the manuscript. EC was responsible for the design of the analytical methods, as-sisted with the design of the study and drafting of the manuscript. LL was the principal investigator of this project, designed and organized the study and assisted in drafting the manuscript. AS was responsible for the labo-ratory analysis, assisted with data collection and drafting of the manuscript. All authors read and approved the final manuscript.
Acknowledgments
The authors wish to thank the Water Research Commission of the South African Department of Water Affairs and Forestry (DWAF) and the South African Medical Research Council for financial support for this study. The assistance of Tom Robins of the University of Michigan School of Public Health and the Fogarty Centre for International Research Development; Jannie Walters (Wenkem); Chris Dain (Zeneca); Garth Hodges (Agrevo); John Levings (Two a day co-op); Mr Watkins (Mechanical Engineering, UCT); WHO (donated WHO standards); Mr S van Niekerk and J van Zyl (Elsenberg Agricultural College); Mr A Jacobs (Infrutec); Dr O Sisulu and Dr G Joubert (CSIR); John Weaver, Kevin Pieterse and Gideon Tradouw (Watertek); Dr Tawanda Masuka and Mr Munro van der Merwe (ARC lab-oratories); Kevin Hearshaw (State Forensic laboratory); Hanlie van der Westhuizen; E Truter and M Loubscher (Department of Health, West Coast Region, Malmesbury); Kobus Hartman (UNIFRUCO); Alreta Louw (DWAF) and The Hex River Farmers association is also acknowledged.
References
1. Leslie A and Cuperus GW Successful Implementation of Inte-grated Pest Management for Agricultural Crops.Florida, Lewis/ CRC Press 1993,
2. Thrupp LA New partnerships for sustainable agriculture. Washington DC, World Resources Institute 1996,
3. Premazzi G and Ziglio G Regulations and Management.In: Pesti-cide Risk in Groundwater(Edited by: M Vighi, E Funari) Boca Raton, CRC Lewis Publishers 1995, Chapter 10:203-240
Publish with BioMed Central and every scientist can read your work free of charge
"BioMed Central will be the most significant development for disseminating the results of biomedical researc h in our lifetime."
Sir Paul Nurse, Cancer Research UK
Your research papers will be:
available free of charge to the entire biomedical community
peer reviewed and published immediately upon acceptance
cited in PubMed and archived on PubMed Central
yours — you keep the copyright
Submit your manuscript here:
http://www.biomedcentral.com/info/publishing_adv.asp
BioMedcentral
5. London L An investigation into the neurological and neurobe-havioral effects of long-term agrochemical exposure amongst deciduous fruit farm workers in the Western Cape, South Africa. Doctoral Thesis.Cape Town, Department of Commu-nity Health, University of Cape Town 1995,
6. London L and Myers JE General patterns of agrochemical usage in the Southern Region of South Africa.SA J Sci 1995, 91: 509-514
7. London L and Rother A People, Pesticide and the Environment: Who bears the brunt of backward policy in South Africa?In: Conference Proceedings: Environmental Justice and the Legal Process. Envi-ronmental Law Unit, University of Cape Town, Cape Town, South Africa and Environmental Law Centre, Macquarie Univeristy, Sydney, Australia 1998, 8. Maroni M and Fait A Health Effects in man from long-term ex-posure to pesticides. A review of the 1975–1991 literature. Toxicology 1993, 78:1-174
9. Dalvie MA, White N, Raine R, Myers JE, London L, Thompson M and Christiani DC The long-term respiratory health effects of the herbicide, paraquat, among workers in the Western Cape. Occup Environ Med 1999, 56:391-396
10. Myers JE Occupational health of farm workers.S Afr Med J 1990,
78:562-563
11. London L and Myers JE Critical issues in agrochemical safety in South Africa.Am J Ind Med 1995, 27:1-14
12. Hassett AJ, Viljoen PT and Liebenberg JJE An assessment of chlo-rinated pesticides in the major surface water resources of the Orange Free State during the period September 1984 to September 1985.Water SA 1987, 13(3):133-136
13. Schultz R, Peall SKC, Dabrowski JM and Reinecke AJ Current-use insecticides, phosphates and suspended solids in the Lourens River, Western Cape, during the first rainfall event of the wet season.Water SA 2001, 27(1):65-70
14. Greichus YA, Greichus A, Amman BD, Call DJ, Hamman DCD and Pott RM Insecticides polychlorinated biphenyl and metals in African ecosystems.1. Hartebeespoort Dam, Transvaal and Voëlvlei Dam, Cape Province, Republic of South Africa. Arch.Environ Contam Toxicol 1977, 6:371-383
15. Davies H An assessment of the suitability of a series of West-ern Cape Farm Dams as water bird habitats. MSc (Conser-vation Biology) thesis.Zoology Department, University of Cape Town
1997,
16. Grobler DF A note on PCBs and chlorinated hydrocarbon pesticide residues in water, fish and sediment from the Olif-ants River, Eastern Transvaal, South Africa.Water SA 1994,
20(3):187-194
17. Weaver JMC A preliminary survey of pesticide levels in groundwater from a selected area on intensive agriculture in the Western Cape. Report to the Water Research Commission.Pretoria, Division of Water Technology, CSIR 1993, 18. London L, Dalvie MA, Cairncross E and Solomon A The quality of
surface and groundwater in the rural Western Cape with re-gard to pesticides.WRC Report No: K5/795/00. Pretoria, WRC 2001, 19. World Wild Life Fund Known and suspected hormone
disrup-tors list.Canada, Toronto: World Wild Life 1997,
20. Schettler T, Solomon G, Burns P and Valenti M Generations at Risk. How Environmental Toxins may affect reproductive health in Massachusetts.Cambridge: Greater Boston Physicians for Social Responsibility, Massachusetts Public Interest Research Group (MASSPIRG) Education Fund 1996,
21. EPA Solid phase extraction method 3535.Washington, DC, U.S Environmental Protection Agency 1995,
22. EPA Organochlorine pesticides by capillary column gas chro-matography method 8081A.U.S Environmental Protection Agency Washington, DC 1995,
23. McGregor F The mobility of endosulfan and chlorpyrifos in the soil of the Hex River Valley.Thesis submitted in partial fulfilment of the requirements for the degree of Masters of Science in Environmental Ge-ochemistry. Department of Geological Sciences, University of Cape Town
1999,
24. California Environmental Protection Agency Sampling for pesti-cide residues in California well water. 1996 update of the well inventory database. California. California Environmental Protection Agency. Department of pesticide regulation 1997,
25. Council of the European Community Directive relating to the quality of water intended for human consumption (80/778/ EEC).EEC 1980,
26. EPA Guidelines for drinking water quality. 202, 260–7572. Washington, DC U.S Environmental Protection Agency 1992,
27. WHO Guidelines for Drinking Water Quality. Recommenda-tions. Geneva, WHO 1993, 1:
28. DWAF South African water quality guidelines.Pretoria, DWAF
1996, 1–7:
29. Dallas HF and Day JA The effect of water quality variables on riverine ecosystems: A review. Report prepared for the Wa-ter Research Commission.Rondebosch, Freshwater Research Unit, University of Cape Town 1993,
30. International Programme on Chemical Safety (IPCS) Summary of Toxicological Evaluations performed by the joint WHO/ FAO meeting on pesticide residues (JMPR). Geneva, WHO
1993,
31. Soto AM, Chung KL and Sonnenschein C The pesticides endosul-fan, toxaphene, and dieldrin have estrogenic effects on hu-man estrogen-sensitive cells. Environ Health Perspect 1994,
102(4):380-383
32. Funari E, Donati L, Sandroni D and Vighi M Pesticide levels in groundwater: value and limitations of monitoring.In: Pesticide Risk in Groundwater (edited by M Vighi, E Funari) Boca Raton CRC Lewis Publishers, Boca Raton 1995, Chapter 1:3-44
33. Oskam G, Van Genderen J, Hopman R, Noij THM, Noordsij A and Piuker LM A general view of the problem, with special refer-ence to the Dutch situationWater Supply 1993, 11:1-17 34. Espigares M, Coca C, Fernandez-Crehuet MO, Bueno A and Galvez R
Pesticide concentrations in the waters from a section of the Guadal river basin, Spain. Environ Toxicol Water Qual 1997,
12:249-256
35. Domagalski J Results of a prototype surface water network de-sign for pesticides developed for the San Joaquin River Basin, California.J Hydrology 1997, 192:33-50
36. Gustafson DI Groundwater ubiquity score: A simple method for assessing pesticide leachability.Environmental Toxicology and Chemistry 1989, 8:339-357