M E T H O D O L O G Y
Open Access
Statistical software for analyzing the health
effects of multiple concurrent exposures via
Bayesian kernel machine regression
Jennifer F. Bobb
1,2*, Birgit Claus Henn
3, Linda Valeri
4and Brent A. Coull
5Abstract
Background:Estimating the health effects of multi-pollutant mixtures is of increasing interest in environmental epidemiology. Recently, a new approach for estimating the health effects of mixtures, Bayesian kernel machine regression (BKMR), has been developed. This method estimates the multivariable exposure-response function in a flexible and parsimonious way, conducts variable selection on the (potentially high-dimensional) vector of exposures, and allows for a grouped variable selection approach that can accommodate highly correlated exposures. However, the application of this novel method has been limited by a lack of available software, the need to derive interpretable output in a computationally efficient manner, and the inability to apply the method to non-continuous outcome variables.
Methods: This paper addresses these limitations by (i) introducing an open-source software package in the R
programming language, the bkmr R package, (ii) demonstrating methods for visualizing high-dimensional exposure-response functions, and for estimating scientifically relevant summaries, (iii) illustrating a probit regression implementation of BKMR for binary outcomes, and (iv) describing a fast version of BKMR that utilizes a Gaussian predictive process approach. All of the methods are illustrated using fully reproducible examples with the provided R code.
Results: Applying the methods to a continuous outcome example illustrated the ability of the BKMR implementation to estimate the health effects of multi-pollutant mixtures in the context of a highly nonlinear, biologically-based dose-response function, and to estimate overall, single-exposure, and interactive health effects. The Gaussian predictive process method led to a substantial reduction in the runtime, without a major decrease in accuracy. In the setting of a larger number of exposures and a dichotomous outcome, the probit BKMR implementation was able to correctly identify the variables included in the exposure-response function and yielded interpretable quantities on the scale of a latent continuous outcome or on the scale of the outcome probability.
Conclusions: This newly developed software, integrated suite of tools, and extended methodology makes
BKMR accessible for use across a broad range of epidemiological applications in which multiple risk factors have complex effects on health.
Keywords: Multiple exposures, Mixtures, Exposure-response, Variable selection, Health risk estimation
* Correspondence:[email protected]
1Biostatistics Unit, Kaiser Permanente Washington Health Research Institute, 1730 Minor Ave #1600, Seattle, WA 98101, USA
2Department of Biostatistics, University of Washington, Seattle, WA, USA Full list of author information is available at the end of the article
Background
Estimating the health effects of several concurrent expo-sures is of increasing interest in epidemiology. For ex-ample, in environmental health interest lies in estimating the impacts of multi-pollutant mixtures, such as air pollu-tion [1], toxic waste [2], and persistent organic chemicals [3]. Although studies have traditionally focused on esti-mating the health impacts of individual exposures, it is in-creasingly being recognized that populations are exposed to a wide range of factors across multiple domains, includ-ing environmental stressors and genetic and psychosocial determinants, and that these factors should be considered in conjunction [4].
A major barrier to studying the joint effects of many exposures concurrently is the lack of established statis-tical methods and corresponding software. Estimating the health effects of environmental mixtures is challen-ging because (i) exposures often have nonlinear and non-additive (eg, interactive) relationships with health outcomes, (ii) a high-dimensional vector of exposures may lead to poorly fitting regression models as the num-ber of exposures increases relative to the numnum-ber of ob-servations in the dataset, and (iii) exposures are often highly correlated. Additionally, there are often several objectives of a multi-exposure health effect analysis, which may include estimating the overall effect of the mixture, identifying individual components that are re-sponsible for the health effects of the mixture, visualiz-ing the exposure-response function, and detectvisualiz-ing interactions among pollutants [5]. Several statistical methods have been proposed for estimating the health effects of multiple exposures, including machine learning methods such as random forests [6]; clustering methods and other dimensional reduction methods such as prin-cipal components analysis, factor analysis, and structural equation models; and regression penalization methods such as the lasso [7]. However, these methods have typ-ically addressed some but not all of the challenges and/ or scientific objectives described above. Reviews of prior methods and their limitations, as well as systematic comparisons of the performance of selected methods, have been published previously [1,8–12].
Recently, we developed a new approach for estimating the joint health effects of multivariate exposures, Bayes-ian kernel machine regression (BKMR), that simultan-eously addresses the challenges and scientific objectives described above [13]. First, through use of a kernel func-tion, this approach estimates the multivariable exposure-response function in a flexible way that allows for non-linear and non-additive effects, while adjusting for covariates including potential confounding factors. Sec-ond, the approach simultaneously incorporates variable selection on the (potentially large number of ) exposures in a way that controls for multiple testing [14]; this
enables a parsimonious representation of the exposure-response function. Third, we developed a hierarchical variable selection approach that addresses the issue of multicollinearity by first classifying highly correlated ex-posures into groups, and then simultaneously conduct-ing variable selection on the groups of correlated exposures as well as on the individual exposures within each group. In our prior methodological work describing BKMR [13, 15], we conducted a comprehensive evalu-ation of the performance of this approach. Through simulation studies based on real-world datasets, we found that (i) BKMR could well estimate exposure-response functions that included both nonlinear and non-additive effects, (ii) BKMR could identify important mixture com-ponents through variable selection, and (iii) the hierarch-ical variable selection approach could detect important groups of highly correlated exposures even in situations where individual components could not be identified. Additionally, BKMR has been applied previously in both toxicological and epidemiological studies leading to scien-tific insights that were not uncovered using standard re-gression approaches [15,16].
Several important gaps limit the applicability of statistical methods for estimating the health effects of multi-pollutant mixtures in environmental health studies. These include a lack of software applying new method-ology, data-generating scenarios with complex features (e.g., clustered outcome data), and the need for computa-tionally efficient algorithms that yield correct results in a fraction of the time. A particular challenge of studies esti-mating the health effects of mixtures is the need to visualize the high-dimensional exposure-response func-tion and to conduct inference in the presence of possible nonlinear and interactive associations of the exposures with the health outcome.
approach can substantially speed up the model fitting. All of the examples used to illustrate these methods are fully reproducible with the provided R code.
Methods
Overview of BKMR
We first provide a brief overview of BKMR. The kernel machine regression (KMR) model for a continuous out-come is given by
Yi¼h zð i1;…;ziMÞ þxi0βþϵi;
whereYidenotes the response for individuali(i= 1,…,n), zim is themth exposure variable,hdenotes the unknown exposure-response function to be estimated, βrepresents the effect of the covariates (note that xiis a vector), and the residuals ϵi~N(0,σ2) are assumed to be independent and identically (iid) normally distributed with a common variance. As described below, the effect of the exposures of interest modeled through thehfunction is allowed to be nonlinear and non-additive; the effect of the covariates could be modeled either linearly or more flexibly (e.g., by specifying a spline basis with a fixed number of degrees of freedom [DF] for one or more covariates). Additionally, if any covariates are hypothesized to interact with compo-nents of the mixture, then those covariates may be also be included inh.
For studies of multi-pollutant mixtures, the functionh may include a large number of exposures of interest, and the relationship between these exposures and the health outcome can be complex, including nonlinear associa-tions of one or more exposures, as well as possible inter-actions. Even with just a few exposures in the mixture, the combination of nonlinear and non-additive associa-tions can lead to a high-dimension exposure-response relationship. As an illustration, if one were to model each exposure in the mixture using a spline basis with three DF to allow for nonlinearity and also include all of the interaction terms, this would result in a model with 255 parameters in the case of 4 exposures, 1023 parame-ters in the case of 5 exposures, and more generally, (1 + DF)M−1 parameters in the case ofMexposures. In this setting of a high-dimensional exposure-response tion, it can be challenging to specify a set of basis func-tions (e.g., polynomial or spline terms), and fitting a model including all basis functions and their interac-tions, as illustrated above, can lead to problems with over-fitting. BKMR addresses this by using a kernel ma-chine representation for h, which regularizes the high-dimensional exposure-response function (details are in [13]). Under the kernel machine representation, rather than directly model the association of the expo-sures with the health outcome, one instead specifies a kernel function K(zi,zj) that induces correlation of
health outcomes among individuals with similar expos-ure profilesz= (z1,…,zM). In particular, the KMR model
assumes that two individuals with similar values ofz(i.e. ziclose tozj) will have similar health risks (i.e.,hi=h(zi) will be close tohj=h(zj)).
Operationally, by using the kernel machine representa-tion, the KMR model may be expressed as a mixed-effect model [19], and within a Bayesian context, prior distri-butions are placed on all of the unknown parameters. The model is fit using Markov chain Monte Carlo (MCMC). Full details of the hybrid Gibbs/Metropolis-Hastings MCMC algorithm is described in Bobb et al. (2015) [13] and the supplemental material thereof.
Incorporating variable selection
To incorporate variable selection, the kernel function may be augmented with auxiliary variables (rm, for m= 1, …, M), such that when the auxiliary parameter is equal to zero, then the corresponding exposure variable is no longer included in the model (i.e., ifrmis equal to zero then exposure zm is not selected). Fitting BKMR with component-wise variable selection yields estimates of the posterior inclusion probabilities, which provide measures of variable importance for each exposure. Alternatively, one can apply a hierarchical variable selec-tion approach, in which groups of exposures are speci-fied. In this latter scenario, BKMR estimates the posterior inclusion probability for each pollutant group, as well as posterior inclusion probabilities among pollut-ants within each group, given that the group was se-lected into the model. An example of when the hierarchical variable selection approach is useful is to address the issue of multicollinearity by placing highly correlated pollutants into the same group. This approach is evaluated and compared to the component-wise vari-able selection approach by Bobb et al. (2015) [13].
Extension to clustered outcome data
In the setting of correlated outcome data, through re-peated measures within the same person, or through in-dividuals clustered within families or communities, the BKMR model can be extended asYij=h(zij1,…,zijM) +bi + xij′β+ϵij, where Y
ij is the response for observation j within cluster (e.g., person)i, biNð0;τ2bÞ is a random intercept andϵij~N(0,σ2) are the residual error terms.
Methods for characterizing the exposure-response function
h. One example of a cross-section of interest is to visualize how a single exposure is related to the outcome when all of the other exposures are fixed to specific level (e.g., me-dian value). Similarly, one could visualize the bivariate re-lationship of two exposures with the health outcome, while fixing all of the other exposures to a specific level. These cross sections and others can be visualized using thebkmrsoftware package and are illustrated below.
In addition to visualizing the exposure-response rela-tionship, inference may be conducted on scientifically relevant summaries of interest. Here we define three such summaries, which quantify overall, single-exposure, and interactive health effects. In particular, we define the overall effect as the change in the mean outcome when all of the exposures (z1, …, zM) are fixed at their 75th
percentile as compared to when all of the exposures are fixed to their 25th percentile, with all of the covariatesx held constant. With notation, this is given by Δtotð25;75Þ
¼hðz75
1 ;…;z75MÞ−hðz251 ;…;z25MÞ, where zpm denotes the pth percentile of the mth exposure variable. A second quantity of interest is a single-exposure effect, which we define as the change in the mean outcome when a single exposure is fixed at its 75th percentile as compared to when it is fixed at its 25th percentile, when all of the other exposures are fixed at their me-dian value and all of the covariates x are held con-stant. For example, for exposure z1, this is given by
Δ1ð25;75j50Þ ¼hðz751 ;z502 ;…;z50MÞ−hðz251 ;z502 ;…;z50MÞ, and
for other exposures the quantityΔm(25, 75 |50) is defined analogously. Quantifying potential interaction is often an-other major goal of a mixtures health effect analysis. To facilitate this, we define aninteractive effectas the differ-ence in the single-exposure health effect when all of the other exposures are fixed at their 75th percentile, as com-pared to when all of the other exposures are fixed at their 25th percentile, given byΔm(25, 75 |75)−Δm(25, 75 |25). We note that the choice here of using the 25th and 75th percentiles is illustrative; these values may be modi-fied as desired, and the above summaries can be calculated using any choice of threshold. Within a Bayesian framework, inference on the parameters above is conducted by calculating posterior mean esti-mates and 95% credible intervals for any of the nu-merical summaries of interest. Inference on other functionals ofhthat set exposures to fixed values may be conducted analogously.
Probit BKMR for binary outcomes
BKMR can be extended to binary outcomes via gener-alized linear modeling. For reasons of computational efficiency for Bayesian inference, we use probit, rather than logistic, regression. The probit BKMR model is given by
Φ−1 μ i
ð Þ ¼h zð i1;…;ziMÞ þxi0β;
where Φ is the cumulative distribution function (CDF) for the standard normal distribution (Φ−1
is the probit link function) and μi=P(Yi= 1) is the probability of an event (Yiis a binary [0/1] variable).
It is well known that the probit model can be expressed using a latent normal random variable formu-lation. In particular, the probit model above can be expressed as Yi ¼hðzi1;…;ziMÞ þxi0βþei, where ei is standard normal and Yi¼IðYi >0Þ is equal to 1 if Yi
>0 and is equal to zero otherwise. Under this formula-tion, extension of the BKMR model from Gaussian out-comes to binary outout-comes is relatively straightforward. One can simply apply the MCMC algorithm derived for normally distributed outcomes with an additional step of sampling from the posterior distribution of the latentYi variables using a truncated normal distribution.
Although probit regression tends to be less common than logistic regression in many environmental health applications, it yields interpretable quantities both on the scale of the latent continuous outcome and on the scale of the outcome probability. In particular, by con-sidering the latent normal formulation above, hmay be interpreted as the relationship between the exposures and some underlying, continuous latent variable (Y∗). For example, if Y is an indicator variable for whether an individual has a particular health outcome, Y∗ could be interpreted as a latent marker of health status. Addition-ally, probit model coefficients can be converted into more familiar odds ratios using well-known formulae [20]. In particular, we have logit(μ)≈1.6 ·Φ−1(μ) so that βlogit≈1.6 ·βprobit. This approximation works well pro-vided the probability of the outcome event given the in-cluded predictors is not too close to 0 or 1.
Gaussian predictive process
Software implementation
The bkmrsoftware is implemented as an R (R Develop-ment Core Team 2017) package. It has dependencies to the following packages: dplyr, magrittr, nlme, fields, truncnorm, tidyr, MASS, and tmvtnorm. The R software and these required packages can be obtained from the CRAN website at [https://cran.r-project.org/]. Further-more, daily builds of packagebkmrare provided on the CRAN website [https://cran.r-project.org/web/packages/ bkmr/index.html]. It has been published under GPL ver-sion 2. Source code is available on GitHub at [https:// github.com/jenfb/bkmr].
The package provides a complete framework for apply-ing BKMR to conduct an analysis of the health effects of multiple exposures. The main function (kmbayes) imple-ments a MCMC sampler to fit a BKMR model and in-cludes the following features:
the outcome may be either continuous or binary (specified using thefamilyargument)
option to include a random intercept to account for clustered or repeated measures outcome data (id
argument)
option to fit the model with or without variable selection (varsel)
option to apply hierarchical variable selection (groups)
implements a Gaussian predictive process approach to speed up model fitting for large sample sizes (knots)
option to change default settings for the MCMC algorithm (control.paramsargument)
After fitting the BKMR model, a suite of post-processing functions are available, including functions to:
provide a parsimonious summary of model output (printandsummarymethods)
extract estimates of the posterior inclusion probabilities, which provide measures of variable importance for each exposure (ExtractPIPs
function)
extract summaries of posterior distributions of model parameters, including posterior mean, standard deviation, and quantiles (ExtractEstsfunction)
obtain scientifically relevant summaries of the multivariable exposure-response function (these functions are illustrated in detail through the continuous outcome example below).
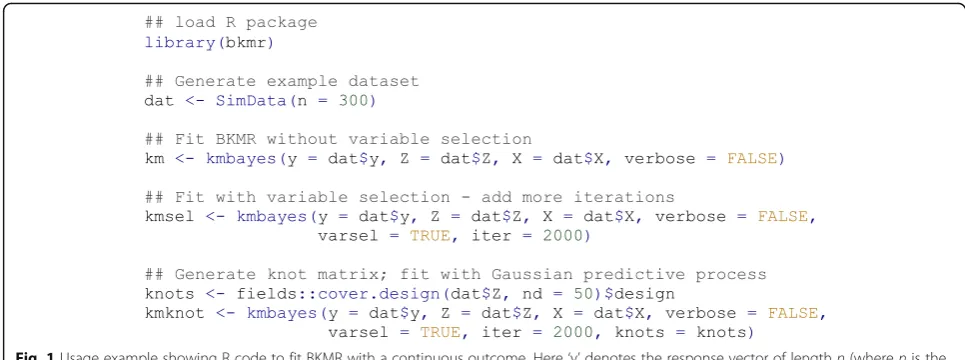
Example code illustrating the mainkmbayesfunction is shown in Fig.1. Additional details on the BKMR im-plementation are available in the package overview guide [https://jenfb.github.io/bkmr/overview.html].
Practical considerations
Inference based on BKMR is contingent upon conver-gence of the MCMC algorithm. Several approaches can be used to monitor convergence, including visually inspecting the trace plots of model parameters, or more formal methods such as the Gelman-Rubin diagnostic [23]. The package overview guide [https://jenfb.github. io/bkmr/overview.html] provides details on how to mod-ify the tuning parameters for running the MCMC algo-rithm in order to speed up convergence.
Additionally, it is good practice to evaluate the sensi-tivity of results to the choice of prior distribution specifi-cation. This can be done in the R package by changing the default settings. Of note, we have found that when conducting BKMR with variable selection, the magni-tudes of the posterior inclusion probabilities can be sen-sitive to the choice of the prior distribution on the rm parameters (though in our experience the relative order-ing of the posterior inclusion probabilities has tended to remain stable) [15]. We therefore recommend varying the specifications of the prior distributions for these rm parameters; additional guidance is given in the overview guide [https://jenfb.github.io/bkmr/overview.html], in-cluding an approach for incorporating prior knowledge on the degree of smoothness of the exposure-response function.
Results
We illustrated the above approaches using two example datasets. For the first example, we applied BKMR to a simulated dataset that was generated as part of the 2015 workshop hosted by the National Institute for Environ-mental Health Sciences (NIEHS), titled “Statistical Ap-proaches for Assessing Health Effects of Environmental Chemical Mixtures in Epidemiology Studies.” The goal of the workshop was to compare statistical methods by applying them to common datasets developed by epide-miologists and toxicologists based on real-world data ap-plications [24]. A key feature of the workshop was that it used simulated datasets generated by scientists who did not develop the statistical methods being compared, which provides an objective benchmark for evaluating the methods’ performance. Applying BKMR in this setting illustrates the performance of the method in the context of a highly nonlinear, biologically-based dose-response function. For the second example, we considered a simulated dataset with a larger number of exposures and a dichotomous outcome, in order to illustrate probit BKMR.
Continuous outcome example
and a single covariate x in 500 individuals. We applied BKMR to fit the model E[Yi] =h(zi1,…,zi7) +βxi, where Yidenotes the response for individual i, h denotes the unknown exposure-response function to be estimated, and β represents the effect of the covariate. Reprodu-cible code along with complete results from the analysis is available at [https://jenfb.github.io/bkmr/SimData1.html]; here we describe select results.
As mentioned above, several functions are provided for processing the model output. Variable selection yields posterior inclusion probabilities (PIPs), whose values range from 0 to 1 and whose magnitude indicates relative variable importance. In the simulated example, the estimated PIPs were close to 0 for exposuresz3and z6and were 1 for the remaining exposures. To illustrate
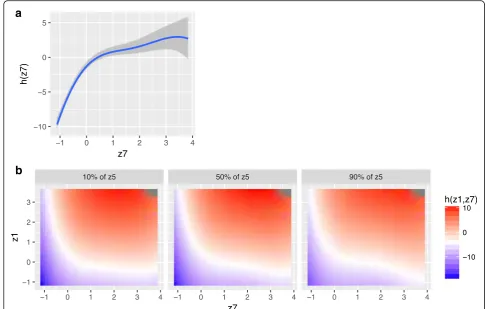
the methods for visualizing the multivariable exposure-response function, we explored different cross-sections (Fig. 2). For example, Fig. 2a shows the (covariate-ad-justed) association of z7with the outcome, which
indi-cates a nonlinear relationship with a steeper slope at lower levels of exposure that appears to plateau at higher exposure levels. Figure2bshows the joint association of z1and z7with the response at different percentiles of a
third exposure (z5), which is useful for visualizing
poten-tial three-way interactions, though in this example the similar pattern in association across levels of z5suggests
a lack of evidence of three-way interaction.
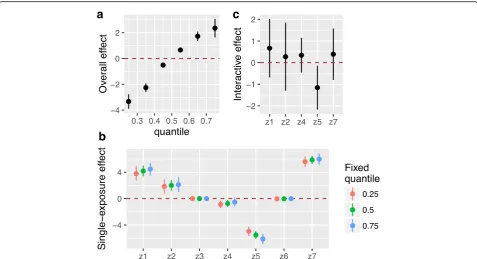
We additionally calculated statistics summarizing the scientifically-relevant features of the exposure-response function described above (Fig. 3). Estimates of the over-all effect of the mixture (3a) revealed that increasing levels of joint exposure were associated with higher levels of the outcome. To characterize the contribution of individual exposures to the overall effect, single-ex-posure effect estimates (3b) suggested that increases in
exposure to z7, z1, and z2 were associated with higher
levels of the outcome and that increases in exposure to z5 and z4 were associated with lower levels of the
out-come. The single-exposure estimate for z5was larger in
magnitude when all of the remaining exposures were fixed at their 75th percentile as compared to when they were fixed at their 25th percentile, indicating possible interaction ofz5with one (or more) of the other
expos-ure variables. To further explore this possibility, we cal-culated interactive effects (3c), which suggested that this interaction is statistically significant.
Comparisons of our results to the true exposure-re-sponse function used to generate the simulated dataset [26] demonstrate that BKMR was correctly able to iden-tify which exposures were truly associated with the out-come and the direction of these associations. In addition, we were able to identify the nonlinear exposure-response relationship of the individual predictors, and to well-ap-proximate the full exposure-response function that in-cluded both nonlinear and non-additive associations (See [https://jenfb.github.io/bkmr/SimData1.html]). Using the approximate, Gaussian predictive process method led to a reduction in the runtime of 49% when 100 knots were used (from 0.137 to 0.070 s per MCMC iteration) and a reduction in the runtime of 74% when 50 knots were used (to 0.036 s per iteration), without any substantial decrease in accuracy in estimating the exposure-response function in this example. Computations were performed using a 1.7 GHz processor with 8 GB of memory.
Binary outcome example
To illustrate probit BKMR, we simulated a dataset that included 30 exposure variables for a sample size of n= 200. The binary outcome depended on quadratic terms of four of the exposures and on a linear interaction term Fig. 1Usage example showing R code to fit BKMR with a continuous outcome. Here‘y’denotes the response vector of lengthn(wherenis the number of observations);‘Z’is then-by-Mexposure matrix, whereMis the number of exposure variables included in the exposure-response function
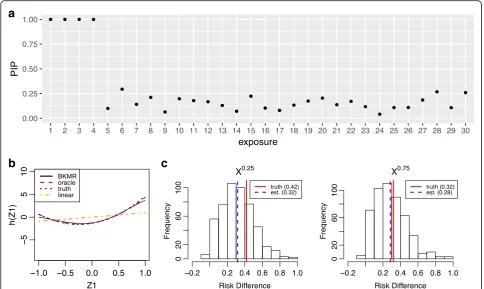
between two of these. Reproducible code and detailed results for this example are available at [https://jenfb. github.io/bkmr/ProbitEx.html]; select results are shown in Fig. 4. Posterior inclusion probabilities indicate that BKMR was correctly able to identify the variables in-cluded in the exposure-response function (4a) and to identify the quadratic exposure-response function with-out assuming this relation a priori (4b). As discussed above, the probit BKMR model yields interpretable quantities on the scale of the latent continuous outcome and on the scale of the outcome probability. Here, the u-shaped relationship of z1 suggests that both higher
and lower levels of exposure may be associated with higher levels of the latent continuous outcome as com-pared to moderate levels of exposure.
We also illustrate how one can use the predicted prob-abilities from probit BKMR to compute quantities of interest, such as the risk difference (4c). For example, the point estimate (95% posterior credible interval) for the risk difference comparing the probability of the bin-ary outcome when exposure 2 is at its 75th percentile versus its 50th percentile, for all of the remaining expo-sures fixed at their median value, was 0.42 (0.02, 0.73)
when the single confounder x is fixed at its 25th per-centile and was 0.32 (0.01, 0.72) when the confounder x is fixed at its 75th percentile. (The true risk difference was 0.32 and 0.28, respectively.) This indicates evidence of a statistically significant association between increas-ing levels of exposure 2 from moderate to high with an increased absolute risk of the outcome that persists across levels of confounder x.
Discussion
The bkmr software package provides a general, open-source implementation of BKMR, a new and flexible ap-proach for estimating the joint health effects of simul-taneous exposure to multiple concurrent risk factors. The model specification can accommodate a broad range of data application scenarios common in environ-mental health, including continuous or binary outcomes, repeated-measures or clustered outcome data, and highly correlated exposures. A suite of functions is pro-vided to process model output, addressing scientific questions of interest on features of the multivariate exposure-response relationship.
a
b
−10 −5 0 5
−1 0 1 2 3 4
z7
h(z7)
A key feature of BKMR is the estimation of the multi-variable exposure-response function, which may often be high-dimensional in studies of the health effects of en-vironmental mixtures. However, it can be challenging to conduct inference in this setting. Accordingly, we proposed several numerical summaries of the exposure-response function to allow investigators to estimate overall effects of the mixture, single-exposure health ef-fects, and interactive effects. Rather than require quan-tities to correspond to specific parameters of a regression model (e.g., coefficients on main effect or interaction terms), as is often done in statistical modeling, the numer-ical summaries we proposed can be estimated regardless of the specific form of the regression model. Thus, they are broadly applicable to exposure-response relationships estimated from other (i.e., non-BKMR) statistical models. As with any dimension reduction technique, care is war-ranted when interpreting summary measures since they could mask potentially complex features of the data. For example, a single-exposure summary that compares health outcomes at high versus low exposure could appear null if there is a u-shaped relationship; likewise, an apparent null overall association may be observed if half of the exposures are positively associated and half are nega-tively associated with a similar magnitude. It is therefore
recommended to explore a range of summary measures and to visualize different cross-sections of the exposure-response surface, together with the PIP, or variable im-portance, scores.
The MCMC algorithm we implemented for fitting BKMR employs several tricks to speed up the computa-tion. First, rather than update the subject-specific effects of the mixture hi within the main function used to fit BKMR, we marginalize the posterior distribution over these parameters [13]. These subject-specific effects are typically not themselves of scientific interest; rather, in-vestigators often desire estimates of the general form of the exposure-response function, which can be visualized and summarized via the post-processing functions de-scribed above. Second, the implementation for binary outcomes utilizes the latent normal specification of pro-bit regression, which has computational advantages for Bayesian inference. Third, the software allows for apply-ing a Gaussian predictive process approach [21], origin-ally developed for large spatial datasets, which projects the exposure space onto a smaller number of points (‘knots’), leading to efficient computation of health risk estimates.
Several additional functionalities could be added. Allowing for count outcome data via Poisson BKMR
C
c
a
b
would enable the model to be applied to time series studies that estimate the joint health effects of day-to-day changes in multiple community-level risk factors (e.g., temperature and air pollution) on daily outcomes (e.g., hospitalization rates) [27]. However, implementa-tion of the MCMC algorithm in this setting requires additional complexity because the computational tricks described above are not applicable. Additionally, the im-plementation focuses on a particular choice of kernel function for specifying the BKMR model, namely the Gaussian kernel. Our previous simulation studies showed that this specification is relatively flexible, accur-ately capturing a wide range of underlying forms of the true exposure-response function. However, the ability to specify other kernel functions could be added in the fu-ture. Along these same lines, our focus has been on esti-mating the joint health effects of continuous exposure variables; allowing for exposure-response surfaces that are functions of both categorical and continuous expo-sures may also be of interest. Finally, beyond estimating
specific interactive-effect summary measures, one may be more broadly interested in detecting whether two groups of exposure variables interact [28–30]. This could be done within the BKMR framework by applying kernel decomposition methods to evaluate whether the kernel function h(z1,z2) could be expressed as h(z1) + h(z2) for
two groups of exposures (z1andz2).
Conclusions
In summary, this newly developed software provides an inte-grated set of tools for conducting a mixtures health effect analysis. The software and expanded toolbox make BKMR accessible for use across a broad range of epidemiological ap-plications in which a large number of exposures have com-plex, potentially nonlinear and interactive effects on health.
Abbreviations
BKMR:Bayesian kernel machine regression; CI: Credible interval; DF: Degrees of freedom; KMR: Kernel machine regression; MCMC: Markov chain Monte Carlo; NIEHS: National Institute for Environmental Health Sciences; PIP: Posterior inclusion probability
a
c
b
Funding
This work was supported by grants from the National Institutes of Health [P30 ES000002, R01 ES024332-01A1, R00 ES022986, P01 CA134294]; the US Environmental Protection Agency (EPA) [RD-83587201]; and the Health Effects Institute. Its contents are solely the responsibility of the grantee and do not necessarily represent the official views of the US EPA. Further, US EPA does not endorse the purchase of any commercial products or services mentioned in the publication.
Availability of data and materials
All data generated or analyzed during this study are included in this published article and its supplementary information files.
Authors’contributions
JFB developed the software, conducted the analyses, and wrote the manuscript. BC, LV, and BCH contributed to the analyses, interpretation of results, and writing of the manuscript. All authors read and approved the final manuscript.
Ethics approval and consent to participate Not applicable
Consent for publication Not applicable
Competing interests
The authors declare that they have no competing interests.
Publisher’s Note
Springer Nature remains neutral with regard to jurisdictional claims in published maps and institutional affiliations.
Author details
1Biostatistics Unit, Kaiser Permanente Washington Health Research Institute, 1730 Minor Ave #1600, Seattle, WA 98101, USA.2Department of Biostatistics, University of Washington, Seattle, WA, USA.3Department of Environmental Health, Boston University School of Public Health, Boston, MA, USA. 4Psychiatric Biostatistics Laboratory, McLean Hospital, Belmont, MA, USA. 5
Department of Biostatistics, Harvard T H Chan School of Public Health, Boston, MA, USA.
Received: 18 January 2018 Accepted: 10 August 2018
References
1. Billionnet C, Sherrill D. Annesi-Maesano I, study G: estimating the health effects of exposure to multi-pollutant mixture. Ann Epidemiol. 2012;22:126–41. 2. Hu H, Shine J, Wright RO. The challenge posed to children's health by
mixtures of toxic waste: the Tar Creek superfund site as a case-study. Pediatr Clin N Am. 2007;54:155–75.
3. Gennings C, Sabo R, Carney E. Identifying subsets of complex mixtures most associated with complex diseases: polychlorinated biphenyls and endometriosis as a case study. Epidemiology. 2010;21(Suppl 4):S77–S84. 4. Carlin DJ, Rider CV, Woychik R, Birnbaum LS. Unraveling the health effects of
environmental mixtures: an NIEHS priority. Environ Health Perspect. 2013; 121:A6–8.
5. Braun JM, Gennings C, Hauser R, Webster TF. What can epidemiological studies tell us about the impact of chemical mixtures on human health? Environ Health Perspect. 2016;124:A6–9.
6. Breiman L. Random forests. Mach Learn. 2001;45:5–32.
7. Tibshirani R. Regression shrinkage and selection via the lasso. J Royal Stat Soc - Series B. 1996;58:267–88.
8. Dominici F, Peng RD, Barr CD, Bell ML. Protecting human health from air pollution: shifting from a single-pollutant to a multipollutant approach. Epidemiology. 2010;21:187–94.
9. Agier L, Portengen L, Chadeau-Hyam M, Basagana X, Giorgis-Allemand L, Siroux V, Robinson O, Vlaanderen J, Gonzalez JR, Nieuwenhuijsen MJ, et al. A systematic comparison of linear regression-based statistical methods to assess Exposome-health associations. Environ Health Perspect. 2016;124: 1848–56.
10. Barrera-Gómez J, Agier L, Portengen L, Chadeau-Hyam M, Giorgis-Allemand L, Siroux V, Robinson O, Vlaanderen J, González JR, Nieuwenhuijsen M, et al. A systematic comparison of statistical methods to detect interactions in exposome-health associations. Environ Health. 2017;16:74.
11. Sun Z, Tao Y, Li S, Ferguson KK, Meeker JD, Park SK, Batterman SA, Mukherjee B. Statistical strategies for constructing health risk models with multiple pollutants and their interactions: possible choices and comparisons. Environ Health. 2013;12:85.
12. Stafoggia M, Breitner S, Hampel R, Basagaña X. Statistical approaches to address multi-pollutant mixtures and multiple exposures: the state of the science. Curr Environ Health Rep. 2017;4:481–90.
13. Bobb JF, Valeri L, Claus Henn B, Christiani DC, Wright RO, Mazumdar M, Godleski JJ, Coull BA. Bayesian kernel machine regression for estimating the health effects of multi-pollutant mixtures. Biostatistics. 2015;16:493–508. 14. Scott JG, Berger JO. Bayes and empirical-Bayes multiplicity adjustment in the
variable-selection problem. Ann Stat. 2010;38:2587–619.
15. Coull BA, Bobb JF, Wellenius GA, Kioumourtzoglou MA, Mittleman MA, Koutrakis P, Godleski JJ. Part 1. Statistical Learning Methods for the Effects of Multiple Air Pollution Constituents. Res Rep Health Eff Inst. 2015:5–50.
16. Valeri L, Mazumdar MM, Bobb JF, Claus Henn B, Rodrigues E, Sharif OIA, Kile ML, Quamruzzaman Q, Afroz S, Golam M, et al. The joint effect of prenatal exposure to metal mixtures on neurodevelopmental outcomes at 20-40 months of age: evidence from rural Bangladesh. Environ Health Perspect. 2017;125:067015.
17. Bobb JF. bkmr: Bayesian Kernel Machine Regression. R package version 0.2. 0. 2017. https://github.com/jenfb/bkmr. Accessed 6 Apr 2017.
18. R Core Team. R: A language and environment for statistical computing. R Foundation for Statistical Computing, Vienna, Austria. 2017. https://www.R-project.org/. Accessed 13 Aug 2018.
19. Liu D, Lin X, Ghosh D. Semiparametric regression of multidimensional genetic pathway data: least-squares kernel machines and linear mixed models. Biometrics. 2007;63:1079–88.
20. Amemiya T. Qualitative response models: a survey. JEL. 1981;19:1483–536. 21. Banerjee S, Gelfand AE, Finley AO, Sang H. Gaussian predictive process models
for large spatial data sets. J Royal Stat Soc - Series B. 2008;70:825–48. 22. Savitsky T, Vannucci M, Sha N. Variable selection for nonparametric Gaussian
process priors: models and computational strategies. Stat Sci. 2011;26:130–49. 23. Gelman A, Rubin DB. Inference from iterative simulation using multiple
sequences. Stat Sci. 1992;7:457–72.
24. Taylor KW, Joubert BR, Braun JM, Dilworth C, Gennings C, Hauser R, Heindel JJ, Rider CV, Webster TF, Carlin DJ. Statistical approaches for assessing health effects of environmental chemical mixtures in epidemiology: lessons from an innovative workshop. Environ Health Perspect. 2016;124:A227–9. 25. National Institute of Environmental Health Sciences. Statistical Approaches
for Assessing Health Effects of Environmental Chemical Mixtures in Epidemiology Studies. 2015;https://www.niehs.nih.gov/news/events/ pastmtg/2015/statistical/. Accessed 20, June 2018.
26. Synthetic Data Set #1.https://www.niehs.nih.gov/about/events/pastmtg/ 2015/statistical/simulated_dataset_1_answers.pdf. Accessed 10 Aug, 2017. 27. Bobb JF, Dominici F, Peng RD. Reduced hierarchical models with application to estimating health effects of simultaneous exposure to multiple pollutants. J Royal Stat Soc - Series C. 2013;62:451–72.
28. Lampa E, Lind L, Lind PM, Bornefalk-Hermansson A. The identification of complex interactions in epidemiology and toxicology: a simulation study of boosted regression trees. Environ Health. 2014;13:57.
29. Larson NB, Schaid DJ. A kernel regression approach to gene-gene interaction detection for case-control studies. Genet Epidemiol. 2013;37:695–703. 30. Antonelli J MM, Bellinger D, Christiani D, Wright R, Coull BA. Bayesian variable