S t a t e o f I s r a e l
Ministry of National Infrastructures
Water Commission
Planning Division
Transitional Master Plan for
Water Sector Development
in the Period 2002-2010
J u n e 2 0 02
Wa
te
Transitional Master Plan for Water
Sector Development In the Period
2002-2010 - Executive Summary
A. Background
Israel's water sector is at an all-time ebb. It is clear that problems with the supply of drinking water this summer can be expected despite the extensive cuts in fresh water supply that were planned for the year 2002. A parliamentary committee has published a comprehensive report on the chain of events that have led up to this sorry state of affairs.
The approach that has guided the water supply sector for decades, including the last decade in particular, has been one of brinkmanship, including deferment of desalination to as late a date as possible. The approach is thus guided by short-term economic considerations, according to which maximum empty storage capacity must be ensured for large natural replenishment occurrences in order to prevent overflows and discharge to the sea.
The policy of brinkmanship must be replaced by one that will prevent shortfalls in water supply and lack of control over water resources in order to ensure stabilization of the country's water supply system in the future.
Based on the findings of this plan (Phase A), the Government of Israel (Social-Economic Cabinet) approved on 20 March 2002 the construction of seawater desalination plants with a total capacity of 400 million cu.m (MCM) per year, while an additional 50-100 MCM/year will be imported from Turkey. The plants will at best commence operation in the second half of 2004, and will be completed during the period 2005-2006.
This quantity is required to close the gap in the water balance that was created as a result of a combination of factors, namely: (1) successive drought years; (2) continued exploitation of natural water sources, causing their depletion; (3) delay in introducing desalination; (4) delay in adjusting demand and water prices to the desalination era; and (5) fulfillment of obligations for supplying water, as required by international agreements.
The gap in the water balance is comprised of two main components:
● Current discrepancy between demand and supply (which is now being reduced mainly on
the demand side by means of extensive cuts and by supply of treated effluent water of inferior quality).
● Cumulative multi-annual overutilization of water resources (i.e. production exceeding
replenishment).
In the future the gap between demand and supply of water may grow even further as a result of:
Water Commission
● Increase in the supply of water to Jordan and the West Bank, including an increase in
production in the West Bank and perhaps also in Lebanon and Syria, at the expense of water sources in Israel.
● Deterioration in the quality of water sources.
● Decrease in the infiltration of water to the groundwater aquifers as a result of urbanization.
The demand for water in the domestic sector is a result of the growth in population and the expected rise in the standard of living, coupled with the demand for high supply reliability. Currently an effort is being made to conserve water in order to reduce demand. The agricultural sector has been severely affected by the water shortages, and public guarantees are needed to sustain a level of agricultural activity that is above the level to which it had dropped during the years of shortage. Natural resources and landscape assets have been adversely affected, at times irreversibly, and a commitment is needed to ensure their sustainable future.
Simultaneously with the increase in demand, the natural supply of fresh water is also decreasing. Increasing quantities are being eliminated from the balance as a result of pollution, and preventive and corrective measures are required to return the natural waters to a quality level suitable for their intended uses.
B. Principles of Water Supply System Policy
Israel's development policy, as expressed in various national plans, involves three elements: security, social well-being, and environmental conservation. This policy is derived from the decisions of previous governments. Water in our region is in deficit and overall policy must treat it as a sustainable resource.Such policy regards water as a resource that is important to life, and to supporting the distribution of the population, as well as its well-being and quality of life, with the emphasis on conservation and consolidation of the rural-agricultural sector as a part of the open landscape.
The water needs of the domestic, industrial and tourist sectors will be fully met, with maximum reliability and the required quality. Supply to external entities (the Kingdom of Jordan and the Palestinian Authority) will continue as per the agreements and will be taken into account.
A determined and consistent effort must be made towards water conservation and maximum public acceptance.
Agriculture is to be conserved to the extent of about 200,000 ha of irrigated land, both due to the strategic need to maintain an independent production capability in the future, as well as to preserve national lands. For this purpose, at least about 530 MCM/year of fresh water must be set aside for agriculture. The remaining supply for agriculture will come from brackish water, stormwater and reclaimed effluents of a quality and salinity permitting long-term use without damaging land or crops. The prices of fresh water, brackish water and effluents will be established so that an overall supply target of at least 1,150 MCM/year will be attained.
Environmental needs will be regarded as a consumption sector like all others. The needs of this sector will be met by maintaining the extent of irrigated lands, and by the necessary water allocations to sustain bodies of water in green areas and in rivers for the conservation of nature and for recreational purposes.
The natural water resources will serve both as the sources and the main regulating reservoirs for the water supply system. Thus, water sources will be rehabilitated and their quality maintained to the extent possible. Operating policy will be based on multi-annual regulating requirements, on "red lines" and on the capacities of the reservoirs.
Planning policy will be different than in the past. There will be a switch from a policy of brinkmanship to one in which future needs will be reliably fulfilled, even under extreme climatic conditions.
The development plan will include development of water supply for peripheral areas and the West Bank.
The development plan will serve as a realistic basis for the development of water sources and for supply to the various sectors, both in the short and long term. Closure of the gaps in the balance by the year 2010 is contingent on full implementation of the development plan for the year 2010 horizon, and continued medium- and long-term development.
C. Master Plan Objective
The objective of the current plan is to outline a framework for development and rehabilitation of the water supply sector by the end of the decade in accordance with the above comprehensive policy and to serve as a plan for transition from deficiency and poor supply reliability to rehabilitation of reservoirs and adherence to water supply and environmental targets.
Plan Targets
Following is a description of the ten main targets for the water supply sector:
1. Stabilization of the water system and bringing it to a state of equilibrium by the year 2010, even if climatic conditions are similar to the dry conditions that prevailed in the last decade. A balanced system is one that will guarantee reliable long-term water supply for various needs on a sustainable basis.
2. Stopping the deterioration in the natural sources by restoring them by 2005 to levels that are above the hydrological "red lines."
3. Ensuring the sustainable quality of water in the natural reservoirs, including "reversal" of the salt balance, remediation of polluted wells and monitoring activities.
4. Preparation of an action plan for bridging the gap between 2002, a year of severe shortages, and 2010, thus reducing the gaps between demand and supply.
5. Development and utilization of the large part of marginal waters and adapting them for various uses.
6. Adjustment of the quality of the water supplied for various uses to accepted western standards.
7. Connection of independent water systems to the national system, as necessary.
Water Commission
ensuring the existence of natural resources and landscape assets.
9. Gradual changeover to management of the water supply system based on the economics of supply and demand combined with central supervision, within the framework of the Water Supply System Reform Law.
10.Reorganization of the Water Commission and its associated systems, including ensured availability of resources, to allow them to reach the targets.
E. Main Assumptions
The above policy is implemented in the plan based on the following assumptions:
E.1 Demand
● The population of Israel in the year 2010 will be 7.3 million,1 with an average water consumption2
of 120 cu.m per capita. Municipal consumption of fresh water will increase from 695 MCM/year in 1998 and 700 MCM/year in 2002-2003 to 875 MCM/year in 2010.
● It is assumed that water conservation activities will continue to have a practical effect in the
period 2002-2003; however, with the onset of desalination there will be a sharp increase in consumption, as was the case in the last decade after the rainy year of 1992, which followed a series of drought years.
● Consumption of fresh water in industry3 will increase from 93 MCM/year in 1998 to 110
MCM/year in 2010. About 13 MCM/year of effluents will be incorporated in the industrial sector by the end of the present decade.
● The target for supply4 of fresh water in the agricultural sector will not be less than 530
MCM/year.
● The target regarding total supply5 of water of all quality levels in the agricultural sector will
not be less than 1,150 MCM/year, and will be realized as early as possible and not later than the beginning of the next decade.
● Should there be a reform in the water supply sector, the assumption is that agricultural
consumption will not decrease below the "ironclad allocations" and the agricultural targets as indicated above.
● The supply of water to external entities6 is estimated at 97 MCM/year in 2002 (35 MCM/year
to Jordan, 35 MCM/year to the Palestinian Authority, and another 27 MCM/year for production by the Palestinian Authority from the Yarkon-Taninim aquifer), with a forecast natural increase to 115 MCM/year based on signed agreements.
A summary of demand assumptions is presented in Figures 1 and 2 and in Table 1.
1. According to National Outline Plan 2/6
2. According to the Consumption Demand Branch of the Water Commission 3. Ibid.
4. Adjusted to match the government decision. 5. Ibid.
6. According to the Consumption Demand Branch of the Water Commission
E.2 Supply
In the coming decade (and following it) maximum efforts will be made to protect natural water sources, which will continue to be the main sources of water in Israel.
● Natural storage capacity will serve as the main regulating source, at the cost of overflows
and discharges to the sea in years of plentiful rainfall.
● The "red lines" will be imposed within three years (beginning 2005) on the water supply
sector as accepted constraints on the water tables, i.e. - 213 m in the Sea of Galilee, +9 m in the Yarkon-Taninim Aquifer (in the Menashe T1 borehole) and prevention of depressions in the coastal basin.
● It is assumed that there will be no climatic changes or decline in replenishment, although
the significance of the latter was examined.
Table 1: Agricultural Sector Consumption
Targets in the Present Decade: 2002-2010
(MCM/year)
National total Total agriculture
Fresh water
Effluents
Brackish water
1998 2002 2003 2004 2005 2006 2007 2008 2009 2010
1,266 1,007 1,023 1,029 1,056 1,092 1,102 1,103 1,113 1,122
860 582 577 544 541 538 535 533 531 530
276 295 316 356 385 434 453 461 479 496
130 130 130 130 130 120 114 108 102 96
1,073 809 825 831 858 900 916 923 939 955
774 500 500 470 470 470 470 470 470 470
269 279 295 332 358 404 420 427 443 459
30 30 30 30 30 26 26 26 26 26
193 198 198 198 198 192 186 180 174 166
86 82 77 74 71 68 65 63 61 60
7 16 21 24 27 30 32 34 36 36
100 100 100 100 100 94 88 82 76 70 Total agriculture
Fresh water
Effluents
Brackish water
Total agriculture
Fresh water
Effluents
Brackish water Areas served by
national system
Areas outside national system
Basic Assumptions and Comments:
1. The data for 1998 were taken from the information system of the Water Commission (Consumption Survey) and underwent a number of adjustments in light of revised definitions regarding fresh and brackish water. 2. There is no change in agricultural consumption as a result of the expected reform in water prices. 3. The above targets are forecast for average conditions. In dry years they cannot be met, while in rainy years
greater quantities can be supplied.
4. Meeting the above targets depends on the development plan for effluents, and on desalination of seawater and brackish water.
5. It is assumed that the quality of effluents is suitable for irrigation.
6. It was assumed that flood water is not included in the balance calculations.
Water Commission
7Figure 1: Urban Consumption
(Residential and Public Sectors) up to Year 2010
1000 900 800 700 600 500 400 300 200 100 0
122 120 118 116 114 112 110 108 106 104 1998 2000 2002 2004 2006 2008 2010
Total urban consumption of fr
esh water
(MCM/year)
PerCapita consumption (cn.m)
Year
Total urban consumption PerCapita consumption
Figure 2: Fresh Water Demand Forcasts,
2002-2010
1000 900 800 700 600 500 400 300 200 100 0
1998 2000 2002 2004 2006 2008 2010
(MCM/year)
Year
Nature and Landscae Industry
Muncipal
Figure 4: Yarkon-Taninim Levels (in Menashe 1 Borehole)
8 9 10 11 12 13 14 15 16 17 18 19 20 21
/ / / / / / / / / / / /
/11 9111 9211 93 11 94 11 95 11 96 11 9710 98 10 99 10 0010 01 100210 90
Level (m above sea level)
Upper level -208
-209
-210
-211
-212
-213
-214
-215
"Red line"
Year
70 72 74 76 78 80 82 84 86 88 90 92 94 96 98 00 02
Water Commission
Repl
los
[image:9.595.17.589.56.812.2]/y
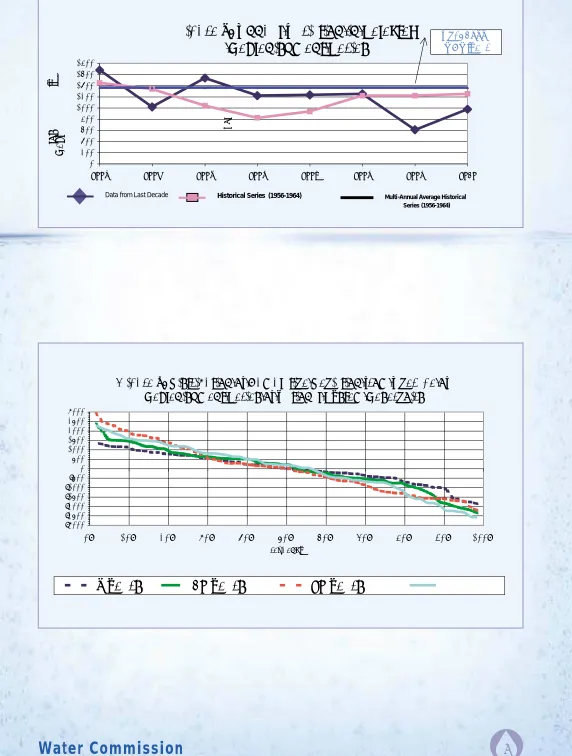
Figure 5: Annual Variation in Selected Replenishment Series
0 200 400 600 800 1000 1200 1400 1600 1800
2003 2004 2005 2006 2007 2008 2009 2010
Avg: 1355 MCM/year
Vol
Data from Last Decade Historical Series (1956-1964) Multi-Annual Average Historical Series (1956-1964)
Figure 6: Distribution of Cumulative Deviation from Average of Replenishment Series of National System Reservoirs
-3000 -2500 -2000 -1500 -1000 -500 0 500 1000 1500 2000 2500 3000
0% 10% 20% 30% 40% 50% 60% 70% 80% 90% 100%
Frequency
5 years 10 years 20 years
● Natural replenishment is based on historical data (1932-1993)7. Nevertheless, the significance
of replenishment was examined based on data from the last decade as well.
● The target for the operational storage capacity that will guarantee production of the average
quantity from the natural reservoirs with a reliability of 90% is about 1,500 MCM above the "red lines." This is based on the statistical finding that in 90% of the cases, cumulative utilization of water in storage will reach approximately 1,500 MCM if each year a quantity equal to the average replenishment is produced.
● The present gap between the current situation and the "red lines" amounts to at least 500
MCM.
Supply data for the main sources of water in Israel are presented in Figures 3, 4, 5 and 6.
E.3 Development Plan
● The full capability for developing additional fresh water will be utilized through use of
inexpensive means, i.e. water conservation, replacement of fresh water with effluents, desalination of brackish water and remediation of wells. The remaining gap will be made up by seawater desalination and import of water.
● In addition to making up the gap in fixed demand, the storage capacity will be restored by
expediting the construction of desalination plants. The desalination plan derived from the water supply sector targets will comprise two main parts: extent of desalination in the year 2004, and recommended annual increase to cover the steady increase in demand.
● The plan takes into account the fact that there will be an increase of 50 MCM every 2.5 years
in the extent of desalination (20 MCM/year), equal to the annual increase in demand, but that this development can be delayed if the efficiency of water conservation and the condition of reservoirs can be improved or if other investments in the water sector can be expedited.
● Brackish or polluted waters, which constitute part of the total natural water potential, will
in part be brought to drinking water quality and in part used for direct consumption in industry, with the balance serving agricultural consumers, natural resources and landscape assets.
● Investments - in the water sources (including desalination), in treatment of water to comply
with standards, and in supply systems - are required in the fresh water system mainly to keep pace with the increase in domestic sector consumption.
● Effluents will be used to the maximum extent, based on the assumption that they will be
treated to a high quality, protecting the water quality in the reservoirs for future generations. ● The development plan includes extensive and comprehensive development in the peripheral
areas and in the West Bank.
● The development policy and balances were determined based on existing agreements with
W
ater Commission
Table 2: Summary of National Water Balance
Note: Since the amount of desalination is intended to meet extreme conditions, the supplementary amounts required in 2010 are negative, i.e. there is excess desalination in 2010 under average conditions.
Year Israel
Population (million)
Fresh Reclaimed Desali-nation
Brackish water
Required supplement
TOTAL Utilized Supply
Domestic Industry Agriculture PA Jordan Storage
Capacity Restoration
Nature and Landscape
TOTAL Consumption
1999 6,219 1,467 278 0 166 170 1,915 696 89 0 37 126 759 278 58 35 0 0 1,915
2002 6,498 1,467 298 0 166 35 1,966 704 93 0 36 129 582 298 130 1,010 62 35 0 26 1,966
2005 6,789 1,467 403 355 166 26 2,417 784 103 0 37 140 530 403 129 1,062 70 35 300 26 2,417
2010 7,300 1,467 509 500 140 -75 2,541 886 110 13 44 167 530 496 96 1,122 81 35 200 50 2,541
WATER SOURCES - MCM
Fresh Effluents Brackish TOTAL water
Fresh Effluents Brackish TOTAL water
WATER CONSUMPTION - MCM
● The total quantities of water developed and/or produced can be transported across most
of the country if the plan is executed.
● An examination of the balance shows at this stage the development of demand and supply,
and the development plan in the three-basin system, based primarily on the assumption that the peripheral areas outside the national system (the Arava region, the Jordan Valley and part of Yarkon-Taninim) are managed as closed water supply systems.
F. Water Balances
Water balances were prepared based on the various assumptions, the development plan and the policy described above. A summary of the national water balance is given in Table 2.
In order to examine the extent of desalination required, successive annual water balances to the end of the decade were prepared with the object of examining the above assumptions for various development scenarios and climatic series. The recommendations of the plan are derived from two main examinations of the balance that were performed within the plan:
● Calculation of the amount of additional water that must be produced assuming any given
development plan (reclamation of effluents, desalination of brackish water and remediation of wells).
● Examination of the implications of deferring implementation of the recommended development
plan.
The following are the main results of the balances:
● The amount of water available for agriculture, water shortages over time, and restoration of
storage at the end of the decade.
● The principal result of these balances is the amount of seawater desalination required to
prevent shortages and restore the storage capacity under the constraints of demand, operational rules and development plans (see Table 3).
Regarding the development plans, two main scenarios were examined:
● “Base case” scenario - implementation capacity based on recent government decisions.
● “Low cases” cenario - limited implementation capacity of the water sector.
The scenarios were examined under the constraints of replenishment data from the last decade and an extreme replenishment series from the past, which is characterized by consecutive dry years at the beginning of the desalination era (see Table 4).
F.1 Examination of the Need for Desalination
Based on the demand and development assumptions, five main replenishment series were examined:1. Average replenishment based on 62 historical years (1932-1993). This was estimated to be about 1,336 MCM/year, less overflows and discharges to the sea.8
W
[image:13.595.6.814.27.577.2]ater Commission
Table 3: Summary of Desalination Needs in Various Natural
Replenishment Series
13
Series No.
Series Amount of Desalination Required in 2004 to Prevent Shortages in
the Last 5 Years
Amount of Desalination Required in 2004 to Build Up
Storage Capacity of 500/1,500 MCM
Amount of Storage Capacity Required at the End of the Decade
Above the Red Lines with Desalination Meeting Targets
Water in Storage at the End of the Decade Above Red Lines with Desalination of 420 MCM
in 2004
MCM MCM MCM MCM
1 Constant Series of average years -1,336 MCM/year
0 90 501 2171
290 1500
2 Constant Series of dry years - 1,171 MCM/year
185 300 515 1103
3 Constant Series of extremely dry years - 1,139 MCM/year
225 340 515 897
4 Historical series - last decade (minimum 574, maximum 1,693, average 1,172)
250 360 507 788
5 Historical extreme series - starting year 1956 (minimum 804, maximum 1,458, average 1,177)
Table 4: Water Balances Under Base Case and
Low Development Scenarios
Base Case Development Scenario - Last Decade Series
Summary of Balance in the Areas Covered by the National System
YEAR 2001 2002 2003 2004 2005 2006 2007 2008 2009 2010
Sources
Natural replenishment (less losses) 1153 1693 1027 1533 1212 12191 234 583 953
Seawater desalination 0 0 155 355 440 460 500 500 500
Desalination of brackish water 10 10 20 30 40 50 50 50 50
Utilization of storage capacity 0 0 0 0 0 0 0 0 0
Total Sources 1163 1703 1202 1918 1692 1729 1784 1133 1503
Uses
Total demand 1387 1394 1431 1456 1481 1505 1530 1556 1581
Shortages -391 0 -253 0 0 0 0 0 0
Restoration of annual storage capacity 167 309 254 622 112 232 53 -422 -79
Cumulative restoration of annual -500 -333 -25 0 462 673 897 1150 728 649
storage capacity
Total Uses 1163 1703 1202 1918 1692 1729 1784 1133 1503
Low Development Scenario - 1956-1964 Series (Historical Extreme Series of Years)
Summary of Balance in Areas Covered by the National System
YEAR 2001 2002 2003 2004 2005 2006 2007 2008 2009 2010
Sources
Natural replenishment (less losses) 1392 1458 1350 1052 820 930 1217 1231 1273
Seawater desalination 0 0 100 285 335 335 335 335 335
Desalination of brackish water 5 5 10 15 20 25 25 25 25
Utilization of storage capacity 0 0 0 0 0 0 0 0 0
Total Sources 1397 1463 1460 1352 1175 1290 1577 1591 1633
Uses
Total demand 1387 1394 1431 1456 1481 1505 1530 1556 1581
Shortages -157 -98 -137 -104 -306 -215 0 0 0
Restoration of annual storage capacity 167 167 167 0 0 0 47 35 52
Cumulative restoration of annual -500 -333 -167 0 0 0 0 47 82 134
storage capacity
Total Uses 1397 1463 1460 1352 1175 1290 1577 1591 1633
Base Case Development Scenario - Last Decade Series
Summary of Balance in the Areas Covered by the National System
YEAR 2001 2002 2003 2004 2005 2006 2007 2008 2009 2010
Sources
Natural replenishment (less losses) 1153 1693 1027 1537 1224 1242 1270 634 1014
Seawater desalination 0 0 100 285 335 335 335 335 335
Desalination of brackish water 5 5 10 15 20 25 25 25 25
Utilization of storage capacity 0 0 0 0 0 0 0 0 0
Total Sources 1158 1698 1137 1837 1579 1602 1630 994 1374
Uses
Total demand 1387 1394 1431 1456 1481 1505 1530 1556 1581
Shortages -396 0 -323 0 0 0 0 0 -92
Restoration of annual storage capacity 167 304 29 381 99 97 100 -562 -115
Cumulative restoration of annual -500 -333 -29 0 381 480 577 677 115 0
storage capacity
Water Commission
15nine years). This average is estimated to be about 1,171 MCM/year, less overflows and discharges to the sea.
3. Average replenishment representing a series of extremely dry years (a historical series consisting of nine years). This average is estimated to be about 1,139 MCM/year, less overflows and discharges to the sea.
Note: In the above three series it was assumed that replenishment in each successive year is fixed at the respective amounts.
4. A historal series of years as in the last decade,9 using replenishment data from the last
decade (1993-2000), based on the data of the Hydrological Service. Series characteristics
include the following minimum, maximum and average values (less overflows and discharges to the sea): 574, 1,693 and 1,172 MCM/year, respectively. This series of years is characterized by years of shortage at the end.
5. Extreme Historical Series of Years (1956-1964), taken from the 61 historical series of years. Series characteristics include the following minimum, maximum and average values (less overflows and discharges to the sea): 804, 1,458 and 1,177 MCM/year, respectively. The frequency of this series of years is 6%.
This historical series of years is characterized by successive drought years immediately after the onset of the desalination era (see Figure 6).
Note: The minimum, maximum and average replenishment data for a particular series of years vary for each run with each development plan, since the overflows and discharges to the sea are a function of the storage capacity, which is dependent on the development plan.
Fluctuations in annual replenishment are considerably higher than fluctuations in the replenishment series averages over the entire period. Accordingly, three series (average, dry and extremely dry - Series 1, 2 and 3, respectively) and two historical series (Series 4 and 5) were checked in which the water supply sector targets in light of the possible variation in replenishment between years as they occurred in the past were examined.
Except for the series of averages (Series 1) or rainier than it, a sufficient storage capacity, estimated at about 1,500 MCM, cannot be built up for the coming decade. Therefore, it is proposed to attempt to commence the next decade, even under dry conditions, with a minimum storage capacity of 500 MCM. The amounts of desalination required, based on this, in each scenario, are indicated in the fourth column from the right in Table 3.
The quantity of desalination required for a specific scenario was selected as the maximum of the following two targets:
● The amount of desalination (in 2004) required to prevent a shortage in the last five
years of the decade (2006-2010).
● The amount of desalination required to start the next decade with a storage capacity
of at least 500 MCM.
The results for an average constant series of years (1,336 MCM/year) indicate that desalination and imported water to the extent of about 290 MCM/year is sufficient to ensure supply for the short and long term. The probability of realizing a series such as this is only 50%.
Desalination to the extent of 340 MCM/year starting in 2004 is sufficient to cope with shortages in all constant series (including the extremely dry series) as well as to meet the minimum storage capacity target at the end of the decade (about 500 MCM).
The results indicate that in order to prevent shortages with high reliability (based on the above historical series of years), desalination of at least 420 MCM/year will be required in the current decade, beginning in 2004 (540 MCM at the end of the decade). Desalination
to this extent will assist in coping with dry years in the present decade and will permit a high level of readiness for the next decade.
Moreover, it may be seen that planning based on the criterion of constant replenishment (based on historical series of years) is not a sufficient indication of possible extreme occurrences (from the standpoint of shortages).
The last column (from the left) in Table 3 presents the storage capacity at the end of the decade for various replenishment scenarios, with desalination to the extent of 420 MCM/year beginning in 2004. It may be seen that the storage capacity of the water sector (estimated at about 3,000 MCM above the "red lines") allows the absorption of desalination amounts even if the replenishment average is above average.
The following main conclusions may be drawn from the examination:
● Desalination to the extent of 420 MCM in 2004 and 540 MCM in 2010 will allow the
water sector targets to be met.
● Planning based on the constant series does not accurately express the significance
of annual variations.
In order to enable the water sector to meet the targets in the current decade and ensure a safe entry into the coming decade in the event that past data are repeated, it is proposed that by
the year 2004, desalination and imports be developed to the extent of at least 420 MCM/year, with subsequent annual development of 20 MCM/year, in accordance with the actual replenishment and the condition of the reservoirs during the course of the decade. Development of this amount will increase the supply reliability of the national system
to the maximum extent and ensure sustainability even if it turns out that water utilization potential from natural sources has decreased to 90% of the historical amount and even if limited implementation capability causes delays in development.
On the other hand, if unusually rainy periods occur and/or water conservation efforts prove to be more successful than expected, it will be possible to reduce accordingly (or cancel) the annual supplement (20 MCM/year). Thus the risk of shortages caused by a delay in the development plan is much higher than the risk of canceling the plan and having overflowing reservoirs.
These findings are based on the assumption that there is no deterioration in replenishment, although it is already known that the amount of available water may decrease even further for reasons of quality deterioration or urbanization. Some claim that there are already indications of global climatic changes that have impacted supply in the last decade and that could impact future supply.
● The recent decision of the Cabinet on 20 March 2002 is consistent with the findings
Water Commission
F.2 Findings of Balances for Reduced
Development Scenarios - Summary
It may be seen (Table 4) that in the base case development scenario the storage capacity is restored even in dry replenishment series, to the extent of as much as half the long-term storage capacity target. Deficiencies do not appear during the decade except for the years prior to 2004.
In contrast, in the low development scenario the decade will end, after a series of dry years, as did the last decade, at the storage capacity "red lines" and with a deficiency of about 92 MCM in the agricultural sector. In order to illustrate the danger expected in the coming decade from a delay in development, the low scenario was run with an extreme historical series of years (1956-1964), in which years of shortage appear prior to the onset of the desalination era. It may be seen that the shortages amount in four consecutive years to a deficiency of 100 MCM, and that the maximum deficiency is 306 MCM. The significance of this deficiency is the virtual elimination of agriculture based on fresh water.
A limitation in the implementation capability will have an impact beyond water shortages. It will also affect the ability of the water sector to meet supply targets in the various regions as well as proper management of the natural reservoirs and maintenance of their quality.
The conclusions of the development scenario balances are as follows:
● Attempts must be made to implement the basic development plan in its entirety (mainly
as regards the creation of additional water sources). Any delay in its implementation will constitute a danger in case of consecutive drought years.
● A delay in the development of additional water sources will prevent restoration of the
storage capacity should the conditions of the last decade be repeated. Even if shortages do not occur, the situation at the end of a further nine-year period will be similar to the current one.
● A limited implementation capability will affect the ability of the water supply system
to meet the various needs, and faulty management of the systems will continue.
G. Plan Principles and Findings
G.1 Supply
The plan addresses the problem that evolved with respect to natural waters and proposes a course of development that will enable the natural system to assume levels that will permit proper ongoing management of water supply, while coping with extreme conditions in the future.
The plan is revolutionary from the standpoint of its approach to natural storage capacity, which will be restored and protected as a strategic asset. The switch is from a policy of planning for average conditions to planning for extreme conditions, from brinkmanship (which was characteristic of the last decade, and which emphasizes maximum utilization of natural water
sources to far beyond the level of natural replenishment in the hope that very rainy years will make up the deficit) to preservation of target levels in order to ensure reliable supply, using the storage capacity to tide the country over between rainy and dry periods.
The plan recommends:
● Return within 3 years to the "red lines" recommended on the basis of hydrological
considerations.
● Building up of an additional storage capacity, amounting to 1,500 MCM above the "red lines"
during the course of the decade.
G.2 Development Plan
To meet the above targets, the plan calls for the development of desalinated seawater together with imported water, the overall production capacity being 420 MCM/year starting 2004, with an additional 20 MCM/year each year thereafter, giving a total of about 540 MCM/year in 2010.
The government decision of 20 March 2002 concerning the desalination of 400 MCM/year and import of 100 MCM/year from Turkey in effect adopts the recommendations of the first phase of this plan (which was submitted on 1 January 2002) and is in line with the findings of the current phase.
The plan presents the potential for development of effluent reclamation facilities to the extent of about 230 MCM by 2010. The total quantity of treated effluents in 2010 for supply for agricultural, industrial and municipal landscaping purposes amounts to about 510 MCM.
The construction of sewage reclamation facilities, including upgrading, and achievement of the plan targets at full development, call for maximum cooperation between the Water Commission, the Ministry of Infrastructures (Sewage Administration), the Ministry of Agriculture, the Ministry of Finance and the farmers. Although plans have already been prepared for utilizing most of the effluent potential, the pace of implementation does not meet the needs. A master plan for effluent reclamation is currently being drawn up, aimed at equitable distribution of effluents to ensure the goals of the agricultural sector.
It would have been preferable to treat all the effluents to a tertiary level, including salt removal. It may be reasonably assumed that by the end of the current decade a maximum of about 33% of reclaimed effluents (not including those from the Dan Region Sewage Reclamation Project) will be upgraded from secondary to tertiary level, and about 5% of all the effluents will undergo further treatment for removal of salts.
Nature and landscape needs are defined to all intents and purposes as a fresh water consumer. In 2010 about 50 MCM/year will be supplied for nature and landscape needs, in line with the decisions of previous governments.
The plan identifies a total potential of about 222 MCM of brackish water for desalination; however, of this, only 101 MCM is considered as a supplementary quantity, the remainder being earmarked for improvement and operational purposes only. Because of various limitations in realizing this potential for hydrological, economic and organizational reasons, the plan
Water Commission
Large investments will be made in improving water quality, including well remediation, filtration of the national system water, removal of pollutants, etc., while adjusting the quality of the supplied water to comply with internationally accepted standards. In this context, a total of
about 100 MCM of natural water (which does not constitute an addition to the balance) will be improved.
The plan indicates the need to monitor water resources as an integral part of conserving the restored storage capacity, as well as better operation in the future and warnings of the dangers of pollution and salt contamination.
The total investments defined by the plan up to 2010 amount to about NIS 20 billion, distributed as follows (see also Figure 7):
The total investment in water conservation during the period is estimated to be an additional sum of about NIS 680 million.
The plan indicates that, should the implementation capacity of the water sector, including its various components, be unable to provide the required amounts, the objectives of overall system stability and prevention of deficiencies will not be attained.
19
Base Case Scenario Total Investment, NIS Millions Private Mekorot Total
Seawater desalination and import of water 4,046 884 4,930
Desalination of brackish water 708 177 885
Remediation of wells 272 384 656
Improvement of water quality 664 664
Removal of salts 300 400 740
Reclamation plants 1,381 1,224 2,605
Upgrading of effluents 860 860 1,720
Water works 2,560 2,560
West Bank 300 300
Maintenance and restoration 630 2,250 2,250
Monitoring 100 100 200
Total 8,297 9,843 18,140
Contingencies, 10% 830 984 1,814
Total investment 9,127 10,827 19,954
The above investments are divided between Mekorot Water Co. Ltd., to the extent of NIS
G.3 Implementation Capacity and
Reorganization Issues
The implementation capacity of the water sector calls for a special organizational build-up.
Mekorot Co. will be called upon to operate at twice its current implementation capacity, based on the necessary financing arrangements.
The Water Commission will be required to develop its professional and organizational system, allowing it to serve as an efficient regulator of the private systems within the framework of integration with the Mekorot Co. supply system.
A proposal is presented as part of this plan to bolster the Water Commission by adding 30 jobs at a total cost of about NIS 9.5 million/year.
The costs of conceptual and strategic planning by external consultants for the purpose of implementing the current plan is estimated at about NIS 11 million per year, equivalent to about NIS 90 million in the coming decade.
The cost of research in the water sector is estimated at about NIS 50 million per year, of which about 20% - equivalent to NIS 80 million for the entire period - is covered by the Water Commission.
The government ministries, laws and regulations will have to be adapted to a water supply system that is different from the one the public has been accustomed to.
Only by adopting these recommendations can assurances be given that there will be no return to a situation in which the water sector finds itself with no reserves and with no capability for proper management.
Figure 7: Base Case Scenario - Distribution of Investments
in the Water Sector in the Present Decade, 2002-2010
27%
5%
4%
4% 14%
9% 14%
2%
16% 1%
4%
Seawater Desalination and Import
Desalination of Brackish Water
Remediation of Wells
Quality Improvement Removal of Salts
Reclamation Plants Upgrading of Effluents
Water Works West Bank
Maintenance and Restoration
Water Commission
G.4 Prices of Water for Agriculture
The reform in the water sector is analyzed from the standpoint of management of water supply (fresh water) to the agricultural sector.
The plan presents a preliminary analysis of the impact of water prices on agricultural consumption. This analysis should be broadened to include an examination of returning surplus funds collected to the agricultural sector, a uniform water price being fixed at a level equal to the average production cost.
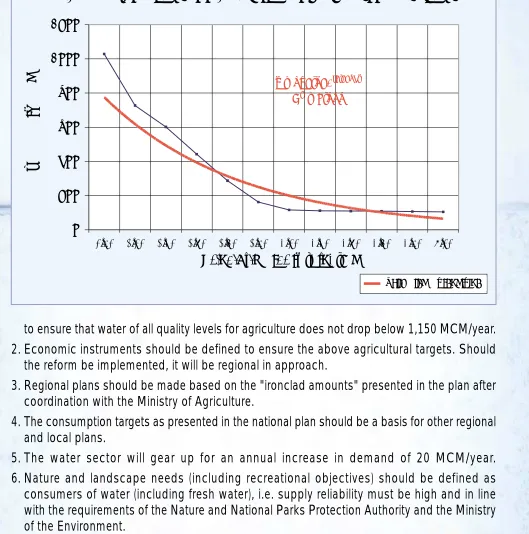
Raising the price of water to above NIS 1.32/cu.m could create a situation in which agricultural consumption of fresh water would be reduced to below 530 MCM/year (the "ironclad amount"), unless an alternative assistance plan for agriculture that is not based on water prices is put into effect (see Figure 8).
H. Decisions Derived from the Master Plan for
the Current Decade
In order to meet water sector targets as defined, the plan necessitates decision making in a number of interrelated areas. Partial implementation of some of the decisions is translated into partial realization of the water sector targets.
Accordingly, the primary decision is that the recommendations presented below be acceptedat the Governmental level in their entirety.
Following are the recommendations derived directly from the master plan:
H.1 Water in Storage
1. A return to previous hydrological levels should be achieved within three years, i.e. by 2005, these levels serving as the "red lines" from that date on.
2. Water sources should be restored and deterioration of their quality prevented. For this purpose it is necessary to establish a target for restoration of the storage capacity, to the extent of at least 1,500 MCM above the "red lines."
3. A monitoring program should be expedited for timely warning of the risk of salinization and to enable better operation of the storage capacity.
4. Utilization of marginal waters should be maximized within the framework of economic, political and environmental constraints.
5. The storage capacity will also be restored by expediting desalination plants and importing water, as specified in the plan.
H.2 Demand
1. A minimum amount of 530 MCM of fresh water should be conserved for agriculture and measures should be taken as soon as possible and in any event before the next decade,
to ensure that water of all quality levels for agriculture does not drop below 1,150 MCM/year.
2. Economic instruments should be defined to ensure the above agricultural targets. Should the reform be implemented, it will be regional in approach.
3. Regional plans should be made based on the "ironclad amounts" presented in the plan after coordination with the Ministry of Agriculture.
4. The consumption targets as presented in the national plan should be a basis for other regional and local plans.
5. The water sector will gear up for an annual increase in demand of 20 MCM/year.
6. Nature and landscape needs (including recreational objectives) should be defined as consumers of water (including fresh water), i.e. supply reliability must be high and in line with the requirements of the Nature and National Parks Protection Authority and the Ministry of the Environment.
7. The required measures should be taken to achieve water conservation and efficiency of water use in all sectors.
H.3 Development Plan
[image:22.595.44.573.85.619.2]A total of NIS 17.1 billion will have to be invested, as specified in the following sections and in the investment table.
Figure 8: National Agricultural Demand Function
y = 972.52e-0.2264x R2= 0.868
0 200 400 600 800 1000 1200
0.80 1.00 1.20 1.40 1.60 1.80 2.00 2.20 2.40 2.60 2.80 3.00
Q(
M
)
Estimated Trend Line
Water Commission
a. Desalination and Import of Water
1. Desalination and import of water, amounting to 500 MCM by the end of the decade (government decision of 30 February 2002), are in line with the findings of the plan. Speedy action must be taken to expedite the remaining tenders, the water import project and preparation of a plan for absorption of the product water in the national water supply system.
2. Following development of the above amount, additional water sources should be developed (desalination + import), amounting to 50 MCM/year within 2.5 years (20 MCM annually). This development will be dependent on the extent of storage capacity restoration and the implementation of water conservation programs.
b. Sewage Reclamation Plants
1. By the end of the decade, 230 MCM/year of treated effluent waters should be developed.
2. By the end of the decade, at least 115 MCM (33% of effluents, not including the Dan Region Sewage Reclamation Project) should be upgraded from secondary to tertiary level.
3. By the end of the decade, salts should be removed from about 20 MCM (in areas that are agriculturally and environmentally sensitive).
c. Desalination of Brackish Water
1. Marginal waters in general, and brackish water in particular, should be utilized to the maximum extent.
2. By the end of the decade, at least 50 MCM of additional fresh water would be developed (constituting a supplement to the balance) as a result of desalination of brackish waters.
H.4 Reorganization for Implementation of the
Development Plan
1.Reorganization of the government ministries in general, and the Water Commission in particular, will be necessary in order to implement the required water plans.
2.The reorganization plan requires inputs estimated at about NIS 9.5 million/year.
3.The Water Commission will submit a detailed reorganization plan to implement the above inputs. It is proposed that a plan be submitted to strengthen the Water Commissioner in three areas:
● Strengthening of professional management capability.
● Strengthening of implementation capacity.
● Strengthening of legal status.
4. Mekorot Co. will submit a plan to double its annual implementation capacity.
5. The Ministry of Finance will see to the implementation of the Water Commission's organizational capability for regulating the various systems, along with guaranteeing the budgetary allocations and resources required to manage the tenders and implement the development plans.
H.5 Law and Regulations - Reform
Comprehensive reform of the water sector is both required and expected. A partial reform is being formulated at present, which addresses water prices in the agricultural sector only.
The plan recommends reform principles that will ensure proper management of the water sector in the future.
In order to implement this plan, it is necessary to entrench the “rules of the game” in laws and regulations based on the above principles.
H.6 Planning and Research
1. Planning and research concerning the water sector in the coming decade should be based on the plan targets presented. About NIS 11 million/year will be invested in planning at the strategic level and in general planning in order to enable implementation of the investment plan.
2. About NIS 10 million/year will be invested in research in the coming decade.