9-2013
Analysis of Writing Inks on Paper Using Direct
Analysis in Real Time Mass Spectrometry
Roger W. Jones
Iowa State University, [email protected]
John Frederick McClelland Iowa State University
Follow this and additional works at:http://lib.dr.iastate.edu/ameslab_pubs
Part of theBiochemistry, Biophysics, and Structural Biology Commons,Forensic Science and Technology Commons, and theMechanical Engineering Commons
The complete bibliographic information for this item can be found athttp://lib.dr.iastate.edu/ ameslab_pubs/237. For information on how to cite this item, please visithttp://lib.dr.iastate.edu/ howtocite.html.
Abstract
Ink analysis is central to questioned document examination. We applied direct analysis in real time mass spectrometry (DART MS) to ballpoint, gel, and fluid writing ink analysis. DART MS acquires the mass spectrum of an ink while it is still on a document without altering the appearance of the document. Spectra were acquired from ink on a variety of papers, and the spectrum of the blank paper could be subtracted out to produce a cleanly isolated ink spectrum in most cases. Only certain heavy or heavily processed papers interfered. The time since an ink is written on paper has a large effect on its spectrum. DART spectra change radically during the first few months after an ink is written as the more volatile components evaporate, but the spectra stabilize after that. A library-search study involving 166 well-aged inks assessed the ability to identify inks from their DART spectra. The aggregate success rate was 92%.
Keywords
direct analysis in real time, forensic science, ink, ink identification, mass spectrometry, questioned documents
Disciplines
Biochemistry, Biophysics, and Structural Biology | Forensic Science and Technology | Mechanical Engineering
Comments
NOTICE: this is the author’s version of a work that was accepted for publication inForensic Science
International. Changes resulting from the publishing process, such as peer review, editing, corrections, structural formatting, and other quality control mechanisms may not be reflected in this document. Changes may have been made to this work since it was submitted for publication. A definitive version was subsequently
published inForensic Science International231 (2013): 73, doi:10.1016/j.forsciint.2013.04.016.
1
Analysis of Writing Inks on Paper Using Direct Analysis in Real Time Mass Spectrometry
Roger W. Jonesa and John F. McClellandb
aAmes Laboratory–USDOE and Institute for Physical Research and Technology, 109 Spedding
Hall, Iowa State University, Ames, IA 50011-3020, USA; [email protected]
bAmes Laboratory–USDOE and Institute for Physical Research and Technology, 107 Spedding
Hall, Iowa State University, Ames, IA 50011-3020, USA; [email protected]
ABSTRACT
Ink analysis is central to questioned document examination. We applied direct analysis in real time mass spectrometry (DART MS) to ballpoint, gel, and fluid writing ink analysis. DART MS acquires the mass spectrum of an ink while it is still on a document without altering the appearance of the document. Spectra were acquired from ink on a variety of papers, and the spectrum of the blank paper could be subtracted out to produce a cleanly isolated ink spectrum in most cases. Only certain heavy or heavily processed papers interfered. The time since an ink is written on paper has a large effect on its spectrum. DART spectra change radically during the first few months after an ink is written as the more volatile components evaporate, but the spectra stabilize after that. A library-search study involving 166 well-aged inks assessed the ability to identify inks from their DART spectra. The aggregate success rate was 92%.
KEYWORDS: forensic science, ink, questioned documents, mass spectrometry, ink
identification, direct analysis in real time
1. Introduction
Documentation is required in all aspects of modern society. Documents have therefore become a major tool for criminals. Questioned document examination is a broad field that includes the functioning of printers and copiers, handwriting examination, the physical structure and chemical makeup of paper, and the aging of documents. A universal aspect, however, is ink. Writing ink is particularly important because of the significance of signatures and handwritten records. Analysis of ink can determine whether writing has been altered, whether a document has been back dated, what the relative ages of ledger entries are, and the approximate age of the document [1]. A central aspect of ink examination is determining the formulation of the ink. Once the formulation of an ink has been identified, its production dates, geographic distribution, and prevalence can be determined [2,3].
and possible interferences must be taken into account [3]. On the other hand, a match by optical examination implies only that the samples are similar inks. TLC provides more information about an ink, including limited formulation data. Ink analysis by chromatography has been growing since the 1950s [10] and is now a mature technique. TLC provides a stronger link between two matching samples than optical examination does, but the analysis is usually limited to the colored and fluorescent components of the ink [11]. Just as in optical examination, a collection of reference inks must be maintained, however recent work has been aimed at making the TLC analysis results more standardized and amenable to inclusion in a digital database [12]. A match between inks by TLC analysis does not prove that the inks are the same, only that they have similar formulas involving the same nonvolatile colored or fluorescent constituents [4,5].
Other analysis techniques have been successfully applied to inks, including high-performance liquid chromatography (HPLC) [13–15], capillary zone electrophoresis [15,16], X-ray fluorescence [15,17–19], surface-enhanced Raman spectroscopy (SERS) [20–22], and FT-IR spectroscopy [7,15,18,23,24]. These generally provide more compositional information than TLC does, and some of them lend themselves to computer-searchable libraries, so a reference collection of inks need not be maintained. The greater amount of information provides more characterizing features with which to identify or date inks [25]. Nevertheless, they have disadvantages. X-ray fluorescence is limited to elemental analysis. Some methods, like FT-IR spectroscopy, suffer from overlap of features from various ink (and possibly paper) components and so do not provide enough characteristic information to reliably distinguish similar ink formulations from one another [23]. Those that separate an ink into its components (i.e., HPLC, capillary zone electrophoresis) are slow and do not provide sufficient characteristic information on the components either for building a digital library or for reliably distinguishing ink formulations.
We have applied the mass spectrometry (MS) sampling interface called direct analysis in real time (DART) to the forensic analysis of inks because it provides detailed chemical information on inks, takes advantage of the power of modern computer databases, and is well suited to ink analysis [26,27]. DART MS samples ink directly from a document without altering the appearance of the document because no sample needs to be cut out, and it removes so little of the dyes and pigments that constitute the visible portion of the ink [27].
Conventional mass spectrometry has been used to analyze inks extracted from paper [28– 30]. The resulting spectra are dominated by the ink dyes, which are the most abundant components of dry ink. The mass spectrometry results allowed individual dyes in an ink to be identified, but the inks studied could not always be differentiated from one another because many inks have nearly identical dye content [29,30]. Fortunately, DART detects many components other than dyes.
Unfortunately, DESI samples a specimen using a fine spray of solvent, so it could alter the document.
Since its commercial introduction in 2005, DART mass spectrometry has attracted substantial interest in the forensic community. It has been applied to the identification of counterfeit drugs [43,44], illegal drugs [45–48], drugs in urine [45,49] and plasma [50], chemical warfare agents [45], explosives [45], and arson accelerants [45,51].
2. Material and methods
The instrument used was a JMS-T100DART AccuTOF-D mass spectrometer (JEOL USA). This consists of a time-of-flight mass spectrometer with a DART 100 ion source. The DART source has been described in detail elsewhere [26]. The present method is similar to that used for a previous note on ink analysis [27]. In the present application, helium gas at 3.25 L/min passed through a hydrocarbon filter (Restek Corp.) and then into the DART discharge chamber where the needle electrode was held at -3500 V. This produced both helium ions and metastable (i.e., electronically excited) helium atoms. The gas then passed through the discharge and grid electrodes, which were at 150 V and 650 V, respectively, to prevent the passage of ions but allow passage of the metastable helium. The heater between these electrodes was set to 255 °C. This temperature helps evaporate material from the sample without discoloring the paper. After passing through the grid electrode, the hot, metastable-containing helium entered the open-air gap between the DART source and the mass spectrometer inlet orifice. This adjustable gap was set to 1.17 cm in length. The metastable helium ionized moisture in the room air in the gap, producing protonated water clusters, (H2O)nH+. The sample to be analyzed was held in the
helium stream approximately in the middle of this gap and the hot gas, metastable helium, and protonated water clusters combined to evaporate and ionize material from the sample. The ions were then swept into the mass spectrometer to be analyzed.
The ink-on-paper samples were held in a custom sample mount in which the paper sample wrapped around the rounded end of a metal support and was held on the support by a thin aluminum plate that exactly fitted over it. The plate had a 3.2 mm square hole, which defined the area exposed to the DART sampling stream. The support also had a hole in it that aligned with the hole in the cover plate. The tested area of the paper sample was therefore free standing. The sample mount was on the end of a short, pivoting arm that rotated the sample into position in the sampling stream so that all samples were reproducibly positioned in the same location during testing. The mount was electrically connected to the spectrometer inlet orifice. Fresh fingerprint residue is easily detected using DART, so gloves were worn when handling the samples.
The mass spectrometer was operated in positive ion mode. The inlet orifice (Orifice 1) was set at 20 V and 80 °C, Orifice 2 was 3 V, and the ion guide high-frequency voltage (Peaks Voltage) was 600 V. The low orifice voltages produced minimal fragmentation of the ions. As a result, the DART mass spectra were dominated by protonated molecules, (M + H)+, where M is
the parent molecule.
recording the mass spectrum of a mixture of polyethylene glycols with an average molecular weight of 600 (PEG 600) in each data file. The mass scales for all spectra within the file were then calibrated using the PEG 600 spectrum. Once calibrated, the mass scale was accurate to approximately 0.003 u. This accuracy often allows elemental composition assignments to be made for individual spectrum peaks.
Centroided mass spectra were exported to the NIST Mass Spectral Search Program (Version 2.0) for library creation and searching. The NIST program records masses only to integer accuracy so the library tests do not take full advantage of the observed mass accuracy of the spectrum peaks. Library searches were done using the Quick Identity search with no limits on m/z or abundance ranges. Reverse searching was used for comparing the effects of paper, and forward searching was used for ink identification. A match factor of 999 corresponds to a perfect match between spectra.
All samples used in this study were prepared by drawing ink lines freehand on paper. The specific inks and papers used for each aspect of the study are given in Section 3.
3. Results and discussion
3.1. Effects of paper
How the paper on which an ink is written affects the DART mass spectrum was examined by comparing spectra of the same ink on different papers. Single, straight lines of ink were written freehand on 16 different papers. The 16 papers used were mostly white office paper (Champion Benefit Writing, Crane’s Resume, Great White Multipurpose 20, Hammermill Color Copy, Hammermill Color Laser Gloss, Hammermill Fore DP, Hammermill Great White Copy, HP Color Inkjet, and Staples Copy), but a wide variety of other papers was also included (Ampad Evidence ruled pad, yellow Post-It Note, Whatman #1 filter paper, goldenrod colored paper, a notepaper with printing beneath the written ink, a brown manila envelope, and a white letterhead envelope). The inks tested were black Zebra Rubber 80 ballpoint, black Bic Cristal Gel Roller, and blue Mont Blanc Le Grand Rollerball. The sample sheets were stored in a file folder in the dark for 8–9 months after being written before being tested. Spectra from three
different specimens of each ink on each of the 16 papers were acquired, and the spectra were placed in NIST-software libraries, one library for each ink. All 48 spectra for each ink were then searched against the library for that ink and the match factors were noted. The median match factor for each ink spectrum matching with all 45 spectra of specimens on different paper (matches with specimens on the same paper were excluded) was determined to see how well spectra match up across differing papers. The distributions of these median match factors are shown in Figure 1 for each ink.
counterparts. The median of this distribution of medians is 861, which is a very good match quality.
Panel B of Fig. 1 shows the distribution of median match factors for the 48 black Bic Cristal Gel Rolling Ball ink spectra. The median of this distribution of medians is 829, so it is centered somewhat lower than the corresponding distribution in the ballpoint-ink study, but it still corresponds to good-quality matching. There are no particularly low medians, and the glossy paper samples did not interfere with matching for this ink. The somewhat lower distribution than that of the ballpoints may be because the gel ink spectrum is somewhat weaker and has fewer peaks than the ballpoint spectrum.
Panel C of Fig. 1 shows the distribution of median match factors for the 48 Le Grand fluid-ink specimens. This distribution is centered at a lower quality level than the distributions of the other two inks, with the median of these medians being 765. In addition there are five specimens with median match factors below 620. One of these is a Hammermill Color Laser Gloss specimen, which is the same paper that proved difficult in the ballpoint ink matching, but three of these are Crane’s Resume Paper specimens, so the Crane’s paper is the problem substrate for this ink. Fluid inks, compared to gels and ballpoints, tend to soak into the paper more, which makes them harder to sample by DART mass spectrometry, so their DART spectra are
generally weaker than those of ballpoints and gels. This may be the reason why the Le Grand ink distribution is the lowest one in Fig. 1. The Crane’s Resume paper is particularly thick and is a 100% cotton paper with little sizing, so it may be unusually effective at soaking up and holding the ink, making it more difficult to analyze by DART. By contrast, the highest median hit quality in Panel C (830) comes from one of the specimens on Ampad Evidence paper, a physically thin paper.
3.2. Effects of ink age
When ink is written on paper, it immediately starts losing various volatile components, so its mass spectrum will change over time. We have examined how the DART spectra of a black ballpoint ink (Bic Round Stic), a black gel ink (Bic Cristal Gel Roller Ball), and a blue fluid ink (Mont Blanc Le Grand Rollerball) change as they age after being written on paper. Freehand lines were periodically written on ordinary white office paper (Hammermill Fore DP) over a
Median Match Factor
[image:7.612.322.532.75.426.2]500 600 700 800 900 1000 P er ce nt o f F lu id-Ink Sa m pl es 0% 10% 20% 30% Pe rc en t of G el-In k S am pl es 0% 10% 20% 30% Pe rc en t of B allp oi nt S am ple s 0% 10% 20% 30% A B C * * *
Fig. 1. Reverse-search median match factors for inks
period of 11 months to generate writings of various known ages. The writing samples were stored in a file folder in the dark with a blank sheet of paper alternating between sheets containing writing. We chose this method of storage both because it simulates the typical storage of important documents and because it would probably correspond to the slowest possible aging, because it would impede the loss of volatile components, and would therefore be the worst-case scenario for use of a DART database for ink identification. DART spectra of the samples were acquired at the end of the 11-month, sample-generating period.
Fig. 2 shows the DART spectrum for the Bic Round Stic ballpoint ink only four days after being written and after 332 days. The changes are considerable, consisting mostly of the reduction in the size of peaks in the region below
m/z 250. Most higher-mass peaks appear
unaffected by age. The lower-mass region
contains peaks from the more volatile components of the ink, so the changes observed are to be expected. A number of the peaks in the spectra can be identified. For example, the peak at m/z
367.210 corresponds to (C20H30O6 + H)+, which is protonated dibutylglycol phthalate. This peak
has been used as a reference for scaling the other peaks in Fig. 2. It is the largest peak (i.e., base peak) in the ballpoint spectra after three months, and it appears to be stable over time. Another example is the peak at m/z 139.076, which is (C8H10O2 + H)+. This is protonated
phenoxyethanol, a common vehicle component in ballpoint inks [52]. Dyes appear in the DART spectra of inks, but they do not necessarily produce prominent peaks. The principal dye in the ballpoint ink is crystal violet [53], which is a cationic dye, C25H30N3+, but there is only a tiny
peak at the mass of that cation (m/z 372.244). We have examined the mass spectrum of the neat
dye and found that it produces an ion equivalent to two hydrogens being added to the parent cation, (C25H30N3 + 2H)+ [27]. Its mass of 374.260 u coincides with the 374 peak marked in
Figure 2, whose exact observed m/z is 374.264. Given the small size of this peak, it may come
from a contaminant possibly present in the dye, leucocrystal violet. Leucocrystal violet is the colorless, reduced (and hence neutral) form of crystal violet used for enhancing impressions in blood [54]. It has the formula C25H31N3, so the observed ion would be the protonated molecule.
Fig. 3 shows how the heights of some of the peaks marked in Fig. 2 change over time. The m/z 367 peak has again been used as a reference for scaling the other peaks. Four peaks that
are stable or nearly stable over time are shown in the lower panel of Fig. 3. Most do not vary much in height from one ink age to the next and show no concentration trend after the first three or four months. The m/z 183 peak in the bottom panel, however, shows substantially more
scatter from one age to the next, although its intensity has little trend over time. We have found that many inks have a few peaks with greater intensity scatter than the typical peak in their spectra. We hypothesize that these peaks correspond to compounds whose degree of volatility makes their desorption from the paper during the DART analysis very sensitive to the exact
m/z
100 200 300 400
0 50 100 150 200 Re la ti ve I nt en si ty ( m /z 3 67 = 1 00 ) 0 50 100 150 200 269 100 351 139 199 183 165 200 139 351 269 183 100
4 Days Old 332 Days Old
367
165
367
[image:8.612.320.531.77.321.2]374 374
Fig. 2. DART mass spectra of Bic Round Stic black
analysis conditions, so small changes in DART-stream temperature or positioning in the DART stream affects them far more than the other components in the inks. The three peaks plotted in the upper panel all decrease over time and correspond to more volatile compounds. The smooth curves drawn through their data points are all single or double exponential fits to the data, which suggests that their disappearances from the paper follow these kinetics. This is consistent with what others have found for ink aging [55,56]. It is apparent that the volatile components are greatly reduced after 6 months, and that all of the components have either disappeared, stabilized, or are very close to doing so after 11 months.
Fig. 4 shows the spectra of black Bic Cristal Gel Roller Ball ink at nine and 336 days after being written. There are far fewer peaks for the gel ink than for the ballpoint ink, which is generally true for those two ink types. Roughly half of the largest peaks in the fresh-ink spectrum are of components that disappear over time. The remaining large peaks and several small peaks appear to be stable. The time dependences for many of the peaks are shown in Fig. 5. The base peak in the spectra is m/z 150.114, protonated triethanolamine (C6H15NO3 + H)+. It
is the most stable of the large peaks. The lower panel of Fig. 5 plots the peaks with observed m/z
of 106.088 (protonated diethanolamine, (C4H11NO2 + H)+), 168.127 (probably unprotonated
dipentene diepoxide, C10H16O2+), and 195.124 (protonated tetraethylene glycol, (C8H18O5 + H)+).
Tetraethylene glycol slowly disappeared over time, but the other two show a slow rise in relative intensity. It is very unlikely that the concentrations of these two species grow, so the rise probably means these components are stable and the base peak used for scaling is very slowly shrinking. The four peaks in the upper panel show various behaviors. Like m/z 106 and 168, the
peak at observed m/z 148.100 (probably unprotonated dipropylene glycol monomethyl ether,
C7H16O3+) rises slowly, indicating a stable component. On the other hand, m/z 301.186 (not
identified) disappears completely. Pentaethylene glycol ((C10H22O6 + H)+, observed at m/z Age (days)
0 100 200 300
0 50 100 150 m/z 165 m/z 183 m/z 269 m/z 351 Re la ti ve I nt en si ty ( m /z 3 67 = 1 00 ) 0 50 100 150 200 250 300 m/z 100 m/z 139 m/z 199 m/z
100 150 200 250 300 350 400
0 20 40 60 80 100 Re la ti ve I nt en si ty ( m /z 1 50 = 1 00 ) 0 20 40 60 80 100 239 106 150 148 195 151 168 195 150 301 239 151 106
9 Days Old 336 Days Old
[image:9.612.75.287.73.332.2]148 168
Fig. 3. Relative intensities of peaks in the DART mass
[image:9.612.316.535.79.329.2]spectrum of Bic Round Stic black ballpoint ink as it ages after being written.
Fig. 4. DART mass spectra of Bic Cristal Gel black
239.151) disappears so slowly that about half of it is still present after 11 months. The triethylene glycol peak ((C6H14O4 + H)+, observed m/z 151.102) has a lot of scatter, but it does
not show much age-related trend. With the exception of the m/z 195 and 239 peaks, which are
still decreasing, the spectrum appears to be stable after 11 months.
The fluid ink examined was blue Mont Blanc Le Grand Rollerball ink. Fig. 6 shows the spectra of this ink 4 and 340 days after being written. Fig. 7 shows the time evolution of 11 example peaks in the spectra. Most of the peaks in the Le Grand spectra fall into one of three homologous series. The ions observed at m/z 151.101, 195.126, 239.152, 283.178, 327.207,
371.233, and 415.254 are all protonated polyethylene glycols. The observed m/z values of
successive peaks in the series differ by 44.026 u (±0.005 u), which corresponds to the exact mass of the ethylene glycol unit C2H4O. The observed polyethylene glycol ions have the formula
(HO(C2H4O)nH + H)+, with n ranging from 3 up to 9. The second homologous series consists of
the peaks observed at m/z 211.132, 255.159, 299.185, 343.214, 387.243, 431.267, and 475.292.
Successive peaks in this series also differ by 44.026 u (±0.003 u), so they must also consist of strings of C2H4O units. They are polyethylene glycol derivatives having the overall formula
[C8H10O(C2H4O)n + H]+ with n ranging from 2 to 8. Just how the atoms in C8H10O are
distributed between the two ends of the (C2H4O)n chain cannot be determined from the mass
spectral data. One strong possibility is the polyethylene glycol ethyl phenyl diethers, C2H3O(C2H4O)nC6H5. These are, in essence, derivatives of phenoxyethanol, HO(C2H4O)C6H5, a
common ink solvent [52]. The third homologous series consists of the peaks observed at m/z
256.179, 300.206, 344.231, 388.257, 432.288, and 476.313. Again, these peaks are separated by 44.026 u (±0.005 u) and must be polyethylene glycol derivatives. Their exact identity, however, is unclear. Two formulas have masses very close to the observed values. They are C7H12N2(C2H4O)n+ with n = 3 through 8 and C16H20(C2H4O)m+ with m = 1 through 6. Unlike in
the other glycol series, both of these are probably not protonated molecules. The C7H12N2 Age (days)
0 100 200 300
0 10 20 30 m/z 106 m/z 168 m/z 195 R el ati ve I nt en si ty (m /z 1 50 = 1 00 ) 0 10 20 30 40 50 60
70 m/z 148
m/z 151 m/z 239 m/z 301
m/z
100 200 300 400 500
0 20 40 60 80 100 R ela ti ve I nt ens it y ( m /z 239 = 100) 0 20 40 60 80 100 239 121 195 256 255256 283 300 299 327 343 344 327 299 300 283 239 195 121 387 4 Days Old
340 Days Old
[image:10.612.76.285.77.338.2]371 151 151 150 212 212 211 388 432 431 415 476 475 403
Fig. 5. Relative intensities of peaks in the spectra of
[image:10.612.312.533.81.337.2]formula, however, would require the presence of amines, pyrroles, or other nitrogen-containing chemical species that are easily protonated, so this formula is the less likely of the two.
There are two prominent peaks in the Le Grand spectra that are not part of the three glycol series. Protonated acetophenone is observed at m/z 121.075, and at m/z 403.193 is
an unidentified species. As can be seen in Fig. 7, this species is not present in the fresh ink and grows in over time, so it is not a component of the commercial ink. This makes it very difficult to identify from the DART data alone. Its observed m/z is consistent with several formulas
corresponding to stable compounds, although none are commonly used industrially. Of course, because the species develops after the ink is written, it does not have to be a commercial compound.
The data in Fig. 7 have been scaled to the m/z 239 peak of pentaethylene glycol, which
is the base peak of the spectra at all ink ages, and it appears to be stable over time. Three other polyethylene glycol peaks, m/z 195, 283
and 327, are plotted in the figure. The m/z 195
peak has a lot of scatter but does not show a trend with age greater than the scatter. Both m/z
283 and 327 have much less scatter. They do not show much change over the first 3 or 4 months but then drop to a lower level where they appear to stabilize. Although these and the other (unplotted) polyethylene glycols decrease relative to m/z 239, they are the slowest of the three
homologous series to decrease and dominate the spectra at long times. Three of the polyethylene glycol diethers (m/z 255, 299, and 343) are plotted in Fig. 7. All three of these have a single or
double exponential decrease toward zero concentration. The top panel of Fig. 6 shows that m/z
299 is the only member of this homologous series still present after 340 days. The third series is represented by m/z 256, 300, and 344 in Fig. 7. All show a single-exponential decay with time,
but m/z 256 appears to be decaying to a non-zero level while the other two are decaying to zero.
Fig. 7 shows that m/z 256 is the slowest to decay among the members of this homologous series,
although m/z 300 is also present after 340 days. Acetophenone at m/z 121 appears not to be
decaying over time, although it shows considerable scatter. As previously mentioned, the unidentified peak at m/z 403 starts at zero intensity and grows with age. The best fit through the
observed data points is a simple power plot of the form Intensity = at3.625, where a is a constant
and t is the age of the writing. Obviously this growth must terminate at some point, but that
termination is not apparent in the data through 340 days. With the exception of the m/z 403
peak, the spectrum appears to be nearly stable after 340 days.
Age (days)
0 100 200 300
0 20 40 60
80 m/z 195m/z 300
m/z 327 m/z 343 m/z 344 m/z 403
Re
la
ti
ve
I
nte
ns
it
y (
m
/z
2
39
=
1
00
)
0 20 40 60 80 100
[image:11.612.321.529.75.385.2]m/z 121 m/z 255 m/z 256 m/z 283 m/z 299
Fig. 7. Relative intensities of peaks in the spectra of
Table 1. Percentage of unknown ink spectra correctly identified by library search.
Ink type
Black inks Blue inks
No. of inks in library
Correct identifications (%)
No. of inks In library
Correct identifications (%)
Ballpoint 48 99 28 100
Fluid 26 81 24 77
Gel 21 93 19 97
3.3. Ink identification using a library
The identification of an ink by DART MS requires reference mass spectra for comparison. A library-search study was used to assess the ability to identify an unknown ink from its DART mass spectrum. Our library consisted of 166 inks; 48 black and 28 blue ballpoints, 26 black and 24 blue fluid inks, and 21 black and 19 blue gel inks. They covered a wide variety of brand names, including all major suppliers on the US market, and the pens were bought locally. The spectra were acquired from ink lines written freehand on Whatman #1 filter paper. Most had been written 10–35 months prior to testing and so were well aged. For each of
the 166 inks, spectra from two specimens were acquired and placed in a library built with the NIST Mass Spectral Search Program. Both spectra of each ink were also used as unknowns and searched against the library. Of course, because all of the unknowns were also library entries, each spectrum matched perfectly with itself. This perfect match was ignored, and the next closest match was considered the “best” match, or Hit #1. The ink was considered to be correctly identified only if Hit #1 was the other spectrum entered in the library for the same ink. The inks were separated by color and type during the searches; that is, the searches were done on six separate libraries, one each for the black ballpoint, blue ballpoint, black fluid, blue fluid, black gel, and blue gel inks. When searches were done using a single, unified library, the number of correct matches dropped somewhat for the fluid and gel inks. Most of the additional incorrect matches were for one color of ink matching with a similar ink of a different color, so they were matches that would be easily discounted when carrying out real-world casework.
Table 1 gives the results of this search test in terms of the percentage of correct Hits #1. The aggregate success rate was 92% for all 166 inks (i.e., 306 correct matches in 332 spectrum searches). The ballpoints as a group gave excellent results, with only one mismatch among the 152 searches. At the opposite end were the fluid inks, for which there were 21 mismatches among 100 searches. Fluid inks as a group produce weaker DART spectra than the others. They soak into the paper far more, which may make it more difficult for DART to sample material from the specimens.
the other Elite spectrum (match factor 857). Even when the closest match is the correct one, the second closest match (i.e., the closest incorrect
match) reveals the kinship among inks. There were nine PaperMate black ballpoints included in our library, so there were 18 searches involving PaperMate “unknowns.” In 11 of these 18 searches, the closest incorrect match was another PaperMate ink.
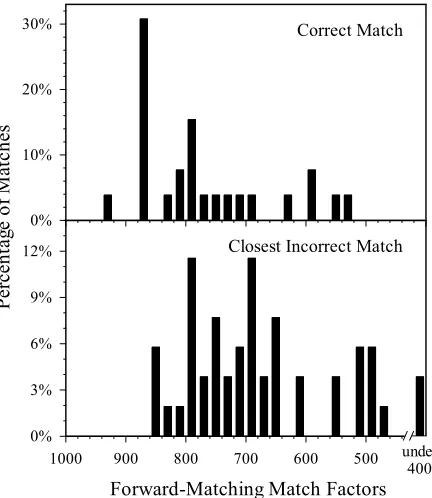
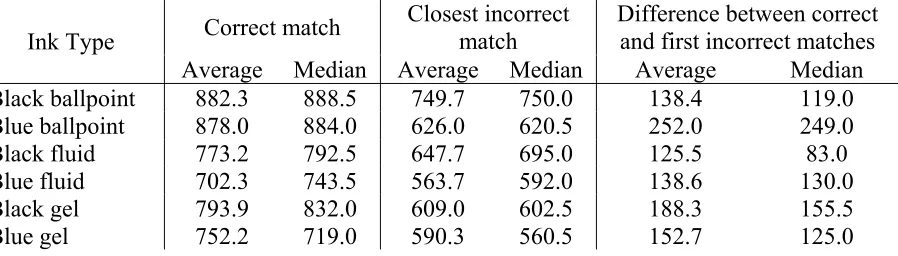
Another measure of the quality of the ink identifications is the difference between the match factor for the correct match and the match factor for the closest incorrect match. The greater this difference, the more certain the identification provided by Hit #1 is. Figs. 8 through 10 show the distribution of match factors for the correct matches and for the closest incorrect matches for black ballpoint, gel, and fluid inks. In addition, Table 2 lists the average and median match factors for the correct and closest incorrect matches for the six different ink types. A match factor of 999 corresponds to a perfect match.
Forward-Matching Match Factors 500 600 700 800 900 1000 0% 3% 6% 9% 12% P er ce nt ag e of Ma tc he s 0% 10% 20%
30% Correct Match
[image:13.612.313.531.78.322.2]Closest Incorrect Match
Fig. 8. Distribution of match factors for the correct
match (upper panel) and closest incorrect match (lower panel) for 96 spectra from 48 black ballpoint inks searched against a library of the same 96 spectra.
Forward-Matching Match Factors 400 600 800 1000 0% 3% 6% 9% 12% P erc en ta ge o f M at ch es 0% 5% 10% 15%
20% Correct Match
Closest Incorrect Match
[image:13.612.75.295.79.320.2]under 300
Fig. 9. Distribution of match factors for the correct
match (upper panel) and closest incorrect match (lower panel) for 42 spectra from 21 black gel inks searched against a library of the same 42 spectra.
Fig. 10. Distribution of match factors for the correct
match (upper panel) and closest incorrect match (lower panel) for 52 spectra from 26 black fluid inks searched against a library of the same 52 spectra.
Forward-Matching Match Factors
400 500 600 700 800 900 1000 0% 3% 6% 9% 12% P er ce nt ag e o f Ma tc he s 0% 10% 20%
30% Correct Match
Closest Incorrect Match
[image:13.612.317.533.416.665.2]Table 2. Average and median match factors in forward-matching ink identification.
Ink Type Correct match
Closest incorrect match
Difference between correct and first incorrect matches Average Median Average Median Average Median Black ballpoint 882.3 888.5 749.7 750.0 138.4 119.0 Blue ballpoint 878.0 884.0 626.0 620.5 252.0 249.0 Black fluid 773.2 792.5 647.7 695.0 125.5 83.0 Blue fluid 702.3 743.5 563.7 592.0 138.6 130.0 Black gel 793.9 832.0 609.0 602.5 188.3 155.5 Blue gel 752.2 719.0 590.3 560.5 152.7 125.0
Patterns can be discerned from the table and figures. First, the ballpoints have the best match factors for correct matches. The ballpoint inks tend to produce spectra that are both stronger and have more peaks than inks in the other categories do, so the data are of better and richer quality. The black ballpoints also have higher match factors for the closest incorrect match. The black ballpoints appear to be the most uniform of the writing ink categories, which could make differentiating one ink from another more difficult. Fortunately, the quality of the ballpoint data appears to be more than sufficient to compensate for this. The fluid inks have low match factors for both correct matches and closest incorrect matches, which is consistent with the lower successful match rate and weaker spectra discussed above. The top panel of Fig. 9 shows two correct matches with particularly low match factors (both 479), which come from spectra of a Pentel Sunburst Gel pen. These two spectra are responsible for two of the three incorrect matches among the black gel inks. The blue Sunburst ink was responsible for the only incorrect match among the blue gels. This pen model produces inconsistent DART spectra for an undetermined reason. The other gel inks were much better behaved.
Conclusions
In summary, DART mass spectra are easily obtained from ink on paper without visual alteration of the document. The ink spectra are usually only weakly affected by the paper on which the ink is written, although certain highly processed or coated papers may cause interference, and thick, absorbent papers reduce test accuracy for fluid inks. During the first few months after an ink is written on paper, its DART spectrum changes as the more volatile components of the ink are lost, but the changes have generally attenuated before a year has passed. Ink identification by searching DART mass spectra of ink against libraries of reference ink spectra is generally successful for all types of inks and especially accurate for ballpoint and gel inks.
Acknowledgements
of Science, Office of Basic Energy Sciences, of the US Department of Energy under Contract No. DE-AC02-07CH11358.
References
[1] R.L. Brunelle, Questioned document examination, in: R. Saferstein (Ed.), 2nd edition,
Forensic Science Handbook, vol. 1, Prentice Hall, Upper Saddle River, NJ, 2002, pp. 697– 744.
[2] R.L. Brunelle, Ink analysis, in: J.A. Siegel, R.J. Saukko, G.C. Knupfer (Eds.), Encyclopedia of Forensic Sciences, Vol. 2, Academic Press, New York, 2000, pp. 591– 597.
[3] ASTM Standard E 1789–04, Guide for writing ink identification, Annual Book of ASTM Standards, vol. 14.02, ASTM International, West Conshohoken, PA, 2008, pp. 558–563. [4] ASTM Standard E 1422–05. Standard guide for test methods for forensic writing ink
comparison, Annual Book of ASTM Standards, vol. 14.02, ASTM International, West Conshohoken, PA, 2008, pp. 399–406.
[5] D.A. Crown, D. Crim, R.L. Brunelle, A.A. Cantu, The parameters of ballpen ink examinations, J. Forensic Sci. 21 (1976) 917–922.
[6] A.A. Cantu, Analytical methods for detecting fraudulent documents, Anal. Chem. 63 (1991) 847A–854A.
[7] V. Causin, R. Casamassima, C. Marega, P. Maida, S. Schiavone, A. Marigo, A. Villari, The discrimination potential of ultraviolet-visible spectrophotometry, thin layer chromatography, and Fourier transform infrared spectroscopy for the forensic analysis of black and blue ballpoint inks, J. Forensic Sci. 53 (2008) 1468-1473.
[8] C. Neumann, P. Margot, New perspectives in the use of ink evidence in forensic science: part I. Development of a quality assurance process for forensic ink analysis by HPTLC, Forensic Sci. Int. 185 (2009) 29–37.
[9] C. Neumann, P. Margot, New perspectives in the use of ink evidence in forensic science: part II. Development and testing of mathematical algorithms for the automatic comparison of ink samples analysed by HPTLC, Forensic Sci. Int. 185 (2009) 38–50.
[10] A.W. Somerford, Comparison of writing inks by paper chromatography, J. Crim. Law Criminol. Police Sci. 43 (1952) 124–127.
[11] J.D. Kelly, A.A. Cantu, Proposed standard methods for ink identification, J. Assoc. Off. Anal. Chem. 58 (1975) 122–125.
[12] C. Neumann, R. Ramotowski, T. Genessay, Forensic examination of ink by high-performance thin layer chromatography–the United States Secret Service Digital Ink Library, J. Chromatogr. A 1218 (2011) 2793-2811.
[13] P.C. White, B.B. Wheals, Use of a rotating disc multiwavelength detector operating in the visible region of the spectrum for monitoring ball pen inks separated by high-performance liquid chromatography, J. Chromatogr. 303 (1984) 211–216.
[14] X.-F. Wang, J. Yu, M.-X. Xie, Y.-T. Yao, J. Han, Identification and dating of the fountain pen ink entries on documents by ion-pairing high-performance liquid chromatography, Forensic Sci. Int. 180 (2008) 43–49.
[16] E. Rohde, A.C. McManus, C. Vogt, W.R. Heineman, Separation and comparison of fountain pen inks by capillary zone electrophoresis, J. Forensic Sci. 42 (1997) 1004–1011. [17] D.E. Polk, A.E. Attard, B.C. Giessen, Forensic characterization of papers. 2.
Determination of batch differences by scanning electron-microscopic elemental analysis of inorganic components, J. Forensic Sci. 22 (1977) 524–533.
[18] J. Zięba-Palus, M. Kunicki, Application of the micro-FTIR spectroscopy, Raman spectroscopy, and XRF method examination of inks, Forensic Sci. Int. 158 (2006) 164– 172.
[19] S. Dhara, N.L. Misra, S.D. Maind, S.A. Kumar, N. Chattopadhyay, S.K. Aggarwal, Forensic application of total reflection X-ray fluorescence spectrometry for elemental characterization of ink samples, Spectrochim. Acta B 65 (2010) 167–170.
[20] T. Andermann, Raman spectroscopy of ink on paper, Probl. Forensic Sci. 46 (2001) 335– 344.
[21] R.M. Seifar, J.M. Verheul, F. Ariese, U.A.T. Brinkman, C. Gooijer, Applicability of surface-enhanced resonance Raman scattering for the direct discrimination of ballpoint pen inks, Analyst 126 (2001) 1418–1422.
[22] I. Geiman, M. Leona, J.R. Lombardi, Application of Raman spectroscopy and surface-enhanced Raman scattering to the analysis of synthetic dyes found in ballpoint pen inks, J. Forensic Sci. 54 (2009) 947–952.
[23] R.A. Merrill, E.G. Bartick, Analysis of ballpoint pen inks by diffuse reflectance infrared spectrometry, J. Forensic Sci. 37 (1992) 528–541.
[24] E.G. Bartick, M.W. Tungol, J.A. Reffner, A new approach to forensic analysis with infrared microscopy: internal reflection spectroscopy, Anal. Chim. Acta 288 (1994) 35–42. [25] A.A. Cantu, A sketch of analytical methods for document dating: part I. The static
approach: determining age independent analytical profiles, Int. J. Forensic Doc. Exam. 1 (1995) 40–51.
[26] R.B. Cody, J.A. Laramée, H.D. Durst, Versatile new ion source for the analysis of materials in open air under ambient conditions, Anal. Chem. 77 (2005) 2297–2302.
[27] R.W. Jones, R.B. Cody, J.F. McClelland, Differentiating writing inks using direct analysis in real time mass spectrometry, J. Forensic Sci. 51 (2006) 915–918.
[28] M. Sakayanagi, J. Komuro, Y. Konda, K. Watanabe, Y. Harigaya, Analysis of ballpoint pen inks by field desorption mass spectrometry, J. Forensic Sci. 44 (1999) 1204–1214. [29] L.-K. Ng, P. Lafontaine, L. Brazeau, Ballpoint pen inks: Characterization by positive and
negative ion-electrospray ionization mass spectrometry for the forensic examination of writing inks, J. Forensic Sci. 47 (2002) 1238–1247.
[30] M.R. Williams, C. Moody, L.-A. Arceneaux, C. Rinke, K. White, M.E. Sigman, Analysis of black writing ink by electrospray ionization mass spectrometry, Forensic Sci. Int. 191 (2009) 97–103.
[31] D.M. Grim, J. Siegel, J. Allison, Evaluation of desorption/ionization mass spectrometric methods in the forensic applications of the analysis of inks on paper, J. Forensic Sci. 46 (2001) 1411–1420.
[32] D.M. Grim, J. Siegel, J. Allison, Evaluation of laser desorption mass spectrometry and UV accelerated aging of dyes on paper as tools for the evaluation of a questioned document, J. Forensic Sci. 47 (2002) 1265–1273.
[34] J.D. Dunn, J.A. Siegel, J. Allison, Photodegradation and laser desorption mass spectrometry for the characterization of dyes used in red pen inks, J. Forensic Sci. 48 (2003) 652–657.
[35] C. Weyermann, D. Kirsch, C. Costa-Vera, B. Spengler, Photofading of ballpoint dyes studied on paper by LDI and MALDI MS, J. Am. Soc. Mass Spectrom. 17 (2006) 297– 306.
[36] C. Weyermann, R. Marquis, W. Mazzella, B. Spengler, Differentiation of blue ballpoint pen inks by laser desorption ionization mass spectrometry and high-performance thin-layer chromatography, J. Forensic Sci. 52 (2007) 216–220.
[37] J. Allison, Ink analysis using UV laser desorption mass spectrometry, in: R.D. Blackledge (Ed.), Forensic Analysis on the Cutting Edge: New Methods for Trace Evidence Analysis, Wiley, New York, 2007, pp. 57–79.
[38] J.D. Dunn, J. Allison, The detection of multiply charged dyes using matrix-assisted laser desorption/ionization mass spectrometry for the forensic examination of pen ink dyes directly from paper, J. Forensic Sci. 52 (2007) 1205–1211.
[39] A. He, D. Karpuzov, S. Xu, Ink identification by time-of-flight secondary ion mass spectroscopy, Surf. Interface Anal. 38 (2006) 854–858.
[40] J. Coumbaros, K.P. Kirkbride, G. Klass, W. Skinner, Application of time of flight secondary ion mass spectrometry to the in situ analysis of ballpoint pen inks on paper, Forensic Sci. Int. 193 (2009) 42–46.
[41] J.A. Denman, W.M. Skinner, K.P. Kirkbride, I.M. Kempson, Organic and inorganic discrimination of ballpoint pen inks by ToF-SIMS and multivariate statistics, Appl. Surf. Sci. 256 (2010) 2155–2163.
[42] D.R. Ifa, L.M. Gumaelius, L.S. Eberlin, N.E. Manicke, R.G. Cooks, Forensic analysis of inks by imaging desorption electrospray ionization (DESI) mass spectrometry, Analyst 132 (2007) 461–467.
[43] F.M. Fernández, R.B. Cody, M.D. Green, C.Y. Hampton, R. McGready, S. Sengaloundeth, N.J. White, P.N. Newton, Characterization of solid counterfeit drug samples by desorption electrospray ionization and direct-analysis-in-real-time coupled to time-of-flight mass spectrometry, ChemMedChem 7 (2006) 702–705.
[44] P.N. Newton, C.Y. Hampton, K. Alter-Hall, T. Teerwarakulpana, S. Prakongpan, R. Ruangveerayuth, N.J. White, N.P.J. Day, M.B. Tudino, N. Mancuso, F.M. Fernández, Characterization of “Yaa Chud” medicine on the Thailand–Myanmar border: Selecting for drug-resistant malaria and threatening public health, Am. J. Trop. Med. Hyg. 79 (2008) 662–669.
[45] J.A. Laramée, R.B. Cody, J.M. Nilles, H.D. Durst, Forensic application of DART™ (direct analysis in real time) mass spectrometry, in: R.D. Blackledge (Ed.), Forensic Analysis on the Cutting Edge: New Methods for Trace Evidence Analysis, Wiley, New York, 2007, pp. 175–195.
[46] J.D. Ropero-Miller, P.R. Stout, N.D. Bynum, J.F. Casale, Comparison of the novel direct analysis in real time time-of-flight mass spectrometer (AccuTOF-DART™) and signature analysis for the identification of constituents of refined illicit cocaine, Microgram J. 5 (2007) 34–40.
[48] R.R. Steiner, R.L. Larson, Validation of the direct analysis in real time source for use in forensic drug screening, J. Forensic Sci. 54 (2009) 617–622.
[49] E. Jagerdeo, M. Abdel-Rehim, Screening of cocaine and its metabolites in human urine samples by direct analysis in real-time source coupled to time-of-flight mass spectrometry after online preconcentration utilizing microextraction by packed sorbent, J. Am. Soc. Mass Spectrom. 20 (2009) 891–899.
[50] S. Yu, E. Crawford, J. Tice, B. Musselman, J.-T. Wu, Bioanalysis without sample cleanup or chromatography: the evaluation and initial implementation of direct analysis in real time ionization mass spectrometry for the quantification of drugs in biological matrixes, Anal. Chem. 81 (2009) 193–202.
[51] C.M. Coates, S. Coticone, P.D. Barreto, A.E. Cobb, R.B. Cody, J.C. Barreto, Flammable solvent detection directly from common household materials yields differential results: An application of direct analysis in real-time mass spectrometry, J. Forensic Ident. 58 (2008) 624–631.
[52] G.M. LaPorte, J.D. Wilson, A.A. Cantu, S.A. Mancke, S.L. Fortunato, The identification of 2-phenoxyethanol in ballpoint inks using gas chromatography/mass spectrometry— relevance to ink dating, J. Forensic Sci. 49 (2004) 155–159.
[53] S.J. Pachuta, J.S. Staral, Nondestructive analysis of colorants on paper by time-of-flight secondary ion mass spectrometry, Anal. Chem. 66 (1994) 276-284.
[54] W.J. Bodziak, Use of leuco crystal violet to enhance shoe prints in blood, Forensic Sci. Int. 82 (1996) 45-52.
[55] S. Lociciro, L. Dujourdy, W. Mazzella, P. Margot, E. Lock, Dynamic of the ageing of ballpoint pen inks: quantification of phenoxyethanol by GC-MS, Sci. Justice 44 (2004) 165-171.