www.biogeosciences.net/9/2921/2012/ doi:10.5194/bg-9-2921-2012
© Author(s) 2012. CC Attribution 3.0 License.
Biogeosciences
Reply to Nicholson’s comment on
“Consistent calculation of aquatic gross production from oxygen
triple isotope measurements” by Kaiser (2011)
J. Kaiser1and O. Abe2
1School of Environmental Sciences, University of East Anglia, Norwich, UK 2Graduate School of Environmental Studies, Nagoya University, Nagoya, Japan Correspondence to: J. Kaiser ([email protected])
Received: 13 October 2011 – Published in Biogeosciences Discuss.: 26 October 2011 Revised: 29 June 2012 – Accepted: 3 July 2012 – Published: 3 August 2012
Abstract. The comment by Nicholson (2011a) questions
the “consistency” of the “definition” of the “biological end-member” used by Kaiser (2011a) in the calculation of oxygen gross production. “Biological end-member” refers to the rel-ative oxygen isotope ratio difference between photosynthetic oxygen and Air-O2(abbreviated17δPand18δPfor17O/16O and18O/16O, respectively). The comment claims that this leads to an overestimate of the discrepancy between previ-ous studies and that the resulting gross production rates are “30 % too high”.
Nicholson recognises the improved accuracy of Kaiser’s direct calculation (“dual-delta”) method compared to pre-vious approximate approaches based on17O excess (17∆) and its simplicity compared to previous iterative calculation methods. Although he correctly points out that differences in the normalised gross production rate (g)are largely due to different input parameters used in Kaiser’s “base case” and previous studies, he does not acknowledge Kaiser’s observa-tion that iterative and dual-delta calculaobserva-tion methods give ex-actly the samegfor the same input parameters (disregarding kinetic isotope fractionation during air-sea exchange). The comment is based on misunderstandings with respect to the “base case”17δPand18δPvalues. Since direct measurements of17δP and18δPdo not exist or have been lost, Kaiser con-structed the “base case” in a way that was consistent and compatible with literature data. Nicholson showed that an al-ternative reconstruction of17δP givesgvalues closer to pre-vious studies. However, unlike Nicholson, we refrain from interpreting either reconstruction as a benchmark for the ac-curacy ofg.
A number of publications over the last 12 months have tried to establish which of these two reconstructions is more accurate. Nicholson draws on recently revised measurements of the relative 17O/16O difference between VSMOW and Air-O2 (17δVSMOW; Barkan and Luz, 2011), together with new measurements of photosynthetic isotope fractionation, to support his comment. However, our own measurements disagree with these revised17δVSMOW values. If scaled for differences in18δVSMOW, they are actually in good agreement with the original data (Barkan and Luz, 2005) and support Kaiser’s “base case”g values. The statement that Kaiser’s gvalues are “30 % too high” can therefore not be accepted, pending future work to reconcile different 17δVSMOW mea-surements.
1 Introduction
Kaiser (2011a) introduced an improved method to calculate aquatic gross production from oxygen triple isotope mea-surements, dubbed the “dual-delta method”. This method uses17δ and18δ measurements of dissolved O2 relative to Air-O2directly, rather than the17O excess (17∆)and using an approximation (Luz and Barkan, 2000). The calculation uses the following equation:
g=(
1+17εE) 17δ−17δ
sat
1+17δ −γR(1+ 18ε
E) 18δ−18δ
sat 1+18δ +s(
17ε
E−γR18εE) 17δ−17δ
1+17δ −γR 18δP−18δ
1+18δ
(1) Equation (1) is based on Eq. (48) in Kaiser (2011a), but takes into account that previous measurements of the kinetic isotope fractionation during O2gas exchange refer to evasion from solution to gas phase (Kaiser, 2011b; Knox et al., 1992). The symbols have the following meaning:
g=P / (kcsat): ratio of gross oxygen production to gross Air-O2invasion.
17δ,18δ: relative17O/16O and18O/16O differences be-tween dissolved O2and Air-O2.
17δ
sat,18δsat: relative17O/16O and18O/16O differences between dissolved O2at air saturation and Air-O2.
17δ
P,18δP: relative17O/16O and18O/16O differences be-tween photosynthetic O2and Air-O2.
17ε
E,18εE: kinetic17O/16O and18O/16O fractionations during O2evasion from sea to air.
γR=17εR/18εR: ratio of respiratory17O/16O fractiona-tion and18O/16O fractionation.
s=c/csat– 1: relative supersaturation of dissolved O2. Prokopenko et al. (2011) developed virtually the same method, but did not include kinetic isotope fractionation dur-ing O2gas transfer. This resulted in the simplified solution
g=
17δ−17δ
sat
1+17δ −γR
18δ−18δ
sat
1+18δ
17δ
P−17δ
1+17δ −γR
18δ
P−18δ
1+18δ
(2)
The comment by Nicholson (2011a) does not question the validity of the dual-delta method. Unlike the approximated calculation of Luz and Barkan (2000), it does not assume steady state for O2concentrations and can, therefore, be ex-pected to be more universally applicable. Only the assump-tion of isotopic steady state is needed. In contrast to the claim that the dual-delta method requires17εRand18εR (Nichol-son, 2011b), the above equations clearly show that onlyγRis required, which is better constrained than17εRand18εR(Luz and Barkan, 2005).
The comment paper and the reviews it has received (Luz, 2011; Prokopenko, 2011) demonstrate that the definition and use of triple isotope excess values can be very confusing, even for experts in the field. The use of different17∆ defi-nitions with different coefficients causes delays and misun-derstandings during scientific communication, which can be
avoided with the dual-delta method. In this paper,17∆values are reported in conjunction with the underlying17δ and18δ values and the definition of17∆is indicated by the indices introduced in Kaiser (2011a), to avoid any further confusion. In Sect. 2, we discuss the merits of Nicholson’s comment in view of different reconstructions of the isotopic compo-sition of photosynthetic O2. In Sect. 3, we evaluate his sug-gested approximated solution to the calculation of g from oxygen triple isotope measurements.
2 Isotopic composition of photosynthetic O2(δP)
In his comment, Nicholson (2011a) questions the “consis-tency” of the “definition” of the isotopic composition of the “biological end-member” (i.e., photosynthetic O2) in Kaiser 2011a). Specifically, he remarks that the triple iso-tope excess (17∆) adopted for the base case is “too low” and, therefore, also17δP. He does not question the value of −22.835 ‰ assumed for18δP.
The “definition” of the base case 17δP or 18δP values in Sect. 5 of Kaiser (2011a) followed the approach of previ-ous studies that used the measured17O excess of O2evolved in flask studies of17∆†(0.521)=(249±15) ppm (Luz and Barkan, 2000) and combined its numerical value with the in-ferred18δP value and an entirely different17O excess def-inition, in this case 17∆#(γR), where γR=0.5179. Even though the reconstructed17δP value of−11.646 ‰ must be considered hypothetical, it is consistent with 17δP values derived from actual literature data following two different approaches: one based on the measured isotopic composi-tion of VSMOW and oceanic waters with respect to Air-O2 (Barkan and Luz, 2005; Luz and Barkan, 2010), combined with the measured photosynthetic isotope fractionation by the cyanobacterium strain Synechocystis sp. PCC 6803 (Hel-man et al., 2005); the other based on dark-light incubations of the coral Acropora (with its symbiotic algae) in airtight flasks (Luz and Barkan, 2000). The first approach was also used to derive18δP= −22.835 ‰ .
Nicholson suggests that17∆#(θR)should be used to recon-struct17δP, whereθR=ln(1+17εR)/ln(1+18εR)=0.5154 for18εR= −20 ‰. This assumes concentration steady state in Luz and Barkan’s flask experiments and near-zero steady-state18δ values (18δS0). The resulting 17δP value of −11.588 ‰ (for18δP= −22.835 ‰ ) gives gross production rates that are about 30 % higher than for Kaiser’s “base case”. To dispel any confusion about how the isotopic compo-sition of photosynthetic O2(including the triple isotope ex-cess) was calculated, we show the corresponding equations and results in the following subsections and include data that were previously omitted or not yet published. The resulting
17δ
with more decimals than previously; however, this does not significantly change any results or conclusions.
2.1 Calculation ofδPbased on the isotopic composition
of source water (δW)and the photosynthetic isotope
fractionation (εP)
The relative isotope ratio difference of photosynthetic O2to Air-O2(δP)can be calculated via
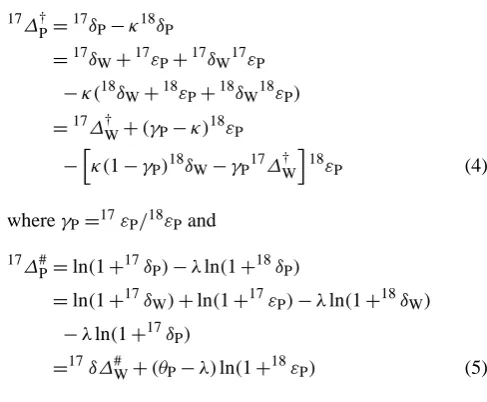
δP=(1+δW)(1+εP)−1 (3)
whereδW is the relative isotope ratio difference of source water to Air-O2 andεP is the photosynthetic isotope frac-tionation. The corresponding triple isotope excess is
17Ơ
P=
17δ
P−κ18δP
=17δW+17εP+17δW17εP
−κ(18δW+18εP+18δW18εP)
=17∆†W+(γP−κ)18εP
−hκ(1−γP)18δW−γP17∆†W
i
18ε
P (4)
whereγP=17εP/18εPand
17∆#
P=ln(1+17δP)−λln(1+18δP)
=ln(1+17δW)+ln(1+17εP)−λln(1+18δW) −λln(1+17δP)
=17δ∆#W+(θP−λ)ln(1+18εP) (5) whereθP=ln(1+17εP)/ln(1+18εP).
Note that the respiratory isotope fractionationεRdoes not enter into these equations.εRis only needed if the isotopic composition of O2 in steady state between photosynthesis and respiration (δS)was required.δScan be calculated using Eq. (31) in Kaiser (2011a). For comparison with Sect. 2.2, the corresponding δS0 values for a net to gross production ratio off =0 are also shown in Table 3; see also Eq. (6) below.
Kaiser (2011a) chose δW to correspond to the iso-topic composition of seawater. 18δW was set equal to
18δ
VSMOW=(−23.323±0.02)‰ (Barkan and Luz, 2005).
17δ
W was calculated as 17δW=(1+17δVSMOW)e−5 ppm– 1=(1−11.936 ‰)e−5 ppm– 1=(−11.941±0.01) ‰ (Luz and Barkan, 2010). Barkan and Luz (2011) reported more decimals and these values need to be corrected to
18δ
[image:3.595.43.287.241.442.2]W= −23.320 ‰ and17δW= −11.936 ‰ (Table 1, row 3; Table 3, row 5). Other measurements of17δVSMOWwere dis-regarded because they were less precise (Table 1, rows 1 and 2) or did not differ in terms of the17O excess (Table 1, row 4), which is critical for the magnitude ofg; see Sect. 2.4 below for the impact of new17δVSMOWmeasurements listed in Ta-ble 1, rows 5 and 6.
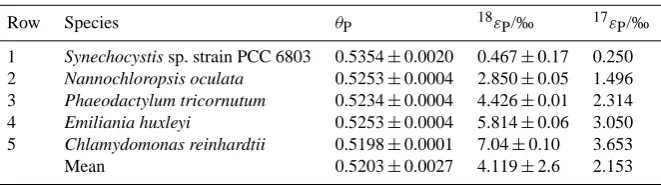
ForεP, a cyanobacterium strain that lacked the gene for photorespiration (Synechocystis sp. PCC 6803) was consid-ered with 18εP=(0.5±0.5) ‰ and θP=0.5354±0.0020 (Helman et al., 2005; Kaiser, 2011a). The uncertainty of18εP was chosen to reflect the range of photosynthetic isotope fractionation in other systems (Guy et al., 1993). This gave
18δ
P=(−22.835±0.5)‰, 17δP=(−11.676±0.26)‰,
17Ơ
P(0.5179)=(150±13) ppm; with the δW up-date referred to above, 18δ
P=(−22.832±0.5) ‰,
17δ
P=(−11.671±0.26) ‰,17∆†P(0.5179)=(153±6) ppm; with the actual 18εP=(0.467±0.17) ‰ (Table 2),
18δ
P=(−22.864±0.17) ‰, 17δP=(−11.689±0.09) ‰,
17Ơ
P(0.5179)=(152±6)ppm (Table 3, row 5a). The propagated error in 17∆ is smaller than for 17δP because the uncertainties in 17δP and 18δP are correlated in a mass-dependent way.
Eisenstadt et al. (2010) reported on 18εP and θP values for four additional phytoplankton species: Nannochlorop-sis oculata (a eustigmatophyte), Phaeodactylum tricornu-tum (a diatom), Emiliania huxleyi (a coccolithophore) and Chlamydomonas reinhardtii (a green alga). The 18εP val-ues are significantly higher than for Synechocystis sp. PCC 6803 and range from (2.850±0.05) ‰ for N. oculata to (7.04±0.10) ‰ for C. reinhardtii (Table 2). The θP values are lower than for Synechocystis sp. PCC 6803 and range from 0.5198±0.0001 for C. reinhardtii to 0.5253±0.0004 for N. oculata and E. huxleyi. The resulting
17Ơ
Table 1. Historic and new measurements of the relative oxygen isotope ratio differences between Vienna Standard Mean Ocean Water
(VS-MOW) and Air-O2(17δVSMOW,18δVSMOW,17∆VSMOW). For clarity, all values are shown with the same number of decimals, irrespective
of their uncertainty.
Row Reference 18δVSMOW/‰ 17δVSMOW/‰ 17∆†VSMOW(0.5179)/ppm 17∆#VSMOW(0.5179)/ppm
1 Thiemens et al. (1995) −22.873±0.04 −11.744±0.08 102±80a 170±80a
2 Luz et al. (1999); based on Thiemens et al. (1995) −22.960b −11.778b 113b 182b
3 Barkan and Luz (2005) −23.320±0.02 −11.931±0.01 146±4 218±4
4 Kaiser (2008); based on Barkan and Luz (2005) −23.771±0.06 −12.167±0.04 144±4 218±4
5 Barkan and Luz (2011) −23.324±0.02 −11.883±0.01 196±4 268±4
6 This paper −23.647±0.04 −12.102±0.03 145±6 218±6
aMinimum error based on the uncertainty of the corresponding17δvalue. bNo error estimate was given.
Table 2. Photosynthetic oxygen isotope fractionation for different marine (rows 2 to 4) and freshwater (rows 1 and 5) species (Eisenstadt et
al., 2010; Helman et al., 2005). The third decimal of18εPin rows 2 to 4 has been reconstructed from Luz and Barkan (2011b). The mean
θPvalue has been calculated from a linear regression of the five species-dependent ln(1+17εP)and ln(1+18εP)values. It is useful for error
propagation purposes. The resultant y-axis intercept of (0.012±0.013) ‰ is statistically indistinguishable from zero. For clarity,θPand17εP
values are shown with the same number of decimals, irrespective of their uncertainty.
Row Species θP 18εP/‰ 17εP/‰
1 Synechocystis sp. strain PCC 6803 0.5354±0.0020 0.467±0.17 0.250
2 Nannochloropsis oculata 0.5253±0.0004 2.850±0.05 1.496
3 Phaeodactylum tricornutum 0.5234±0.0004 4.426±0.01 2.314
4 Emiliania huxleyi 0.5253±0.0004 5.814±0.06 3.050
5 Chlamydomonas reinhardtii 0.5198±0.0001 7.04±0.10 3.653
Mean 0.5203±0.0027 4.119±2.6 2.153
2.2 Calculation of δP based on flask cultures in steady
state between photosynthesis and respiration
Following Sect. 3.4 in Kaiser (2011a), the isotopic compo-sition of oxygen in concentration steady state (net to gross production ratiof =0) is given by
δS0= 1+δP 1+εR
−1=δP−εR 1+εR
(6) To deriveδP, Eq. (6) is rearranged to
δP=(1+δS0)(1+εR)−1 (7) In addition toδS0, this calculation also requiresεR. Luz and Barkan (2000) performed incubations of a Nan-nochloropsis species and the hermatypic coral Acropora in airtight flasks. These incubations are supposed to cor-respond to steady state. No values were reported for δS0, only 17∆†S0(0.521)=(244±20) ppm for Nannochloropsis and (252±5) ppm for Acropora; anecdotal evidence sug-gests thatδS0was close to 0 (Barkan and Luz, 2011).
For Acropora, Luz and Barkan (2005) reported
18ε
R=(−13.8±0.5) ‰ andγR=0.519±0.001. Assuming
18ε
P=(0.5±0.5) ‰ and 18δW= −23.320 ‰, this gives
18δ
P=(−22.832±0.5) ‰ and 18δS0=(−9.16±0.71) ‰ (Kaiser, 2011a, b). With
17δ
S0=17ƠS0(0.521)+0.521
18δ
S0 (8)
this gives 17δS0=(−4.52±0.37) ‰ and, using Eq. (7),
17δ
P=(−11.649±0.26) ‰ and 17∆†P(0.5179)= (175±15) ppm (Table 3, row 3a). The photosynthetic isotope fractionation for Acropora is not known; if we assume the highest value reported for a marine species (E. huxleyi), the resulting17∆†P(0.5179)value is (210±15) ppm (Table 3, row 3b).
Kaiser (2011a) mentioned that no corresponding calcu-lation could be performed for Nannochloropsis because
18ε
R and γR values have not been reported for this species. In Sect. 4 of Nicholson (2011a), this calculation is performed nonetheless, assuming 18εR= −20 ‰ and γR=0.5179 (without uncertainties). Here, we repeat this calculation, assuming more realistic uncertainty es-timates of 4 ‰ for 18εR and 0.0006 for γR. This gives
18δ
P=(−22.832±0.5) ‰,17δP=(−11.606±0.26) ‰ and
17Ơ
[image:4.595.133.464.283.376.2]T able 3. Isotopic composition of photosynthetic O2 ( 17 δP , 18 δP , 17 ∆P ) and O2 at steady state between pho tosynthesis and respiration with a net to gross pro duction ratio of f = 0 ( 17 δS0 , 18 δS0 , 17 ∆S0 ) , calculated as per Sect. 2. F or clarity , all v alues are sho wn with the same number of decimals, irrespecti v e of their uncertainty . Directly measured v alues are in bold. Assumed v alues are in bold italics, i. e., for “Kaiser (2011a)” (ro w 1), 17 ∆
# P(
0 . 5179 ) = (249 ± 15) ppm; for “Nicholson (2011a)” (ro w 2), 17 ∆ # S0 ( 0 . 5154 ) = (249 ± 15) ppm. Other v alues were calculated using γR = 0.5179 ± 0.0006, 18 εR = ( − 20 ± 4) ‰, θR = 0.5154, except for “Acr opor a (flask)” where γR = 0.519 ± 0.001, 18 εR = ( − 13.8 ± 0.5) ‰, θR = 0.5173. F or “Acr opor a (flask)” and “Nannoc hlor opsis (flask)”, 17 ∆ † S0 ( 0 . 521 ) = (252 ± 5) ppm and (244 ± 20) ppm, respecti v ely , were used (Luz and Bark an, 2000). δP v alues in ro ws 1 to 5m are based on the δVSMO W v alues in T able 1, ro w 3 (Barkan and Luz, 2005); ro ws 6 to 6m are based on T able 1, ro w 5 (Barkan and Luz, 2011); ro ws 7 to 7m are based on T ab le 1, ro w 6 (this paper); all account for the 5 ppm lo wer 17 O / 16 O ratio of ocean w ater compared to VSMO W (Luz and Barkan, 2010) and the photosynthetic isotope fractionations in T able 2. Description 18 δP 17 δP 17 ∆
† (P
0 . 5179 ) 17 ∆
# P(
0 . 5179 ) 18 δS0 17 δS0 17 ∆ † S0 ( 0 . 5179 ) 17 ∆ # S0 ( 0 . 5179 ) 17 ∆ † S0 ( 0 . 5154 ) Ro w Unit ‰ ‰ ppm ppm ‰ ‰ ppm ppm ppm 1 Kaiser (2 011a), 18 εP = (0.50 ± 0.50) ‰ − 22.832 − 11.644 180 ± 15 249 ± 15 − 2.889 − 1.300 197 198 191 2 Nichols on (2011a), 18 εP = (0.50 ± 0.50) ‰ − 22.832 − 11.587 238 ± 35 307 ± 35 − 2.889 − 1.242 255 256 249 ± 15 3a Acr opor a (flask), 18 εP = (0.50 ± 0.50) ‰ − 22.832 − 11.649 175 ± 15 a 244 ± 15 a − 9.158 − 4.519 224 a 235 a − a 3b Acr opor a (flask), 18 εP = (5.814 ± 0.06) ‰ − 22.832 − 8.927 210 ± 15 b 251 ± 15 b − 3.895 − 1.777 240 b 242 b − b 4a Nannoc hlor opsis (flask), 18 εP = (0.50 ± 0.50) ‰ − 22.832 − 11.606 218 ± 38 287 ± 38 − 2.889 − 1.261 235 236 229 4b Nannoc hlor opsis (flask), 18 εP = (2.85 ± 0.05) ‰ − 20.536 − 10.399 237 ± 39 293 ± 40 − 0.547 − 0.041 24 2 242 241 5 δW based on Barkan and Luz (2005), εP = 0 − 23.320 − 11.936 141 ± 4 213 ± 4 − 3.388 − 1.594 160 162 153 5a εP (Synec hocystis , sp. strain PCC 6803) − 22.864 − 11.689 152 ± 6 221 ± 5 − 2.923 − 1.345 169 170 163 5b εP (Nannoc hlor opsis oculata ) − 20.536 − 10.458 178 ± 4 234 ± 4 − 0.547 − 0.101 183 183 181 5c εP (Phaeodactylum tricornutum ) − 18.997 − 9.649 189 ± 4 237 ± 4 1.023 0.716 186 186 189 5d εP (Emiliania huxle yi ) − 17.642 − 8.922 214 ± 5 256 ± 5 2.407 1.451 204 205 211 5e εP (Chlamydomonas reinhar dtii ) − 16.444 − 8.326 190 ± 4 226 ± 4 3.628 2.053 174 175 184 5m mean of ro ws 5a to 5e − 19.297 − 9.809 185 ± 22 234 ± 13 0.718 0.555 183 ± 14 183 ± 14 185 ± 18 6 δW based on Barkan and Luz (2011), εP = 0 − 23.324 − 11.888 192 ± 4 263 ± 4 − 3.392 − 1.546 211 212 204 6a εP (Synec hocystis , sp. strain PCC 6803) − 22.868 − 11.641 202 ± 6 272 ± 5 − 2.927 − 1.297 219 221 213 6b εP (Nannoc hlor opsis oculata ) − 20.540 − 10.410 228 ± 4 284 ± 4 − 0.552 − 0.052 233 234 232 6c εP (Phaeodactylum tricornutum ) − 19.001 − 9.601 239 ± 4 288 ± 4 1.019 0.765 237 237 239 6d εP (Emiliania huxle yi ) − 17.646 − 8.874 264 ± 5 306 ± 5 2.402 1.499 255 255 261 6e εP (Chlamydomonas reinhar dtii ) − 16.448 − 8.278 240 ± 4 277 ± 4 3.624 2.102 225 226 235 6m mean of ro ws 6a to 6e − 19.301 − 9.761 235 ± 22 285 ± 13 0.714 0.603 234 ± 14 234 ± 14 236 ± 18 7 δW based on this paper , εP = 0 − 23.647 − 12.107 140 ± 6 213 ± 6 − 3.722 − 1.767 160 163 153 7a εP (Synec hocystis , sp. strain PCC 6803) − 23.192 − 11.860 151 ± 7 222 ± 7 − 3.257 − 1.518 169 171 162 7b εP (Nannoc hlor opsis oculata ) − 20.865 − 10.629 177 ± 6 235 ± 6 − 0.882 − 0.274 183 184 181 7c εP (Phaeodactylum tricornutum ) − 19.326 − 9.821 188 ± 6 238 ± 6 0.688 0.543 187 187 189 7d εP (Emiliania huxle yi ) − 17.971 − 9.094 213 ± 6 256 ± 7 2.071 1.278 205 205 211 7e εP (Chlamydomonas reinhar dtii ) − 16.774 − 8.498 189 ± 6 227 ± 6 3.292 1.880 175 176 184 7m mean of ro ws 7a to 7e − 19.625 − 9.980 184 ± 23 235 ± 14 0.382 0.382 184 ± 15 184 ± 15 185 ± 18 aThe corresponding v alues for λ = κ = 0.519 are 17 ∆
† (P
0 . 5179 ) = (200 ± 15) ppm, 17 ∆
# P(
0 . 5179 ) = (269 ± 15) ppm, 17 ∆ † S0 ( 0 . 5179 ) = 234 ppm, 17 ∆ # S0 ( 0 . 5179 ) = 245 ppm and 17 ∆ # S0 ( 0 . 5173 ) = 229 ppm. bThe corresponding v alues for λ = κ = 0.519 are 17 ∆
†(P
0 . 5179 ) = (229 ± 15) ppm, 17 ∆
# P(
2.3 Hypothetical “base case” values for the isotopic composition of photosynthetic O2
Based on the discrepancy between the17O excess for pho-tosynthetic O2 produced by Synechocystis and Acropora, Kaiser (2011a) found it impossible to assign a best value for
17δ
P. The inclusion of Nannochloropsis with Nicholson’s as-sumptions does not help to resolve this.
Instead, Kaiser (2011a) constructed a hypothetical base case in a way that was mathematically consistent with previous studies (Hendricks et al., 2004; Juranek and Quay, 2010; Reuer et al., 2007). The base case adopted a triple isotope excess of 17∆#P(0.5179)=(249±15) ppm (Table 3, row 1). This is the same numerical value for the triple isotope excess used in previous studies, although λ values of 0.516 (Hendricks et al., 2004; Reuer et al., 2007) and 0.518 were used elsewhere (Juranek and Quay, 2010). 17∆#P(0.5179)=(249±15) ppm results in 17δP= −11.646 ‰ (−11.644 ‰ with the δW update referred to in Sect. 2.1; Table 3, row 1), which is slightly higher than the corresponding values of −11.671 ‰ for Syne-chocystis and−11.649 ‰ for Acropora. The resulting value of 17∆†P(0.5179)=(180±15) ppm is compatible with the
17Ơ
P(0.5179)values for other species based on the18εP mea-surements of Eisenstadt et al. (2010) (Table 3, rows 5b, 5c, 5e) except for E. huxleyi (Table 3, row 5d).
Nicholson (2011a) questions the validity of this base case and suggests that λ should be chosen such that
17∆#
S0(λBSS)=
17∆#
P(λBSS) and that these values should equal (249±15) ppm. This “tuned”λ value, denotedλBSS (for biological steady state) by Nicholson (2011a), is actu-ally identical to the triple isotope fractionation coefficient for respiration (θR)and calculated as
λBSS=θR
=ln(1+
17ε
R)
ln(1+18ε
R)
=ln(1+γR
18ε
R)
ln(1+18ε
R)
(9) This leads to a set of calculation parameters with 18δP= −22.832 ‰, 17δP= −11.587 ‰ and
17Ơ
P(0.5179)=(238±35) ppm (Table 3, row 2). Within error, this agrees with the Nannochloropsis flask exper-iments if the assumptions of γR=0.5179±0.0006 and
18ε
R=(−20±4) ‰ for these experiments are correct. It differs substantially from the corresponding values for the Acropora flask experiments assuming 18εP=0.5 ‰ (Table 3, row 3a) and the results for all species based on the isotopic composition of seawater and the photosynthetic isotope fractionation (Table 3, rows 5a–c, 5e) except for E. huxleyi (Table 3, row 5d). It may be reconciled with the Acropora flask experiments if 18εP=5.814 ‰ is assumed (Table 3, row 3b).
In Sect. 4, Nicholson (2011a) comments that17∆#P(θR)= 231 ppm for the Nannochloropsis flask experiments is very close to 17∆#P(θR)=234 ppm for the Acropora flask
experiments. Notwithstanding that our own calculations give identical results of17∆#P(θR)=229 ppm for both cases (Ta-ble 3, row 4a and footnote to row 3a), this is not a fair com-parison becauseθR=0.5173 for Acropora andθR=0.5154 for Nannochloropsis. Clearly, the17δP values differ in both cases (for the same18δPvalue) and calculations of gross pro-duction using the accurate dual-delta method would lead to different results. This illustrates the perils associated with us-ing17∆values in isolation.
2.4 New measurements of18δVSMOWand17δVSMOW
Four days after publication of Kaiser (2011a) and three days before publication of Nicholson (2011a), new mea-surements of 18δVSMOW and 17δVSMOW were published (Barkan and Luz, 2011). The authors of this paper found that they could not reproduce their earlier results for
17δ
VSMOW (Barkan and Luz, 2005). Their new results gave
17δ
VSMOW=(−11.883±0.012) ‰ (Table 1, row 5), which
is 0.048 ‰ or five standard deviations higher than the original value of (−11.931±0.01) ‰ (Barkan and Luz, 2005). The new 18δVSMOW value of (−23.324±0.017) ‰ was virtually unchanged compared to the original value of (−23.320±0.02) ‰. In terms of 17∆†VSMOW(0.5179), this amounts to a change from (146±4) ppm to (196±4) ppm. The authors do not give an explanation for this change, other than that “experimental system and measurement procedures were somewhat improved” (Barkan and Luz, 2011).
The revised measurements allow recalculating δP based onδWandεP (Sect. 2.1).18δPremains virtually unchanged, but the corresponding 17δP and 17∆†P(0.5179) values in-crease by about 50 ppm (Table 3). Within error, the re-vised 17∆†P(0.5179) values agree with those estimated for Nannochloropsis (flask), Acropora (flask; assuming18εP= 5.814 ‰) and Nicholson (2011a). They disagree with the Acropora (flask; assuming18εP=0.5 ‰) and Kaiser (2011a) values.
Our own measurements of VSMOW relative to
Air-O2give18δVSMOW=(−23.647±0.04) ‰ and17δVSMOW=
(−12.102±0.03) ‰ (Table 1, row 6). Taking into ac-count the 17O/16O depletion of ocean water with respect to VSMOW, this gives 17δW=(−12.107±0.03) ‰ and
17Ơ
W(0.5179)=(140±6) ppm (Table 3, row 7). The uncer-tainty of17∆†Wis lower than for17δWbecause the errors in 18δand17δare correlated in a mass-dependent way.
affected17∆†W(0.5179) by a 2 ppm increase only. It actually brings18δVSMOWinto closer agreement with independent es-timates of (−23.771±0.06) ‰ (Table 1, row 4), based on isotope measurements in CO2(Kaiser and R¨ockmann, 2008). Barkan and Luz (2005, 2011) did not perform a scale correc-tion, even though their measured SLAP-VSMOW difference of (−55.11±0.05) ‰ (Barkan and Luz, 2005) differs from the internationally accepted value of−55.5 ‰ (Gonfiantini, 1977, 1978). If the value of−55.5 ‰ were accurate, the cor-responding scale contraction would amount to 0.7 %. A scale contraction of 0.7 to 0.8 % may be typical for this particular type of mass spectrometer.
The varying results for the relative isotope ratio differ-ences between VSMOW and Air-O2within a single labora-tory and between laboratories warrant further measurements of this important parameter and perhaps inter-laboratory comparisons.
For comparison purposes, we construct mean parameter sets from the species-dependent δP values (Table 3, rows 5m, 6m and 7m). For the photosynthetic isotope fraction-ation, we adopt the arithmetic average of the correspond-ing values based on Eisenstadt et al. (2010), i.e., 18εP= (4.119±2.6) ‰ and17εP=(2.153±1.3) ‰ (Table 2). This
18ε
Pvalue is in good agreement with the global average18εP of 4 ‰ derived by Luz and Barkan (2011a). A similar ap-proach was taken by Luz and Barkan (2011b), but they ex-cluded C. reinhardtii from their meanδPvalues. It would not be appropriate to take the arithmetic average ofθPreported for various organisms to derive17εP because17εP is essen-tially linearly related to17δPwhereasθPis not.
The good agreement between our own measurements of the isotopic composition of VSMOW relative to Air-O2 and those of Barkan and Luz (2005) is also reflected by the closely matching species-dependent17∆P(0.5179) values (Table 3, rows 5a–5e and 7a–7e). In the next section, we will illustrate the systematic impact of differentδPvalues ong.
3 Dependence ofgon the isotopic composition of photosynthetic O2
3.1 Accurate calculation ofgusing the dual-delta method
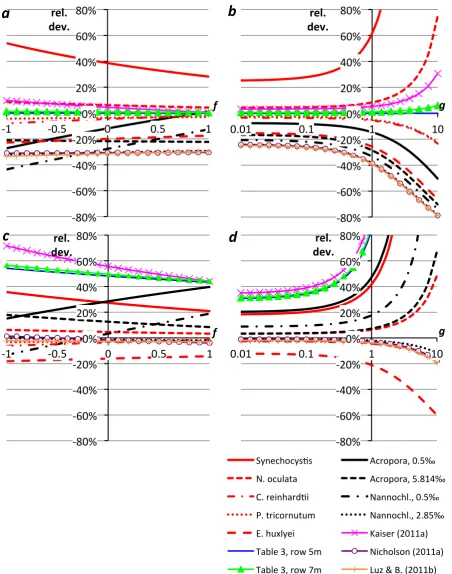
Since the interaction between the parameters 17δP, 18δP andγR is not straightforward to predict based on Eq. (1), their impact on g is best illustrated through example cal-culations (Kaiser, 2011a). Results forg based on 17δP and
18δ
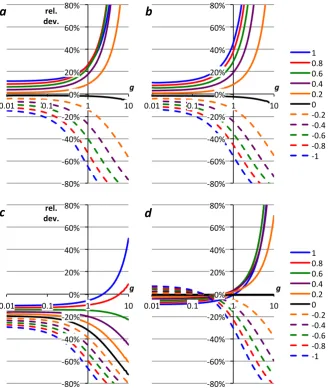
P derived in Sects. 2.1–2.3, including the parameters suggested by Nicholson (2011a) and Kaiser (2011a) are compared with those using the mean δP values based on Barkan and Luz (2005; Table 3, row 5m; Fig. 1a and b) and based on Barkan and Luz (2011; Table 3, row 6m; Fig. 1c and d). The same scenarios as in Kaiser (2011a) were used, i.e., g=0.4 with −1.0≤f ≤ +1.0 (Fig. 1a
and c) and f =0.1 with 0.01≤g≤10 (Fig. 1b and d). Parameters related to gas exchange were left unchanged at 17δsat=0.382 ‰, 18δsat=0.707 ‰, 17εE= −1.463 ‰,
18ε
E= −2.800 ‰ (Kaiser, 2011a, b).
As may be expected from the corresponding17∆Pvalues, there is relative good agreement between g based on “Ta-ble 3, row 5m” (using VSMOW measurements reported by Barkan and Luz, 2005), “Table 3, row 7m” (using VSMOW measurements reported here), “Kaiser (2011a)”, “Acropora (flask, 18εP=0.5 ‰)” and the species-specific parameters for N. oculata, C. reinhardtii and P. tricornutum (Fig. 1a and b). However,gbased on Synechocystis parameters is≥24 % higher; gbased on “Nicholson (2011a)”, “Nannochloropo-sis (flask, 2.85 ‰)” and “Luz and Barkan, 2011b” is≥27 % lower than “Table 3, row 5m”.gvalues based on “E. hux-leyi” and “Acropora (flask, 5.814 ‰)” and “Nannochloropo-sis (flask, 0.5 ‰)” are in between. For f <0.1 or g >0.1, these relative deviations are higher (Fig. 1a and b) The rela-tive deviations ofgfor the E. huxleyi parameters are≤–16 % from the base case forf =0.1, which means theg values deviate≤–32 % from theg values based on Synechocystis parameters, a significant species-related uncertainty.
Forgbased on “Table 3, row 6m” (using VSMOW mea-surements reported by Barkan and Luz, 2011), the species-specific parameters for N. oculata, C. reinhardtii and P. tri-cornutum again agree well with the mean δP set (Fig. 1c and d). There is also relative good agreement with “Nichol-son (2011a)”, “Luz and Barkan (2011b)”, “Acropora (flask, 5.814 ‰)” and “Nannochloroposis (flask, 2.85 ‰)”. How-ever, the relative deviations are≥35 % for “Kaiser (2011a)”, “Table 3, row 5m” and “Table 3, row 7m” and≤–12 % for “E. huxleyi”. Again, forf <0.1 org >0.1, these deviations tend to be even higher (Fig. 1c and d). The relative deviations ofgfor the Synechocystis parameters are≥ +18 % from the base case, which means thegvalues based on E. huxleyi pa-rameters deviate≤–26 % from thegvalues based on Syne-chocystis parameters. The span between these two species is slightly smaller than for “Table 3, row 5m” because the dif-ferent base case parameters lead to difdif-ferent17δand18δ sce-narios for the same two cohorts. Nevertheless, there is still a significant uncertainty ingrelated to which species is as-sumed to have produced the O2and, therefore, which set of parameters17δP,18δPandγRis adopted for the calculation.
-‐80%
-‐60%
-‐40%
-‐20%
0%
20%
40%
60%
80%
-‐1
-‐0.5
0
0.5
1
rel.
dev.
f
-‐80%
-‐60%
-‐40%
-‐20%
0%
20%
40%
60%
80%
0.01
0.1
1
10
rel.
dev.
g
Synechocys4s Acropora, 0.5‰
N. oculata Acropora, 5.814‰
C. reinhard4i Nannochl., 0.5‰
P. tricornutum Nannochl., 2.85‰
E. huxlyei Kaiser (2011a)
Table 3, row 5m Nicholson (2011a)
Table 3, row 7m Luz & B. (2011b)
c
d
-‐80%
-‐60%
-‐40%
-‐20%
0%
20%
40%
60%
80%
0.01
0.1
1
10
rel.
dev.
g
-‐80%
-‐60%
-‐40%
-‐20%
0%
20%
40%
60%
80%
-‐1
-‐0.5
0
0.5
1
rel.
dev.
f
a
b
Fig. 1. Relative difference ofgfor different sets of17δP,18δPandγR(Table 3) togbased on row 5m (a, b; Barkan and Luz, 2005) and row
6m (c, d; Barkan and Luz, 2011). (a, c) correspond tog=0.4 and−1.0≤f≤1.0; (b, d) tof=0.1 and 0.01≤g≤10 (logarithmic axis).
Red curves correspond to rows 5a–e (a, b) and 6a–e (c, d). “Kaiser (2011a)”, “Nicholson (2011a)”, “Acropora, 0.5 ‰”, “Acropora, 5.814 ‰”,
“Nannochl., 0.5‰” and “Nannochl., 2.85 ‰” correspond to rows 1, 2, 3a, 3b, 4a and 4b. “Luz & B. (2011b)” uses17δP= −10.126 ‰ and
18δ
[image:8.595.72.525.59.634.2]a claim and rather used the disagreement between differ-ent estimates of the isotopic composition of photosynthetic O2to highlight the need for additional measurements of the required parameters, especially17δP. The claim by Nichol-son (2011a) that thegvalues calculated using the base case of Kaiser (2011a) were 30 % too high is not justified.
Nicholson (2011a) also commented that Kaiser (2011a) overestimates the discrepancy of g based on different calculation methods/parameters, as seen in Fig. 3 of Kaiser (2011a) compared to Fig. 1 in Nicholson (2011a). However, this is largely due to how the results are presented (as relative deviations), and as we argue above, Kaiser’s “base case” just provides a reference for comparison, not a benchmark for other studies.
3.2 Approximate calculation ofg
Even though the development of the accurate dual-delta method makes use of approximations in the calculation of gunnecessary, we will revisit the different approximations used in the past to address Nicholson’s comment that17∆ should be defined as17∆#(θR)≡ln(1+17δ)−θRln(1+18δ). Luz and Barkan (2000) suggested the following approx-imate calculation of oxygen gross production from oxygen triple isotope measurements
g=
17∆−17∆
sat
17∆
P−17∆
(10)
with the triple isotope excess defined as17∆†(0.521)≡17δ− 0.52118δ, i.e., using a linear definition.
The same authors later revised this method and stated that the triple isotope excess should be defined using the natu-ral logarithm (ln) as17∆#(γR)≡ln(1+17δ)–γRln(1+18δ) withγR=0.5179 (Luz and Barkan, 2005), but that this def-inition shall not apply to17∆P. Instead, the photosynthetic end-member should be set equal to 17∆#
P(θR), with θR= 0.5154 forγR=0.5179 and 18εR= −20 ‰ (Sect. 2.3). As evidenced by its use in Luz and Barkan (2009), a coefficient ofγRis also meant to apply to17∆#sat.
The use of different coefficients for the triple isotope ex-cess is confusing, especially for the non-expert reader. More-over,θRcan only be computed if18εRis also known. Even though the influence of the uncertainty in18εRis not as se-vere as when18δwere used for the calculation directly (Quay et al., 1993), this goes against the rationale behind the triple oxygen isotope technique (i.e., the absence of the need to know18εR). Finally, the suggested approximations are math-ematically inconsistent with Eqs. (1) and (2).
Instead, Kaiser (2011a) suggested that Eq. (10) is used with the triple isotope excess defined as 17∆†(γR) ≡17 δ−γR18δ. This definition is consistent with the asymptotic behaviour of Eq. (2) for 17δ, 18δ→0. However, it was shown that this approximated calculation can lead to system-atic biases from the accurate solution calculated using the
dual-delta method and the use of this approximation was not recommended.
Nicholson (2011a) comments that the approximations of Kaiser (2011a) and, by implication, Luz and Barkan 2005) can be improved if a definition of the triple isotope excess as17∆#(θR)is adopted. The corresponding17∆#P(θR)value is named17∆BSS for “biological steady state” because it is identical to the17∆#S0(θR)value under concentration steady state (f =0). However, as shown in Sect. 3.4 and the un-corrected Fig. 1 of Kaiser (2011a), isotopic steady state can also be achieved for f6=0 and in this case, 17∆#S(θR)6=
17∆#
P(θR). It is, therefore, not clear a priori whether the ap-proximation suggested by Nicholson (2011a) performs bet-ter than the other approximations.
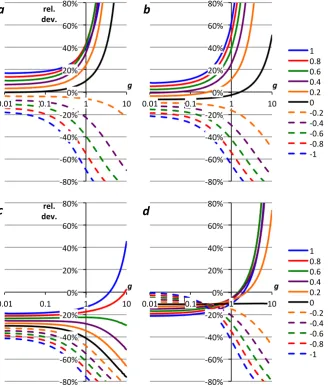
Just as in Sect. 3.1, we, therefore, compare the differ-ent approximations to the accurate solution using a range of scenarios. The scenarios correspond to 0.01≤g≤10 and −1≤f ≤1 (in steps of 0.2). The underlying parameters
17δ
P,18δPandγRcorrespond to “Kaiser (2011a)” (Table 3, row 1; Fig. 2); the meanδPbased on the VSMOW measure-ments of Barkan and Luz (2011) (Table 3, row 6m; Fig. 3), which is similar to “Nicholson (2011a)”; and the parameters derived from the Acropora flask experiments (18εP=0.5 ‰; Table 3, row 3a; Fig. 4).
The approximate solutions are calculated using Eq. (10) with the triple isotope excess defined as (a)17∆†(γR)(Kaiser, 2011a) (Figs. 2a, 3a, 4a); (b) 17∆#(γR) in general, but
17∆#
P(θR) for photosynthetic O2 (Luz and Barkan, 2005) (Figs. 2b, 3b, 4b); (c) 17∆#(γR) (shown for completeness) (Figs. 2c, 3c, 4c) and (d) 17∆#(θR) (Nicholson, 2011a) (Figs. 2d, 3d, 4d). In the following, we refer to these defi-nitions as methods (a) to (d).
None of the approximations deliver unbiased results for g >1. Of course, such conditions rarely occur in the environ-ment (except for intense blooms or very low wind speeds). However, even forg <1 significant biases can occur in all cases under certain conditions.
For all scenarios, method (c) performs worst. However,
17∆#(γ
R)on its own has actually never been used together with Eq. (10), as far as we know, so this has no consequence for already published data.
For the base case adopted by Kaiser (2011a) (Table 3, row 1; Fig. 2), method (a) returns nearly unbiased results for f =0 andg <0.1. Forg <1 and−0.4≤f ≤0.2, the rel-ative deviation from the accurate solution does not exceed ±22 % (Fig. 2a).gvalues based on Nicholson’s method (d) are biased 10 % low forf =0, but the relative deviation from the base case is at most −21 % forg≤0.4 (Fig. 2d). Luz and Barkan’s method (b) is biased only 7 % low forf =0 (Fig. 2b), but otherwise the derivedgvalues have larger de-viations from the accurate solution than those for method (d), more similar to method (a).
!80%% !60%% !40%% !20%% 0%% 20%% 40%% 60%% 80%%
0.01% 0.1% 1% 10%
rel.% dev.%
g"
!80%% !60%% !40%% !20%% 0%% 20%% 40%% 60%% 80%%
0.01% 0.1% 1% 10%
g"
1% 0.8% 0.6% 0.4% 0.2% 0% !0.2% !0.4% !0.6% !0.8% !1%
!80%% !60%% !40%% !20%% 0%% 20%% 40%% 60%% 80%%
0.01% 0.1% 1% 10%
rel.% dev.%
g"
!80%% !60%% !40%% !20%% 0%% 20%% 40%% 60%% 80%%
0.01% 0.1% 1% 10%
g"
1% 0.8% 0.6% 0.4% 0.2% 0% !0.2% !0.4% !0.6% !0.8% !1%
a"
b"
[image:10.595.136.465.66.454.2]c"
d"
Fig. 2. Relative deviation of the approximated solution forg(Eq. 10) from the accurate solution (Eq. 1) for the parameters in Table 3, row 1 (Kaiser, 2011a).
(a) linear definition of17∆withκ=γR(Kaiser, 2011a):17∆†P(0.5179)=180 ppm,17∆†sat(0.5179)=16 ppm.
(b) ln-definition of17∆withλ=γR except for17∆#P(Luz and Barkan, 2005):17∆#P(0.5154)=191 ppm,17∆#sat(0.5179)=16 ppm. (c) ln-definition of17∆withλ=γR:17∆#P(0.5179)=249 ppm,17∆#sat(0.5179)=16 ppm.
(d) ln-definition of17∆withλ=θR(Nicholson, 2011a):17∆#P(0.5154)=191 ppm,17∆#sat(0.5154)=18 ppm.
6m; Fig. 3), methods (a), (b) and (d) give nearly unbiased re-sults forf =0 and the entire range of g values explored. Method (d) has the least bias forg <1, whereas methods (a) and (b) perform similarly.
For the scenario based on the Acropora flask experiments (18εP=0.5 ‰; Table 3, row 3a; Fig. 4), method (a) gives the least bias forf =0. In this case, methods (b) and (d) are biased low by 19 % and 12 %, respectively. Interestingly, method (d) does not show any significant variation in this bias forg <0.1 and the entire range inf.
In summary, none of the calculation methods is free from bias under all conditions and scenarios. The value Nichol-son (2011a) attributed to method (d) may be due to the
particular hypothetical scenario he has chosen, which is very similar to that defined by “Table 3, row 6m” (Fig. 1c and d). However, if other17δ
Pand18δPparameters were adopted such as those of the Acropora flask experiments (assuming
18ε
P=0.5 ‰), then significant deviations from the accurate solution would occur.
4 Conclusions
!80%% !60%% !40%% !20%% 0%% 20%% 40%% 60%% 80%%
0.01% 0.1% 1% 10%
rel.% dev.%
g"
!80%% !60%% !40%% !20%% 0%% 20%% 40%% 60%% 80%%
0.01% 0.1% 1% 10%
g"
1% 0.8% 0.6% 0.4% 0.2% 0% !0.2% !0.4% !0.6% !0.8% !1%
!80%% !60%% !40%% !20%% 0%% 20%% 40%% 60%% 80%%
0.01% 0.1% 1% 10%
rel.% dev.%
g"
!80%% !60%% !40%% !20%% 0%% 20%% 40%% 60%% 80%%
0.01% 0.1% 1% 10%
g"
1% 0.8% 0.6% 0.4% 0.2% 0% !0.2% !0.4% !0.6% !0.8% !1%
a"
b"
[image:11.595.134.466.64.453.2]c"
d"
Fig. 3. Relative deviation of the approximated solution forg(Eq. 10) from the accurate solution (Eq. 1) for the parameters in Table 3, row
6m (δWbased on Barkan and Luz, 2011).
(a) linear definition of17∆withκ=γR(Kaiser, 2011a):17∆†P(0.5179)=235 ppm,17∆†sat(0.5179)=16 ppm.
(b) ln-definition of17∆withλ=γR except for17∆#P(Luz and Barkan, 2005):17∆#P(0.5154)=236 ppm,17∆#sat(0.5179)=16 ppm. (c) ln-definition of17∆withλ=γR:17∆#P(0.5179)=285 ppm,17∆#sat(0.5179)=16 ppm.
(d) ln-definition of17∆withλ=θR(Nicholson, 2011a):17∆#P(0.5154)=236 ppm,17∆#sat(0.5154)=18 ppm.
and 18δ pairs) and different calculation parameters. With the development of the dual-delta method (Kaiser, 2011a; Prokopenko et al., 2011), it is time to abandon approximated solutions based on the triple isotope excess (17∆). The end of the discussion about what the appropriate definition is for 17∆, which is the right coefficient and whether it should be
defined in terms ofδor ln(1+δ), will also help alleviate the confusion that newcomers and students feel when they first enter this field of research.
Even though the methodological bias due to the use of Eq. (10) may often be smaller than the uncertainty due to wind speed-gas exchange parameterisations, there is no
reason for such bias to exist at all if the dual-delta method is adopted.
!80%% !60%% !40%% !20%% 0%% 20%% 40%% 60%% 80%%
0.01% 0.1% 1% 10%
rel.% dev.%
g"
!80%% !60%% !40%% !20%% 0%% 20%% 40%% 60%% 80%%
0.01% 0.1% 1% 10%
g"
1% 0.8% 0.6% 0.4% 0.2% 0% !0.2% !0.4% !0.6% !0.8% !1%
!80%% !60%% !40%% !20%% 0%% 20%% 40%% 60%% 80%%
0.01% 0.1% 1% 10%
rel.% dev.%
g"
!80%% !60%% !40%% !20%% 0%% 20%% 40%% 60%% 80%%
0.01% 0.1% 1% 10%
g"
1% 0.8% 0.6% 0.4% 0.2% 0% !0.2% !0.4% !0.6% !0.8% !1%
a"
b"
[image:12.595.134.467.63.456.2]c"
d"
Fig. 4. Relative deviation of the approximated solution forg(Eq. 10) from the accurate solution (Eq. 1) for the parameters in Table 1, row
3a (Acropora (flask),18εP=0.5 ‰ ).
(a) linear definition of17∆withκ=γR(Kaiser, 2011a):17∆†P(0.519)=200 ppm,17∆†sat(0.519)=15 ppm.
(b) ln-definition of17∆withλ=γR except for17∆#P(Luz and Barkan, 2005):17∆#P(0.5173)=229 ppm,17∆#sat(0.519)=15 ppm. (c) ln-definition of17∆withλ=γR:17∆#P(0.519)=269 ppm,17∆#sat(0.5179)=15 ppm.
(d) ln-definition of17∆withλ=θR(Nicholson, 2011a):17∆#P(0.5173)=229 ppm,17∆#sat(0.5173)=17 ppm.
isotope fractionation and the inferred gross productiong, de-pending on what species is assumed to have produced the oxygen. Independent measurements and perhaps laboratory comparison exercises should be performed to establish the reproducibility of 17O/16O isotope ratio measurements in water. Further experiments with cultures under steady-state conditions would help to verify the calculations based on the isotopic composition of water and the photosynthetic isotope fractionation.
The comment by Nicholson (2011a) on “Consistent calcu-lation of aquatic gross production from oxygen triple isotope measurements” by Kaiser (2011a) centred on the appropriate choice of17δP and18δP. At the moment, however, it seems
to be more important to emphasise the differences that result from different parameters and calculation methods. The de-mand for the “correct” choice is premature and besides the main topic of Kaiser’s original paper.
Acknowledgements. Jan Kaiser would like to thank the Royal Society for support through Wolfson Research Merit Award WM052632. Osamu Abe was supported during a sabbatical year at UEA by the JSPS “Institutional Program for Young Researcher Overseas Visits”.
References
Barkan, E. and Luz, B.: High precision measurements of17O/16O
and18O/16O ratios in H2O, Rapid Commun. Mass Spectrom.,
19, 3737–3742, 2005.
Barkan, E. and Luz, B.: The relationships among the three sta-ble isotopes of oxygen in air, seawater and marine photo-synthesis, Rapid Commun. Mass Spectrom., 25, 2367–2369, doi10.1002/rcm.5125, 2011.
Coplen, T. B., Hopple, J. A., B¨ohlke, J. K., Peiser, H. S., Rieder, S. E., Krouse, H. R., Rosman, K. J. R., Ding, T., Vocke, J., R. D., R´ev´esz, K. M., Lamberty, A., Taylor, P., and De Bi`evre, P.: Com-pilation of minimum and maximum isotope ratios of selected el-ements in naturally occurring materials and reagents, US Geo-logical Survey Water-Resources Investigations Report 01-4222, Reston, Virginia, 98 pp., 2002.
Eisenstadt, D., Barkan, E., Luz, B., and Kaplan, A.: Enrichment of oxygen heavy isotopes during photosynthesis in phytoplankton, Photosynth. Res., 103, 97–103, doi:10.1007/s11120-009-9518-z, 2010.
Gonfiantini, R.: Consultants’ Group Meeting on stable isotope stan-dards and intercalibration in hydrology and in geochemistry, IAEA, Vienna, 10 pp., 1977.
Gonfiantini, R.: Standards for stable isotope measurements in natu-ral compounds, Nature, 271, 534–536, 1978.
Guy, R. D., Fogel, M. L., and Berry, J. A.: Photosynthetic fraction-ation of the stable isotopes of oxygen and carbon, Plant Physiol., 101, 37–47, 1993.
Helman, Y., Barkan, E., Eisenstadt, D., Luz, B., and Ka-plan, A.: Fractionation of the three stable oxygen iso-topes by oxygen-producing and oxygen-consuming reactions in photosynthetic organisms, Plant Physiol., 138, 2292–2298, doi:10.1104/pp.105.063768, 2005.
Hendricks, M. B., Bender, M. L., and Barnett, B. A.: Net and gross
O2production in the Southern Ocean from measurements of
bi-ological O2saturation and its triple isotope composition,
Deep-Sea Res. I, 51, 1541–1561, 2004.
Juranek, L. W. and Quay, P. D.: Basin-wide photosynthetic production rates in the subtropical and tropical Pacific
Ocean determined from dissolved oxygen isotope
ra-tio measurements, Global Biogeochem. Cy., 24, GB2006, doi:10.1029/2009gb003492, 2010.
Kaiser, J.: Reformulated 17O correction of mass
spectromet-ric stable isotope measurements in carbon dioxide and a critical appraisal of historic “absolute” carbon and oxygen isotope ratios, Geochim. Cosmochim. Acta, 72, 1312-1334, doi:10.1016/j.gca.2007.12.011, 2008.
Kaiser, J.: Technical note: Consistent calculation of aquatic gross production from oxygen triple isotope measurements, Biogeo-sciences, 8, 1793–1811, doi:10.5194/bg-8-1793-2011, 2011a. Kaiser, J.: Corrigendum to “Technical note: Consistent
calcula-tion of aquatic gross produccalcula-tion from oxygen triple isotope measurements” published in Biogeosciences, 8, 1793–1811, 2011, Biogeosciences, 8, 2561–2565, doi:10.5194/bg-8-2561-2011, 2011b.
Kaiser, J. and R¨ockmann, T.: Correction of mass-spectrometric
iso-tope ratio measurements for isobaric isotopologues of O2, CO,
CO2, N2O and SO2, Rapid Commun. Mass Spectrom., 22, 3997–
4008, 2008.
Knox, M., Quay, P. D., and Wilbur, D.: Kinetic isotopic
fraction-ation during air-water gas transfer of O2, N2, CH4, and H2, J.
Geophys. Res., 97, 20335–20343, 1992.
Kroopnick, P. and Craig, H.: Atmospheric oxygen: Isotopic compo-sition and solubility fractionation, Science, 175, 54–55, 1972. Luz, B.: Interactive comment on “Comment on “Consistent
calcu-lation of aquatic gross production from oxygen triple isotope measurements” by Kaiser (2011)” by D. P. Nicholson, Biogeo-sciences Discuss., 8, C2990–C2994, 2011.
Luz, B. and Barkan, E.: Assessment of oceanic productivity with the triple-isotope composition of dissolved oxygen, Science, 288, 2028–2031, 2000.
Luz, B. and Barkan, E.: The isotopic ratios17O/16O and18O/16O
in molecular oxygen and their significance in biogeochemistry, Geochim. Cosmochim. Acta, 69, 1099–1110, 2005.
Luz, B. and Barkan, E.: Net and gross oxygen production from
O2/Ar,17O/16O and18O/16O ratios, Aquat. Microb. Ecol., 56,
133–145, 2009.
Luz, B. and Barkan, E.: Variations of17O/16O and18O/16O in
meteoric waters, Geochim. Cosmochim. Acta, 74, 6276–6286, doi:10.1016/j.gca.2010.08.016, 2010.
Luz, B. and Barkan, E.: The isotopic composition of at-mospheric oxygen, Global Biogeochem. Cy., 25, GB3001, doi:10.1029/2010gb003883, 2011a.
Luz, B. and Barkan, E.: Proper estimation of marine gross O2
pro-duction with17O/16O and18O/16O ratios of dissolved O2,
Geophys. Res. Lett., 38, L19606, doi:10.1029/2011gl049138, 2011b.
Nicholson, D. P.: Comment on: “Technical note: Consistent calcula-tion of aquatic gross produccalcula-tion from oxygen triple isotope mea-surements” by Kaiser (2011), Biogeosciences, 8, 2993002997, doi:10.5194/bg-8-2993-2011, 2011.
Nicholson, D. P.: Interactive comment on “Comment on “Consis-tent calculation of aquatic gross production from oxygen triple isotope measurements” by Kaiser (2011)” by D. P. Nicholson, Biogeosciences Discuss., 8, C3140, 2011b.
Prokopenko, M.: Interactive comment on “Comment on “Consis-tent calculation of aquatic gross production from oxygen triple isotope measurements” by Kaiser (2011)” by D. P. Nicholson, Biogeosciences Discuss., 8, C3041, 2011.
Prokopenko, M. G., Pauluis, O. M., Granger, J., and Yeung, L. Y.: Exact evaluation of gross photosynthetic production from the
oxygen triple-isotope composition of O2: Implications for the
net-to-gross primary production ratios, Geophys. Res. Lett., 38, L14603, doi:10.1029/2011gl047652, 2011.
Quay, P. D., Emerson, S., Wilbur, D. O., and Stump, C.: Theδ18O
of dissolved oxygen in the surface waters of the subarctic Pacific: A tracer of biological productivity, J. Geophys. Res., 98, 8447– 8458, 1993.
Reuer, M. K., Barnett, B. A., Bender, M. L., Falkowski, P. G., and Hendricks, M. B.: New estimates of Southern Ocean biological
production rates from O2/Ar ratios and the triple isotope
compo-sition of O2, Deep-Sea Res. I, 54, 951–974, 2007.
Tcherkez, G. and Farquhar, G. D.: On the16O/18O isotope effect
associated with photosynthetic O2production, Funct. Plant Biol.,