https://doi.org/10.5194/bg-14-3549-2017 © Author(s) 2017. This work is distributed under the Creative Commons Attribution 3.0 License.
Daily variation in net primary production and net calcification in
coral reef communities exposed to elevated
p
CO
2
Steeve Comeau1,2, Peter J. Edmunds1, Coulson A. Lantz1,3, and Robert C. Carpenter1
1Department of Biology, California State University, 18111 Nordhoff Street, Northridge, CA 91330-8303, USA
2School of Earth Sciences, Oceans Institute and ARC Centre of Excellence for Coral Reef Studies, The University of Western
Australia, Crawley, Western Australia 6009, Australia
3Southern Cross University School of Environment, Science, and Engineering, Military Road Lismore NSW 2480, Australia
Correspondence to:Steeve Comeau ([email protected])
Received: 21 February 2017 – Discussion started: 1 March 2017
Revised: 18 June 2017 – Accepted: 22 June 2017 – Published: 27 July 2017
Abstract.The threat represented by ocean acidification (OA) for coral reefs has received considerable attention because of the sensitivity of calcifiers to changing seawater carbonate chemistry. However, most studies have focused on the organ-ismic response of calcification to OA, and only a few have addressed community-level effects, or investigated parame-ters other than calcification, such as photosynthesis. Light (photosynthetically active radiation, PAR) is a driver of bio-logical processes on coral reefs, and the possibility that these processes might be perturbed by OA has important implica-tions for community function. Here we investigate how CO2
enrichment affects the relationships between PAR and com-munity net O2production (Pnet), and between PAR and
com-munity net calcification (Gnet), using experiments on three
coral communities constructed to match (i) the back reef of Mo’orea, French Polynesia, (ii) the fore reef of Mo’orea, and (iii) the back reef of O’ahu, Hawaii. The results were used to test the hypothesis that OA affects the relationship between
Pnet andGnet. For the three communities tested,pCO2 did
not affect the Pnet–PAR relationship, but it affected the
in-tercept of the hyperbolic tangent curve fitting theGnet–PAR relationship for both reef communities in Mo’orea (but not in O’ahu). For the three communities, the slopes of the linear relationships betweenPnetandGnetwere not affected by OA, although the intercepts were depressed by the inhibitory ef-fect of highpCO2onGnet. Our result indicates that OA can
modify the balance between net calcification and net photo-synthesis of reef communities by depressing community cal-cification, but without affecting community photosynthesis.
1 Introduction
Ocean acidification (OA), which is caused by the dissolu-tion of atmospheric CO2 in surface seawater, induces
pro-found changes in seawater carbonate chemistry, involving an increased concentration of dissolved CO2 and bicarbonate
ions, and a decrease in the concentration of carbonate ions and pH (Feely et al., 2004). The effects of these changes on tropical coral reefs are beginning to be understood in detail, with most studies reporting a decrease in calcification of scle-ractinian corals and coralline algae at reduced seawater pH (Gattuso and Hanson, 2011; Kroeker et al., 2013).
in-3550 S. Comeau et al.: Daily variation in net primary production and net calcification in coral reef communities
creasingpCO2on community net O2production has rarely
been investigated. Where this issue has been addressed, com-munity O2 production has been found to be insensitive to pCO2(to∼1000 µatm) (Leclerc et al., 2002; Langdon and
Atkinson, 2005, Dove et al., 2013), while a positive effect of pCO2 on the net production of photosynthetically fixed
organic carbon has been reported during a flume experiment (Langdon and Atkinson, 2005).
Investigating the combined response to OA of primary production and calcification of benthic coral reef communi-ties is critical, because increasing dissolved CO2and
bicar-bonate ion concentrations potentially could “fertilize” pho-tosynthesis of marine organisms (Connell and Russell, 2010; Hepburn et al., 2011; Connell et al., 2013), thereby perturb-ing ecosystem trophodynamics. A stimulatory effect of OA on photosynthesis could, for calcifying taxa such as corals and coralline algae, support higher rates of calcification by increasing the ease with which the metabolic costs of these events could be met through enhanced respiration fuelled by greater availability of carbon substrates (Comeau and Corn-wall, 2016). However, a stimulatory effect of OA on photo-synthesis has not been clearly established for coral reef or-ganisms, and to date, the evidence in support of this possi-bility is equivocal (e.g., Anthony et al., 2008; Kroeker et al., 2013; Comeau et al., 2016a).
One reason why studies of the effect of pCO2 on the
relationship between primary production and calcification are technically challenging is that the relationships be-tween light (photosynthetically active radiation, PAR) and both photosynthesis and calcification are nonlinear (e.g., Borowitzka, 1981; Chalker et al., 1988; Muscatine, 1990; Chisholm, 2000). In symbiotic reef corals, the relationships between photosynthesis and PAR, and between calcification and PAR, generally are best fit by a hyperbolic tangent func-tion (Chalker, 1981; Marubini et al., 2001), which is char-acterized by a rapid rise of photosynthesis (or calcification) with initial increases in PAR from darkness, followed by a plateau of response at saturating light, and sometimes a re-duction in response at the highest PAR intensity (i.e., pho-toinhibition, e.g., Brown et al., 1999). No studies have in-vestigated the effect ofpCO2enrichment on the
mathemat-ical parameters defining the hyperbolic tangent relationship between PAR and photosynthesis (or calcification) for coral reef organisms and communities.
Because calcification of coral reef communities is cou-pled to photosynthesis on timescales of hours to days (Gat-tuso et al., 1999), examination of high-frequency variation in the net O2production (Pnet)–net calcification (Gnet)
rela-tionships for these communities has the potential to reveal the capacity to respond dynamically to varying conditions (i.e., Jokiel et al., 2014). The relationship between Pnetand Gnetfor coral reefs is relatively well known at the community
level, and generally describes a positive linear relationship (Gattuso et al., 1999; Falter et al., 2012). Such a relationship reflects emergent properties arising from the stimulation of
GnetbyPnetat the organism scale (i.e., for corals and calci-fied algae) (Jokiel et al., 2014), most likely becausePnetcan supply the carbon resources necessary as substrates for aero-bic respiration (Stambler, 2011), modify the intracellular and surrounding seawater chemistry (Marubini et al., 2008; Jok-iel et al., 2014), and provide the building blocks necessary to construct the organic matrix found within coral skeletons (Muscatine et al., 2005). Unfortunately, it is difficult to test the hypothesis that theGnet–Pnet relationship for reef
com-munities is affected by carbonate chemistry, because the sea-water chemistry varies withPnetin the natural environment
(Jokiel et al., 2014; Shaw et al., 2015). To test for an effect of seawater carbonate chemistry on theGnet–Pnet relationship of reef communities, it is therefore necessary to conduct ex-periments in a controlled environment to assess how seawater carbonate chemistry alone affects theGnet–Pnetrelationship. The present study tests the hypothesis that the enrichment in seawaterpCO2due to OA will affect the relationships
be-tweenPnet and PAR, and betweenGnet and PAR for intact
reef communities fabricated in outdoor flumes (sensu Atkin-son et al., 1994). The second hypothesis tested is that the
Pnet–Gnet relationships would be affected by OA, based on
the rationale that communityPnetandGnetwould respond in
dissimilar ways to highpCO2. Because the shape of these
relationships likely depends on the community composition (i.e., the taxa present and their relative abundances, Gattuso et al., 1999), we used results from three independent ex-periments to explore variations in the relationships caused by differences in environmental conditions and differences in the taxonomic assemblages composing the communities tested. Data from three experiments conducted in flumes in two locations in the tropical Pacific were combined; one ex-periment focused on a back reef community assembled in Mo’orea, French Polynesia, during the austral spring of 2013 (Comeau et al., 2015); one experiment focused on a reef flat (back reef) community assembled in K¯ane’ohe Bay, O’ahu, during the winter of 2014; and one experiment focused on a fore reef community assembled in Mo’orea, during the aus-tral spring of 2014 (Comeau et al., 2016b). For the com-munities analysed in Mo’orea, the present contribution de-scribes in more detail the results for net calcification, as well as new results for photosynthesis that originate from experi-ments that are described in part in previous papers (Comeau et al., 2015, 2016b); the study conducted in O’ahu has not been described before. The three communities were incu-bated in outdoor flumes of similar designs, and were operated under ambient and elevatedpCO2(∼400 and∼1300 µatm,
2 Materials and methods
2.1 Collection and sample preparation
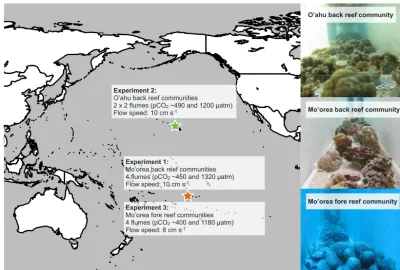
This study utilizes results from three experiments conducted between August 2013 and October 2014. The first and third experiments were carried out in Mo’orea, French Polynesia, at the Richard B. Gump South Pacific Research Station, and the second experiment was conducted in O’ahu, Hawaii, on Coconut Island at the Hawaii Institute of Marine Biology (Fig. 1).
The first experiment took place in August–October 2013, and focused on a back reef community from 1 to 2 m depth on the northern shore of Mo’orea (Comeau et al., 2015). When the study was completed, this community consisted of 22 % coral cover and 6 % coralline alga cover. Two-thirds of the area of the working section of the flume was occupied by sediments collected from the lagoon at 2 m depth.
The second experiment was carried out in O’ahu in January–February 2014 and focused on a benthic commu-nity similar to that found at 1–2 m depth on the K¯ane’ohe Bay barrier reef flat in 2013. This community consisted ofPorites
compressa(7 % cover),Montipora capitata(12 %), massive
Poritesspp. (3 %), andPocillopora damicornis(2 %), and the
crustose coralline alga Porolithon onkodes (4 %) (Jokiel et al., 2015). As described above for Experiment 1, sediments were inserted into the floor of the flume to recreate ecolog-ically relevant communities. Since the flumes in O’ahu (as designed and utilized by M. Atkinson, e.g., Atkinson et al., 1994) were not designed to include sediments, a custom-made sediment box was inserted into the floor of the flumes to provide an area occupying two-thirds of the floor of the working section of the flume with sediment to a depth of
∼5–8 cm.
The third experiment was carried out from August to October 2014 in Mo’orea, and focused on outer reef ben-thic communities prepared from specimens collected from
∼15 to 17 m depth (Comeau et al., 2016b). This commu-nity consisted of 27 % cover of corals and 5 % cover of coralline algae; 55 % of the floor of the flume was covered by∼20×20×5 cm pieces of reef pavement collected from
∼15 m.
In Mo’orea, the two experiments were performed in four outdoor flumes consisting of a working section of 5.0×0.3×
0.3 m (as in Comeau et al., 2015) in which water was re-circulated at a constant speed of 10±0.5 cm s−1(mean±SE (standard error); Experiment 1) or 8±0.5 cm s−1
(Experi-ment 3) that represented the mean in situ flow speed over the year measured in the two habitats (Washburn and MCR LTER, 2015; Comeau et al., 2016b). Two flumes were main-tained at ambient pCO2 (∼400 µatm) and two at elevated pCO2 (∼1200–1300 µatm; see below). Fresh sand-filtered
seawater was dispensed continuously into the flumes at 5 L min−1, and the experiments lasted 8 (Experiment 1) or 7 weeks (Experiment 3).
In O’ahu, the benthic community was constructed in two outdoor flumes, one with a working section of 9×0.6×0.3 m and one with a working section of 4×0.4×0.4 m; one of these flumes was maintained at ambientpCO2and one at
el-evatedpCO2. To address the confounding effect of flumes on
this design (i.e., the flumes were allocated to one of two treat-ments and the flumes were not of an identical design), the first experiment ended after 3 weeks, thepCO2 treatments
were switched between flumes, and new communities (with the same taxon composition including sediment) were placed in the two flumes for a second trial of the same experiment lasting 3 weeks. Fresh sand-filtered seawater was dispensed continuously into both flumes (at 5–10 L min−1), and a flow speed of 10 cm s−1, similar to that employed in the earlier trial with the back reef communities of Mo’orea, was main-tained using electric trolling motors (Minnkota USA Riptide 55, Minnkota, USA).
The three experiments were performed outdoors under natural sunlight that was attenuated using shade cloth to maintain PAR values similar to ambient PAR recorded in situ in each habitat. In Experiments 1 and 2, the maxi-mum PAR was set at ∼1000 µmol quanta m−2s−1 to rep-resent light levels at ∼1–2 m depth in the back reef (Car-penter et al., 2016), and in Experiment 3, maximum PAR was set at∼600 µmol quanta m−2s−1 to mimic light levels recorded at 17 m depth on the fore reef of Mo’orea around noon on a cloudless day (Carpenter et al., 2016). For Exper-iment 3 (with an outer reef community from deeper water), blue acetate filters (Lee Filters 183 Moonlight Blue) were placed over the flumes to filter ambient sunlight in the 600– 800 nm range to approximate the light spectrum found at 17 m depth (Comeau et al., 2016a). Temperature in all flumes was maintained at ambient seawater temperature when the experiments were conducted, which corresponded to∼27◦C in Experiments 1 and 3 (both conducted in austral spring) and
∼24◦C in Experiment 2 (conducted in winter).
2.2 Carbonate chemistry manipulations and measurements
For the three experiments,pCO2levels were chosen to match
ambientpCO2(∼400 µatm) and thepCO2expected in the
atmosphere by the middle of the next century (∼1300 µatm, Moss et al., 2010).pCO2in the flumes was controlled using
pH controllers (Aquacontroller, Neptune systems, USA) that controlled the delivery of either pure CO2 or CO2-free air
3552 S. Comeau et al.: Daily variation in net primary production and net calcification in coral reef communities
Experiment 2:
O’ahu back reef communities
2 x 2 flumes (pCO2 ~490 and 1200 atm)
Flow speed: 10 cm s
Flow speed: 10 cm s Flow speed: 10 cm s Flow speed: 10 cm s-1
Experiment 1:
Experiment 1:
Mo’orea back reef communities
Mo’orea back reef communities Mo’orea back reef communities Mo’orea back reef communities Mo’orea back reef communities Mo’orea back reef communities Mo’orea back reef communities Mo’orea back reef communities Mo’orea back reef communities Mo’orea back reef communities
4 flumes (pCO
4 flumes (pCO 4 flumes (pCO 4 flumes (pCO 4 flumes (pCO 4 flumes (pCO 4 flumes (pCO 4 flumes (pCO
4 flumes (pCO2 ~450 and 1320 ~450 and 1320 ~450 and 1320 atm)
Flow speed: 10 cm s
Flow speed: 10 cm s Flow speed: 10 cm s Flow speed: 10 cm s Flow speed: 10 cm s Flow speed: 10 cm s Flow speed: 10 cm s Flow speed: 10 cm s Flow speed: 10 cm s Flow speed: 10 cm s Flow speed: 10 cm s Flow speed: 10 cm s-1
Experiment 3:
Experiment 3: Experiment 3: Experiment 3:
Mo’orea fore reef communities 4 flumes (pCO
4 flumes (pCO 4 flumes (pCO 4 flumes (pCO
4 flumes (pCO2 ~400 and 1180 atm)
Flow speed: 8 cm s-1
O’ahu back reef community
Mo’orea back reef community
[image:4.612.98.499.65.335.2]Mo’orea fore reef community
Figure 1.Map showing the study locations and photos of the three assembled communities. Experiments were performed on three coral reef
communities representing the back reef of Mo’orea (Experiment 1), the back reef of O’ahu (Experiment 2), and the fore reef of Mo’orea (Experiment 3). The respectivepCO2levels and flow speeds used are indicated.
avoid confounding effects. Diel variation in pH was not ap-plied during Experiment 3, because seawater pH varies by
<0.1 between day and night on the fore reef of Mo’orea (S. Comeau, unpublished data).
For the three experiments, pH on the total scale (pHT)was measured daily using a portable pH meter (Orion 3-stars, Thermo-Scientific, USA) fitted with a DG 115-SC pH probe (Mettler Toledo, Switzerland) calibrated every other day with Tris/HCl buffers (Dickson et al., 2007). pHT also was
mea-sured every 2 weeks spectrophotometrically using m-cresol dye (Dickson et al., 2007). Mean values of pHT measured
spectrophotometrically and using a pH electrode differed by
<0.02 pH units. Total alkalinity (AT) was measured using
open-cell potentiometric titrations (Dickson et al., 2007) on
∼50 g samples of seawater collected every 2–3 days. Ac-curacy of AT measurements was checked by titrating
cer-tified reference materials provided by A.G. Dickson (batch 122 and 140) that yieldedATvalues within∼4 µmol kg−1of
the nominal value. Parameters of the carbonate system in sea-water were determined with the seacarb R package (Gattuso et al., 2015) using measured values of pHT,AT, temperature,
and salinity.
2.3 Net calcification and primary production measurements
Net community calcification (Gnet)in the flumes was mea-sured using the total alkalinity anomaly method (Chisholm and Gattuso 1991; Schoepf et al., 2017), and net community primary production (Pnet)was measured using oxygen
sen-sors (TROLL 9500, In-Situ) that measured the O2
concentra-tion at 60 s intervals with an accuracy of 0.2 mg L−1. Oxygen sensors were calibrated at the beginning of the experiment using a two-point calibration (0 and 100 % O2seawater
solu-tions). Measurements of changes in dissolved inorganic car-bon (DIC) were not meaningful with our experimental design because DIC was held constant by adding pure CO2during
the incubations to maintainpCO2at target values.
For the three experiments, community metabolism was measured every 7 days using single 24 h incubations during which the addition of seawater to the flumes was stopped, and the flumes were operated in a closed circuit mode. Dur-ing these incubations, seawater samples for the determination ofATwere taken every 3 h during the day, and every 6 h at
night, to estimateGnet, while O2was constantly monitored.
To maintainAT, nutrient concentrations, andpO2at values
50 µmol kg−1) during the incubations, which likely did not affect the metabolism of organisms. Since only two O2
sen-sors were available, and experiments were conducted in four flumes in Mo’orea,Pnetwas measured for each incubation in
one ambient flume and one elevatedpCO2flume that were
randomly picked. In O’ahu, one O2sensor was used in each
flume during the incubations. Acrylic covers placed on top of the flumes limited gas exchange with the atmosphere but did not prevent it. Gas exchange between seawater and the atmosphere was estimated based on the flume surface areas, the flow speed, and the differences between the O2
concen-tration measured in seawater and the theoretical O2
concen-trations when in equilibrium with the atmosphere following equations of Langdon and Atkinson (2005). Wind effects on gas exchange across the air–water interface were assumed to be negligible because acrylic covers protected flumes. Gas exchange was estimated to be small (i.e.<5–10 %) because
∼50 % of the flume volume was replaced every 3 h during the day. Gas exchange was similar between treatments and was therefore not taken into account in the present study. Light was monitored constantly during the incubations using cosine-corrected PAR sensors (Odyssey, Dataflow Systems Pty Ltd, Christchurch, New Zealand).
2.4 Calculations and statistical analysis
Pnet was estimated hourly by calculating the change in O2
during the incubations, except for the hours during which the seawater was refreshed (06:00, 09:00, 12:00, 15:00, 18:00, and 00:00 LT).Gnetwas estimated at 3 h intervals during the day and 6 h intervals at night by collectingATsamples at the beginning (after seawater refreshing) and at the end of each incubation (before adding fresh seawater).
Because there were no significant differences in calcifi-cation between flumes for each treatment (Comeau et al., 2015, 2016a), Gnet was pooled among replicate flumes in
each treatment.Pnet was measured in Mo’orea in only one
flume per treatment at a time, and it was assumed that the measurements represented the average response to the con-ditions experienced in each treatment. Individual measure-ments ofGnetandPnetin O’ahu were considered replicates.
A corrected Akaike information criterion (AIC) approach was used to determine whether a linear, logarithmic, or hy-perbolic tangent function best described the functional rela-tionships betweenPnetand PAR, and betweenGnetand PAR, for each community (see details in Comeau et al., 2013). A linear relationship was fit to explore a “proportional ef-fect” model for increasing PAR. A logarithmic function and a hyperbolic tangent function that are commonly used to de-scribe the relationship betweenPnetand PAR for reef corals
(Chalker, 1981; Marubini et al., 2001) were also fit to the data in cases where photosynthesis (or calcification) initially rapidly increased with PAR, and then approached an asymp-tote at saturating PAR.
The hyperbolic tangent function between PAR andPnetin the light corresponded to
Pnet=C0+Pnet maxtanh (αI )
Pnet max
, (1)
wherePnet maxis the maximum photosynthetic rate,Iis PAR,
αis the slope of the initial portion of thePnetversusI rela-tionship, andC0is the intercept.
Similarly, the hyperbolic tangent function for the relation-ship between PAR andGnetin the light was
Gnet=C0+Gnet maxtanh
(αI )
Gnet max
, (2)
whereGnet maxis the maximum calcification rate,I is PAR, αis the slope of the initial portion of theGnetversusI
rela-tionship, andC0is the intercept.
The best fits of the functions (least squares) were deter-mined using thenls function in R, andt-tests were used to compare the curve parameters betweenpCO2treatments.
To test the hypothesis thatPnetandGnetwere associated,
meanPnetcorresponding to theGnetdetermination intervals
(3 h periods during the day and 6 h at night) were calculated, and the relationship betweenPnetandGnetwas investigated using a correlation approach (sensu Gattuso et al., 1999). When the linear associations betweenGnetonPnetwere sig-nificant, analyses of covariance (ANCOVA), withPnetas the covariate, were used to test the effects ofpCO2(a fixed
ef-fect) on thePnet–Gnetrelationship for each experiment. All analyses were performed using R software (R Foundation for Statistical Computing). In this design, bothPnetandGnetare
random variables for which a test of association is best ac-complished with correlation. Evaluating the slope and inter-cept is problematic as it is not appropriate to use Model I (least squares) approaches for the purpose of describing the functional relationship between two random variables. In the present case, we report Model I slopes because we are inter-ested in the capacity to predictGnetfromPnetand because Model I slopes are integral to the ANCOVA approach.
3 Results
Carbonate chemistry was tightly controlled during the three experiments, with mean pCO2 maintained at 453±30,
460±23, and 400±14 µatm in the ambient treatments, and 1317±50, 1233±76, and 1176±37 µatm in the elevated
pCO2 treatments during Experiments 1, 2, and 3,
respec-tively (all±SE, n=42–56). In all experiments and both treatments, aragonite saturation states (arag)were∼3.52,
2.59, and 3.71 in the ambient treatments, and 1.64, 1.36, and 1.75 in the elevatedpCO2treatments during Experiments 1,
2, and 3, respectively (Table 1).aragwas lower during
3554 S. Comeau et al.: Daily variation in net primary production and net calcification in coral reef communities
Table 1.Mean carbonate chemistry and temperature treatments in the flumes during the experiments conducted with back reef communities
in Mo’orea and O’ahu, and the fore reef community in Mo’orea. The mean±SE partial pressure of CO2(pCO2) and the saturation states of
aragonite (arag) were calculated from pHT, total alkalinity (AT), salinity (S), and temperature (T). SE for salinity was<0.1.
Experiment Treatment pHT AT pCO2 CT arag S T
Mo’orea back reef Ambient 8.01±0.02 2339±2 453±30 2025±9 3.52±0.09 35.9 26.9±0.1
OA 7.61±0.01 2344±1 1317±50 2230±7 1.64±0.06 35.9 27.0±0.1
O’ahu back reef Ambient 7.96±0.01 2160±4 490±23 1936±8 2.59±0.06 33.4 23.9±0.2
OA 7.62±0.02 2164±4 1233±76 2074±12 1.36±0.10 33.4 23.9±0.2
Mo’orea fore reef Ambient 8.04±0.01 2329±2 400±14 1992±8 3.71±0.08 36.5 27.1±0.1
OA 7.65±0.01 2330±2 1176±37 2198±6 1.75±0.05 36.5 27.0±0.1
and temperature (∼24◦C) in this location (cf. in Mo’orea whereATis∼2340 µmol kg−1at 27◦C).
Benthic community structure in the flumes was not mea-sured during these short experiments, and we assume that changes were minor as there was no major coral mortal-ity and planar growth would have been trivial over several weeks.
3.1 Relationships ofPnetandGnetwith PAR
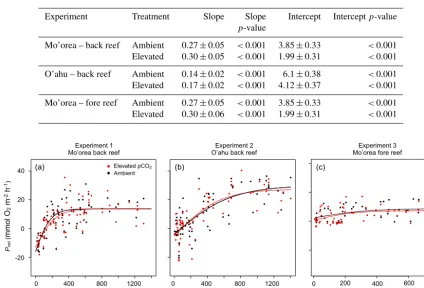
AIC analyses justified the use of a hyperbolic tangent func-tion (versus linear or logarithmic funcfunc-tions) to fit the rela-tionship betweenPnet and PAR during the day for the back
reef communities of Mo’orea and O’ahu under the twopCO2
conditions (Fig. 2a, b, and c; Table S1 in the Supplement). Since the hyperbolic tangent function could not be rejected for the fore reef community of Mo’orea, this model was also chosen to facilitate comparisons between experiments. For the back reef community of Mo’orea, the back reef commu-nity of O’ahu, and the fore reef commucommu-nity of Mo’orea, there was no effect ofpCO2on any of the parameters of the
rela-tionship betweenPnetand PAR (Table 2).
Similar toPnet, AIC tests also confirmed that the relation-ships ofGnetwith PAR could be fit with a hyperbolic tangent function for the three experiments under the twopCO2
con-ditions tested (Fig. 3a–c; Table S2). For the Mo’orea back reef community, there was no difference in maximum calcifi-cation (Gnet max)and the slope of the initial portion of the
re-lationship (α)betweenpCO2treatments (Table 2). However, pCO2affected the intercepts (C0,p=0.046), withC0at
am-bientpCO2(1.26 mmol m−2h−1)greater thanC0at elevated pCO2(−0.52 mmol m−2h−1). The relationship ofGnetwith
PAR for the back reef communities in O’ahu was not statis-tically affected by pCO2 (Table 2). For the fore reef
com-munity of Mo’orea, Gnet max andα did not differ between treatments, but C0 was higher (2.77 mmol O2m−2h−1) at
ambient versus elevatedpCO2(0.58 mmol O2m−2h−1)
(Ta-ble 2).
Table 2.Results of thet-tests used to compare betweenpCO2
treat-ments the parameters of the hyperbolic tangent functions describ-ing the relationship between community net photosynthesis (Pnet)
in the light and PAR and net calcification (Gnet)in the light and
PAR. Parameters of the hyperbolic function are the maximum rate
(Pnet maxandGnet max), the slope of the initial portion of the
rela-tionship (α), and the intercept (C0).
Parameter Experiment Function p-value parameter
Net photosynthesis Mo’orea – back reef Pnet max 0.558
(Pnet) α 0.387
C0 0.559
O’ahu – back reef Pnet max 0.840
α 0.536
C0 0.621
Mo’orea – fore reef Pnet max 0.942 α 0.792
C0 0.579
Net calcification Mo’orea – back reef Gnet max 0.376
(Gnet) α 0.836
C0 0.046
O’ahu – back reef Pnet max 0.867
α 0.126
C0 0.394
Mo’orea – fore reef Pnet max 0.736
α 0.715
C0 0.002
3.2 Relationships betweenPnetandGnet
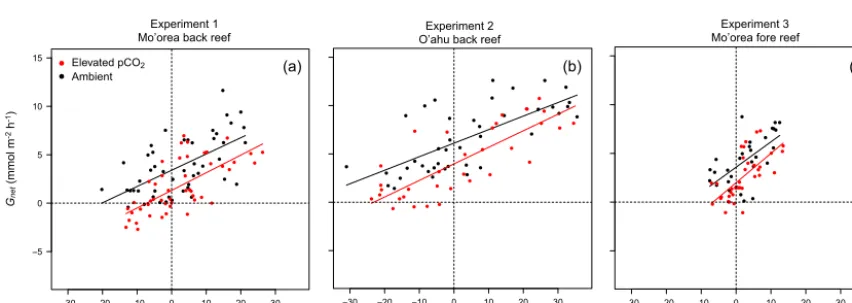
For the back reef communities of Mo’orea, the relation-ship betweenPnetandGnetwas significantly and positively correlated (p <0.001 under ambient and elevated pCO2)
with slopes of 0.17±0.03 mmol CaCO3mmol O−21 under
ambient pCO2, and 0.18±0.03 mmol CaCO3mmol O−21
(both±SE,n=48) under elevatedpCO2(Fig. 4a, Table 3).
[image:6.612.308.545.320.563.2]Table 3.Results of the linear regressions modeling thePnet–Gnetrelationships under ambient and elevatedpCO2. Results are shown for the
experiments with back reef communities in Mo’orea and O’ahu, and fore reef communities in Mo’orea.
Experiment Treatment Slope Slope Intercept Interceptp-value
p-value
Mo’orea – back reef Ambient 0.27±0.05 <0.001 3.85±0.33 <0.001
Elevated 0.30±0.05 <0.001 1.99±0.31 <0.001
O’ahu – back reef Ambient 0.14±0.02 <0.001 6.1±0.38 <0.001
Elevated 0.17±0.02 <0.001 4.12±0.37 <0.001
Mo’orea – fore reef Ambient 0.27±0.05 <0.001 3.85±0.33 <0.001
Elevated 0.30±0.06 <0.001 1.99±0.31 <0.001
(a) (b) (c)
● ● ● ● ● ● ●● ● ● ● ● ● ● ● ●● ● ● ● ● ● ● ● ●● ● ● ● ● ● ● ● ● ● ● ● ● ● ● ● ● ● ● ●
0 200 400 600
20 0 20 40 Light level O2 ( mmol m
2 h 1) ● ● ● ● ● ● ● ● ● ● ● ● ● ● ● ● ● ● ● ● ● ● ● ●● ● ● ● ● ● ● ● ●● ● ● ● ● ● ● ● ●● ● ● ● ● ● ● ● ● ● ●
0 200 400 600 800 1000 1200 1400 20 0 20 40 Light Pnet (mmol m
2 h 1) ● ● ● ● ● ● ● ● ● ● ● ● ● ● ● ● ● ● ● ● ● ● ● ● ● ● ● ● ● ● ● ● ● ● ●● ● ● ● ● ● ● ● ● ● ● ● ● ● ● ● ●● ● ● ● ● ● ● ● ● ● ● ● ● ● ● ● ● ● ● ● ● ● ● ● ● ● ● ● ● ● ● ● ● ● ● ● ● ● ● ● ● ● ● ● ● ● ● ● ● ● ● ● ● ● ●● ● ● ● ● ● ● ● ● ● ● ● ● ● ● ● ●● ● ● ● ● ● ● ● ● ● ● ● ● ● ● ● ● ● ● ● ● ●
High pCO2
Ambient ● ● ● ● ● ● ● ● ● ● ● ● ● ● ● ● ● ● ● ● ● ● ● ● ● ● ● ● ● ● ● ● ● ● ● ● ● ● ● ● ● ● ● ● ● ● ● ● ● ● ● ● ● ● ● ● ● ● ● ● ● ● ● ● ● ● ● ● ● ● ● ● ● ● ● ● ●
0 200 400 600 800 1000 1200 1400 20
0 20 40
Irradiance (µmol quanta m2 s1)
O2
(
mmol
m
2 h 1) ● ● ● ● ● ● ● ● ● ● ● ● ● ● ● ● ● ● ● ● ● ● ● ● ● ● ● ● ● ● ● ● ● ●● ● ● ● ● ● ● ● ● ● ● ● ● ● ● ● ● ● ● ● ● ● ● ● ● ● ● ● ● ● ● ● ● ● ● ● ● ● ● ● ● ● ● ● ● ● ● ● ● ● ●● ● ● ● ● ● ● ● ● ● ● ● ● ● ● ● ● ● ● ● ● ● ● ● ● ● ● ● ● ● ● ● ● ● ● ● ● ● ● ●●
0 100 200 300 400 500 600 5 0 5 10 15 20 Light level Calcification ( mmol m
2 h 1) ● ● ● ● ● ● ● ● ● ● ● ● ● ● ● ● ● ● ● ● ● ● ● ● ● ● ● ● ● ● ● ● ● ● ● ● ● ● ● ● ● ● ● ● ● ● ● ● ● ● ● ● ● ● ● ● ● ● ● ● ● ● ● ● ● ● ● ● ● ● ● ● ● ● ● ● ● ● ● ●
0 200 400 600 800 1000 1200 1400 5 0 5 10 15 20 Light level O2 ( mmol m
2 h 1) ● ● ● ● ● ● ● ● ● ● ● ● ● ● ● ● ● ● ● ● ● ● ● ●
A B C
Experiment 1
Mo’orea back reef O’ahu back reefExperiment 2 Mo’orea fore reefExperiment 3
0 200 400 600 800 1000 1200 1400 5 0 5 10 15 20 Light Gnet ( mmol m
2 h 1) ● ● ● ● ● ● ● ● ● ● ● ● ● ● ● ● ● ● ● ● ● ● ● ● ● ● ● ● ● ● ● ● ● ● ● ● ● ● ● ● ● ● ● ● ● ● ● ● ● ● ● ● ● ● ● ● ● ● ● ● ● ● ● ● ● ● ● ● ● ● ● ● ● ● ● ● ● ● ● ● ● ● ● ● ● ● ● ● ● ● ● ● ● ● ● ● ● ● ● ● ● ● ● ● ● ● ● ● ● ● ● ● ● ● ● ● ● ● ● ● ● ● ● ● ● ● ● ●
0 200 400 600 800 1000 1200 1400 20 0 20 40 Light Pnet (mmol m
2 h 1) ● ● ● ● ● ● ● ● ● ● ● ● ● ● ● ● ● ● ● ● ● ● ● ● ● ● ● ● ● ● ● ● ● ● ● ● ● ● ● ● ● ● ● ● ● ● ● ● ● ● ● ● ● ● ● ● ● ● ● ● ● ● ● ● ● ● ● ● ● ● ● ● ● ● ●● ● ● ● ● ● ● ● ● ● ● ● ● ● ● ● ● ● ● ● ● ● ● ● ● ● ● ● ● ● ● ● ● ● ● ● ●● ● ● ● ● ● ● ● ● ● ● ● ● ● ● ● ● ● ● ● ● ● ● ● ● ● ● ● ● ● ● ● ● ● ● ● ● ● ● ● ● ● ● ● ● ● ● ● ● ● ● ● ● ● ● ● ● ● ● ● ● ● ● ● ● ● ● ● ● ● ● ● ● ● ● ● ● ● ● ● ● ● ● ● ● ● ● ● ● ● ● ● ● ● ● ● ● ● ● ● ● ● ● ● ● ● ● ● ● ● ● ● ● ● ●● ● ● ● ● ● ● ● ● ● ● ● ● ● ● ● ● ● ● ● ● ● ● ● ● ● ● ● ● ● ● ● ● ● ● ● ●● ● ● ● ● ● ● ● ● ● ● ● ● ● ● ● ● ● ● ● ● ● ● ● ● ● ● ● ● ● ● ● ● ● ● ● ● ● ● ● ● ●
Elevated pCO2
Ambient
0 400 800 1200 0 400 800 1200 0 200 400 600
● ● ● ● ● ● ● ● ● ● ● ● ● ● ● ● ● ● ● ● ● ● ● ●
0 200 400 600 800 1000 1200 1400 5 0 5 10 15 20
Irradiance (µmol quanta m2 s1)
CaCO
3
(
mmol
m
2 h
1) ● ● ● ● ● ● ● ● ● ● ● ● ● ● ● ● ● ● ● ● ● ● ● ●
0 400 800 1200 0 400 800 1200 0 200 400 600
Experiment 1
Mo’orea back reef O’ahu back reefExperiment 2 Mo’orea fore reefExperiment 3 PAR ( mol quanta m-2 s-1)
PAR ( mol quanta m-2 s-1)
Pnet ( mmo l O 2 m
-2 h -1) 0 20 40 -20 Gnet ( mmo l m
-2 h -1) 0 -5 5 10 15 20
0 200 400 600 800 1000 1200 1400 20 0 20 40 Light Pnet (mmol m
2 h 1) ● ● ● ● ● ● ● ● ● ● ● ● ● ● ● ● ● ● ● ● ● ● ● ● ● ● ● ● ● ● ● ● ● ● ● ● ● ● ● ● ● ● ● ● ● ● ● ● ● ● ● ● ● ● ● ● ● ● ● ● ● ● ● ● ● ● ● ● ● ● ● ● ● ● ●● ● ● ● ● ● ● ● ● ● ● ● ● ● ● ● ● ● ● ● ● ● ● ● ● ● ● ● ● ● ● ● ● ● ● ● ●● ● ● ● ● ● ● ● ● ● ● ● ● ● ● ● ● ● ● ● ● ● ● ● ● ● ● ● ● ● ● ● ● ● ● ● ● ● ● ● ● ● ● ● ● ● ● ● ● ● ● ● ● ● ● ● ● ● ● ● ● ● ● ● ● ● ● ● ● ● ● ● ● ● ● ● ● ● ● ● ● ● ● ● ● ● ● ● ● ● ● ● ● ● ● ● ● ● ● ● ● ● ● ● ● ● ● ● ● ● ● ● ● ● ●● ● ● ● ● ● ● ● ● ● ● ● ● ● ● ● ● ● ● ● ● ● ● ● ● ● ● ● ● ● ● ● ● ● ● ● ●● ● ● ● ● ● ● ● ● ● ● ● ● ● ● ● ● ● ● ● ● ● ● ● ● ● ● ● ● ● ● ● ● ● ● ● ● ● ● ● ● ●
Elevated pCO2
Ambient
Figure 2.Relationships of net primary production (Pnet)in the light with PAR in three coral reef communities representing the back reef of
Mo’orea(a), the back reef of O’ahu(b), and the fore reef of Mo’orea(c). Communities were incubated under ambientpCO2(∼400 µatm,
black symbols and lines) and elevatedpCO2(∼1200 µatm, red symbols and lines). The curves represent the best fit of a hyperbolic tangent
function for the relationship betweenPnetwith PAR.
Gnet and Pnet for the back reef communities of O’ahu
also were positively correlated (p <0.001 under both ambient and elevated pCO2) and their relationships
ex-hibited slopes of 0.14±0.02 mmol CaCO3mmol O−21
un-der ambientpCO2, and 0.17±0.02 mmol CaCO3mmol O−21
(both±SE,n=36) under elevatedpCO2(Fig. 4b, Table 3).
There was no difference between treatments in slopes (AN-COVA,p=0.286), but the intercepts were 32 % greater un-der ambient versus elevatedpCO2(p <0.001).
For the fore reef community of Mo’orea, the rela-tionships between Gnet and Pnet were significant
un-der ambient and elevated pCO2 (p <0.001) and had
re-spective slopes of 0.27±0.05 mmol CaCO3mmol O−21 and
0.30±0.06 mmol CaCO3mmol O−21(both±SE,n=28;
Ta-ble 3). For the back reef communities, there were no differ-ences in the slopes betweenGnetandPnetbetween treatments (ANCOVA,p=0.623), but intercepts were 48 % greater un-der elevated versus ambientpCO2(p=0.002).
4 Discussion
By testing the response of three coral reef communities to OA under natural PAR, our study demonstrates that the rela-tionships betweenPnetand PAR andGnetand PAR for back
reef and outer reef communities are not affected bypCO2.
Our results also demonstrate that the slope of the relationship betweenPnet andGnetwas unaffected by increasingpCO2,
but in contrast, the intercepts were more elevated in the ambi-ent treatmambi-ents. Such results were caused by a constant effect of OA onGnet for the range ofPnetvalues measured in the three communities.
For the three assembled communities,pCO2did not affect
the functional relationship between PAR andPnetas modeled using a hyperbolic tangent function. This result suggests that for the organisms composing the three communities, the ad-ditional quantities of bicarbonate and dissolved CO2
varia-3556 S. Comeau et al.: Daily variation in net primary production and net calcification in coral reef communities
A B C
● ● ● ● ● ● ●● ● ● ● ● ● ● ● ●● ● ● ● ● ● ● ● ●● ● ● ● ● ● ● ● ● ● ● ● ● ● ● ● ● ● ● ●
0 200 400 600
20 0 20 40 Light level O2 ( mmol m
2 h 1) ● ● ● ● ● ●● ● ● ● ● ● ● ● ● ● ● ● ● ● ● ● ● ●● ● ● ● ● ● ● ● ●● ● ● ● ● ● ● ● ●● ● ● ● ● ● ● ● ● ● ●
0 200 400 600 800 1000 1200 1400 20 0 20 40 Light Pnet (mmol m
2 h 1) ● ● ● ● ● ● ● ● ● ● ● ● ● ● ● ● ● ● ● ● ● ● ● ● ● ● ● ● ● ● ● ● ● ● ●● ● ● ● ● ● ● ● ● ● ● ● ● ● ● ● ●● ● ● ● ● ● ● ● ● ● ● ● ● ● ● ● ● ● ● ● ● ● ● ● ● ● ● ● ● ● ● ● ● ● ● ● ● ● ● ● ● ● ● ● ● ● ● ● ● ● ● ● ● ● ●● ● ● ● ● ● ● ● ● ● ● ● ● ● ● ● ●● ● ● ● ● ● ● ● ● ● ● ● ● ● ● ● ● ● ● ● ● ●
High pCO2
Ambient ● ● ● ● ● ● ● ● ● ● ● ● ● ● ● ● ● ● ● ● ● ● ● ● ● ● ● ● ● ● ● ● ● ● ● ● ● ● ● ● ● ● ● ● ● ● ● ● ● ● ● ● ● ● ● ● ● ● ● ● ● ● ● ● ● ● ● ● ● ● ● ● ● ● ● ● ●
0 200 400 600 800 1000 1200 1400 20
0 20 40
Irradiance (µmol quanta m2 s1)
O2
(
mmol
m
2 h 1) ● ● ● ● ● ● ● ● ● ● ● ● ● ● ● ● ● ● ● ● ● ● ● ● ● ● ● ● ● ● ● ● ● ●● ● ● ● ● ● ● ● ● ● ● ● ● ● ● ● ● ● ● ● ● ● ● ● ● ● ● ● ● ● ● ● ● ● ● ● ● ● ● ● ● ● ● ● ● ● ● ● ● ● ●● ● ● ● ● ● ● ● ● ● ● ● ● ● ● ● ● ● ● ● ● ● ● ● ● ● ● ● ● ● ● ● ● ● ●● ● ● ● ●●
0 100 200 300 400 500 600 5 0 5 10 15 20 Light level Calcification ( mmol m
2 h 1) ● ● ● ● ● ● ● ● ● ● ● ● ● ● ● ● ● ● ● ● ● ● ● ● ● ● ● ● ● ● ● ● ● ● ● ● ● ● ● ● ● ● ● ● ● ● ● ● ● ● ● ● ● ● ● ● ● ● ● ● ● ● ● ● ● ● ● ● ● ● ● ● ● ● ● ● ● ● ● ●
0 200 400 600 800 1000 1200 1400 5 0 5 10 15 20 Light level O2 ( mmol m
2 h 1) ● ● ● ● ● ● ● ● ● ● ● ● ● ● ● ● ● ● ● ● ● ● ● ●
(a) (b) (c)
Experiment 1
Mo’orea back reef O’ahu back reefExperiment 2 Mo’orea fore reefExperiment 3
0 200 400 600 800 1000 1200 1400 5 0 5 10 15 20 Light Gnet ( mmol m
2 h 1) ● ● ● ● ● ● ● ● ● ● ● ● ● ●● ● ● ● ● ● ● ● ● ● ● ● ● ● ● ● ● ● ● ● ● ● ● ● ● ● ● ● ● ● ● ● ● ● ● ● ● ● ● ● ● ● ● ● ● ● ● ● ● ● ● ● ● ● ● ● ● ● ● ● ● ● ● ● ● ● ● ● ● ● ● ● ● ● ● ● ● ● ● ● ● ● ● ● ● ● ● ● ● ● ● ● ● ● ● ● ● ● ● ● ● ● ● ● ● ● ● ● ● ● ● ● ● ●
0 200 400 600 800 1000 1200 1400 20 0 20 40 Light Pnet (mmol m
2 h
1) ● ● ● ● ● ● ● ● ● ● ● ● ● ● ● ● ● ● ● ● ● ● ● ● ● ● ● ● ● ● ● ● ● ● ● ● ● ● ● ● ● ● ● ● ● ● ● ● ● ● ● ● ● ● ● ● ● ● ● ● ● ● ● ● ● ● ● ● ● ● ● ● ● ● ●● ● ● ● ● ● ● ● ● ● ● ● ● ● ● ● ● ● ● ● ● ● ● ● ● ● ● ● ● ● ● ● ● ● ● ● ●● ● ● ● ● ● ● ● ● ● ● ● ● ● ● ● ● ● ● ● ● ● ● ● ● ● ● ● ● ● ● ● ● ● ● ● ● ● ● ● ● ● ● ● ● ● ● ● ● ● ● ● ● ● ● ● ● ● ● ● ● ● ● ● ● ● ● ● ● ● ● ● ● ● ● ● ● ● ● ● ● ● ● ● ● ● ● ● ● ● ● ● ● ● ● ● ● ● ● ● ● ● ● ● ● ● ● ● ● ● ● ● ● ● ●● ● ● ● ● ● ● ● ● ● ● ● ● ● ● ● ● ● ● ● ● ● ● ● ● ● ● ● ● ● ● ● ● ● ● ● ●● ● ● ● ● ● ● ● ● ● ● ● ● ● ● ● ● ● ● ● ● ● ● ● ● ● ● ● ● ● ● ● ● ● ● ● ● ● ● ● ● ●
Elevated pCO2
Ambient
0 400 800 1200 0 400 800 1200 0 200 400 600
● ● ● ● ● ● ● ● ● ● ● ● ● ● ● ● ● ● ● ● ● ● ● ●
0 200 400 600 800 1000 1200 1400 5 0 5 10 15 20
Irradiance (µmol quanta m2 s1)
CaCO
3
(
mmol
m
2 h 1) ● ● ● ● ● ● ● ● ● ● ● ● ● ● ● ● ● ● ● ● ● ● ● ●
0 400 800 1200 0 400 800 1200 0 200 400 600
Experiment 1
Mo’orea back reef O’ahu back reefExperiment 2 Mo’orea fore reefExperiment 3 PAR ( mol quanta m-2 s-1)
PAR ( mol quanta m-2 s-1)
Pnet ( mmo l O 2 m
-2 h -1) 0 20 40 -20 Gnet ( mmo l m
-2 h -1) 0 -5 5 10 15 20
0 200 400 600 800 1000 1200 1400 20 0 20 40 Light Pnet (mmol m
2 h
1) ● ● ● ● ● ● ● ● ● ● ● ● ● ● ● ● ● ● ● ● ● ● ● ● ● ● ● ● ● ● ● ● ● ● ● ● ● ● ● ● ● ● ● ● ● ● ● ● ● ● ● ● ● ● ● ● ● ● ● ● ● ● ● ● ● ● ● ● ● ● ● ● ● ● ●● ● ● ● ● ● ● ● ● ● ● ● ● ● ● ● ● ● ● ● ● ● ● ● ● ● ● ● ● ● ● ● ● ● ● ● ●● ● ● ● ● ● ● ● ● ● ● ● ● ● ● ● ● ● ● ● ● ● ● ● ● ● ● ● ● ● ● ● ● ● ● ● ● ● ● ● ● ● ● ● ● ● ● ● ● ● ● ● ● ● ● ● ● ● ● ● ● ● ● ● ● ● ● ● ● ● ● ● ● ● ● ● ● ● ● ● ● ● ● ● ● ● ● ● ● ● ● ● ● ● ● ● ● ● ● ● ● ● ● ● ● ● ● ● ● ● ● ● ● ● ●● ● ● ● ● ● ● ● ● ● ● ● ● ● ● ● ● ● ● ● ● ● ● ● ● ● ● ● ● ● ● ● ● ● ● ● ●● ● ● ● ● ● ● ● ● ● ● ● ● ● ● ● ● ● ● ● ● ● ● ● ● ● ● ● ● ● ● ● ● ● ● ● ● ● ● ● ● ●
Elevated pCO2
[image:8.612.88.513.64.217.2]Ambient
Figure 3. Relationships of net calcification (Gnet)in the light with PAR in three coral reef communities representing the back reef of
Mo’orea(a), the back reef of O’ahu(b), and the fore reef of Mo’orea(c). Communities were incubated under ambientpCO2(∼400 µatm,
black symbols and lines) and elevatedpCO2(∼1200 µatm, red symbols and lines). The curves represent the best fit of a hyperbolic tangent
function for the relationship betweenGnetand PAR.
30 20 10 0 10 20 30
5 0 5 10 15
Back reef Hawaii
Pnet (mmol m2 h1)
Gnet
(
mmol
m
2 h 1) ● ● ● ● ● ● ● ● ● ● ● ● ● ● ● ● ● ● ● ● ● ● ● ● ● ● ● ● ● ● ● ● ●● ● ● ● ● ● ● ● ● ● ● ● ● ● ● ● ● ● ● ● ● ● ● ● ● ● ● ● ● ● ● ● ● ● ● ● ● ● ● ● ● ● ●
30 20 10 0 10 20 30
5 0 5 10 15
Back reef Moorea
Pnet (mmol m2 h1)
Gnet
(
mmol
m
2 h 1) ● ● ● ● ● ● ● ● ● ● ● ● ● ● ● ● ● ● ●● ● ● ● ● ● ● ● ● ● ● ● ● ● ● ● ● ● ● ● ● ● ● ● ● ● ● ● ● ● ● ● ● ● ● ● ● ● ● ● ● ● ● ● ● ● ● ● ● ● ● ● ● ● ● ● ● ● ● ● ● ● ● ● ● ● ● ● ●● ● ● ● ● ● ● ● ● ●
High pCO2
Ambient (a) (b) (c)
30 20 10 0 10 20 30
5 0 5 10 15
Fore reef Moorea
Pnet (mmol m2 h1)
Gnet
(
mmol
m
2 h 1) ● ● ● ● ● ●● ● ● ● ● ● ● ● ● ● ● ● ● ● ● ● ● ● ● ● ● ● ● ● ● ● ● ● ● ●● ● ● ● ● ● ● ● ● ● ● ● ●● ● ● ● ● ● ● ● ●● ● ● ● ● ● ● ● Experiment 1
Mo’orea back reef O’ahu back reefExperiment 2
Experiment 3 Mo’orea fore reef
0 200 400 600 800 1000 1200 1400 20 0 20 40 Light Pnet (mmol m
2 h 1) ● ● ● ● ● ● ● ● ● ● ● ● ● ● ● ● ● ● ● ● ● ● ● ● ● ● ● ● ● ● ● ● ● ● ● ● ● ● ● ● ● ● ● ● ● ● ● ● ● ● ● ● ● ● ● ● ● ● ● ● ● ● ● ● ● ● ● ● ● ● ● ● ● ● ●● ● ● ● ● ● ● ● ● ● ● ● ● ● ● ● ● ● ● ● ● ● ● ● ● ● ● ● ● ● ● ● ● ● ● ● ●● ● ● ● ● ● ● ● ● ● ● ● ● ● ● ● ● ● ● ● ● ● ● ● ● ● ● ● ● ● ● ● ● ● ● ● ● ● ● ● ● ● ● ● ● ● ● ● ● ● ● ● ● ● ● ● ● ● ● ● ● ● ● ● ● ● ● ● ● ● ● ● ● ● ● ● ● ● ● ● ● ● ● ● ● ● ● ● ● ● ● ● ● ● ● ● ● ● ● ● ● ● ● ● ● ● ● ● ● ● ● ● ● ● ●● ● ● ● ● ● ● ● ● ● ● ● ● ● ● ● ● ● ● ● ● ● ● ● ● ● ● ● ● ● ● ● ● ● ● ● ●● ● ● ● ● ● ● ● ● ● ● ● ● ● ● ● ● ● ● ● ● ● ● ● ● ● ● ● ● ● ● ● ● ● ● ● ● ● ● ● ● ●
Elevated pCO2 Ambient
Pnet (mmol O2 m-2 h-1)
Gnet
(mmo
l m
-2 h -1)
Figure 4.Variations inGnetas a function ofPnetat the three study sites:(a)Mo’orea back reef,(b)O’ahu back reef, and(c)Mo’orea fore
reef. Relationships were determined under controlpCO2(400 µatm, black points and lines) and elevatedpCO2(∼1200 µatm, red points and
lines). For the three communities and the twopCO2levels, the slopes of the linear relationships betweenPnetandGnetwere significant.
tions in community and organismicPnetandGnetare
com-mon on coral reefs (e.g., Falter et al., 2012). Whether increas-ingpCO2has beneficial consequences for rates of
photosyn-thesis of marine organisms is equivocal (Connell and Rus-sell, 2010; Britton et al., 2016) and, indeed, the absence of an effect ofpCO2on photosynthesis may have important
bi-ological meaning (e.g., Kroeker et al., 2013). For instance, such an outcome could reflect the presence of diverse carbon concentrating mechanisms (CCM), which allow organisms to actively concentrate CO2at the site of Rubisco activity by
actively transporting HCO−3 across internal membranes (Gi-ardano et al., 2005; Raven et al., 2014). Increases in concen-tration of dissolved CO2in seawater that occur as a result of
OA (Feely et al., 2004) could have beneficial consequences for photosynthetic rates of species that currently are DIC lim-ited (Diaz-Pulido et al., 2016), because these organisms often rely on inefficient and energetically costly CCMs to access CO2(Raven et al., 2014).
The present study, as well as previous studies of both coral reef organisms (corals and calcified algae) (Schneider and Erez, 2006; Comeau et al., 2016b) and coral reef communi-ties (Leclercq et al., 2002; Langdon et al 2003; Dove et al., 2013), showed no change inPnet, measured by changes in O2
concentrations, in response to OA arising frompCO2values
as high as 2000 µatm. Stimulatory effects ofpCO2onPnet
probably were not detected in our communities (i.e., where coral cover ranged from 22 to 27 %), because such effects are likely to be minimal for endosymbioticSymbiodiniumin corals that possess a CCM (Mackey et al., 2015) and, more-over, are able to exploit some of the host respiratory CO2
as an alternative DIC source (Stambler, 2011). Beneficial ef-fects of highpCO2 on community carbon production, but
[image:8.612.86.512.288.439.2]Hawai’i. This result led to the hypothesis that increasing CO2
causes a decrease in the photosynthetic quotient of corals, which could be a product of the metabolism of the coral host, if CO2favors the production of carbohydrates over proteins
and lipids (Langdon and Atkinson, 2005). While this hypoth-esis is appealing as a means to resolve discrepancy between studies, it was not possible to test in the present study be-causePnetwas determined through measurements of O2(see
Sect. 2, “Materials and methods”). In order to reconcile these apparently contradictory results regarding a potential “CO2
fertilization” effect, it would be necessary for future studies to simultaneously measure changes in O2, DIC, andAT. In
such an experiment, fluxes in DIC should be corrected for changes in AT due to calcium carbonate precipitation and dissolution (because 0.5 moles DIC is equivalent to 1 mole
AT(Gattuso et al., 1999). DIC data corrected by this means could then be compared against contemporaneous measure-ments of O2 in an experimental setup to ascertain whether
the expected 1:1 molar flux ratio (of DIC : O2) changes
un-der elevated seawaterpCO2. Changes in the value of this
ra-tio, relative to ambient conditions, may provide insight into the possibility that coral reef calcifiers alter the allocation of photosynthetically fixed carbon among carbohydrate, lipid, and protein pools as a result of exposure to elevated seawater
pCO2.
In our three experiments, maximal community Gnet
was coincident with the highest PAR. At low PAR (∼<50 µmol quanta m−2s−1) only the fore reef community in Mo’orea exhibited positive Pnet at both pCO2 levels,
demonstrating the capacity of this deeper community to pho-tosynthesize at lower intensities of PAR. Similar toPnet, the relationships ofGnetwith PAR at the twopCO2levels were
best fit by a hyperbolic tangent function. The lack of changes in the parameters of these relationships as a result of the treatment conditions demonstrated thatpCO2 and light did
not have interactive effects on Gnet (Table 2). Only the
el-evations of the hyperbolic functions for the two habitats in Mo’orea were affected by highpCO2, and in this case their
reduction relative to ambient pCO2 demonstrates thatGnet
was consistently lower, regardless of PAR intensity, at high
pCO2. Comparative data on the effect of the intensity of PAR
on the response of community calcification topCO2are not
available, but of the few studies of similar effects that have been conducted at the organism scale, contradictory results have been found (Marubini et al., 2001; Comeau et al., 2013, 2014b; Dufault et al., 2013; Suggett et al., 2013; Enochs et al., 2014).
The consistently lowerGnetin the highpCO2treatments
for the three experiments could have resulted from either a decrease in gross calcification, an increase in calcium car-bonate dissolution, or a combination of both. The constant offset (i.e., difference in elevation of the response) between
Gnetunder ambient and highpCO2at any given PAR
sug-gests the effect cannot be accounted for solely by changes in gross calcification (Ggross). Indeed, if only Ggross were
af-fected by highpCO2, a proportional effect on Gnet would
be expected, with the reduction ofGnetassociated with high
pCO2varying withGgrossand, therefore, PAR. In contrast, if
dissolution and bioerosion, which are mostly chemically and mechanically driven (Andersson and Gledhill, 2013), were responsible for the reducedGnet at highpCO2, it is likely
that PAR would have only a small influence inGnet. Thus,
it is likely that increasing dissolution and chemical bioero-sion in the highpCO2treatment caused most of the observed
decreases inGnet. However, the method used in the present
study (the alkalinity anomaly technique) did not permit quan-tification of mechanical bioerosion, which could also be af-fected by OA (Enochs et al., 2016).
Although the two coral reef communities studied in Mo’orea differed in substratum composition (i.e., with sand present in the back reef versus pavement in the outer reef, and differences in coral cover), community structure, and the quality and quantity of light applied (i.e., blue-biased at depth, and a 40 % reduction in intensity at 17 m versus 2 m depth), both communities exhibited a 50–60 % decline inGnet at 1300 µatm pCO2. In contrast, meanGnetfor the
O’ahu back reef community was less affected bypCO2than
for the communities of Mo’orea. The reduced sensitivity of
Gnet to ∼1200 µatm pCO2 for back reef communities in
O’ahu may reflect different sediment composition and legacy effects associated with environmental conditions in the bay from which the organisms and sediment were collected. Crit-ically, the organisms for the O’ahu experiment were col-lected from K¯ane’ohe Bay where seawater pCO2 (up to ∼450–500 µatm) is higher than current atmospheric levels (∼400 µatm) because of heterotrophy and calcification (Fa-gan and Mackenzie, 2007; Drupp et al., 2011). K¯ane’ohe Bay is also affected by strong diurnal cycles inpCO2and rapid
changes inpCO2 during storm events (Fagan and
Macken-zie, 2007; Drupp et al., 2011). These conditions potentially could have created the opportunity for physiological acclima-tization or local adaptation that might reduce their sensitivity to highpCO2in the experimental trials.
The relationship between community Pnet and Gnet is
commonly used as a measure of the coral reef “state” (Gat-tuso et al., 1999; Lantz et al., 2014), with coral reefs domi-nated by high coral cover and low cover of macroalgae char-acterized by elevated slopes of thePnet−Gnet relationship. In the present study, the slopes of the relationships between
Pnet andGnet in the ambient treatment were between 0.14 (O’ahu) (this and all following slope values have units of mmol CaCO3mmol O−21)and 0.27 (Mo’orea fore reef). In
Mo’orea, the slopes were higher for the fore reef (0.27 and 0.30) versus the back reef (0.17 and 0.18) community, which demonstrated thatGnetwas more sensitive to changes inPnet
in fore reef communities, probably because of a higher cover of calcifiers. The slopes of thePnet–Gnetrelationships for the
re-3558 S. Comeau et al.: Daily variation in net primary production and net calcification in coral reef communities
cently, Shaw et al. (2012) reported aPnet–Gnetslope of 0.24 for the reef flat of Lady Elliot Island, Australia, and a slope of 0.14 was reported for Ningaloo Reef, Australia (Falter et al., 2012). The consistency between the slopes reported herein, and values determined in situ (e.g., Shaw et al., 2012; Gat-tuso et al., 1999), suggest that our constructed communities, and the conditions to which they were exposed, reproduced conditions found in situ on coral reefs. This outcome lends support to the inferences we are able to make regarding the response of reef communities to elevatedpCO2, for which
currently there are no in situ data.
Our results are consistent with the hypothesis that OA will affect the relationship between communityPnetandGnet
(sensu Gattuso et al., 1999) because intercepts of thePnet–
Gnetrelationships varied between treatments and were more elevated under ambient pCO2. The absence of changes in
slopes as a function ofpCO2probably was due to the lack
of a pCO2 effect onPnetand the lack of a PAR–pCO2
in-teractive effect on Pnet andGnet. Furthermore, the
commu-nity composition remained the same in the ambient and el-evated pCO2 conditions, with no mortality or loss of
ben-thic cover of living organisms during the course of the exper-iment, which could potentially have modified the commu-nity Pnet–Gnet relationship (Lantz et al., 2014; Shaw et al.,
2015) due to taxon-specificPnet–Gnetrelationships (Page et
al., 2016). Thus, this result indicates that elevated CO2alone
(e.g., without considering global warming) can modify the balance between calcification and photosynthesis at the scale of a whole reef, because of a decrease in coral reef commu-nity calcification while photosynthesis remains constant.
Data availability. All the data presented in the manuscript were deposited in the PANGAEA database and will be available at: https://www.pangaea.de/?q=Comeau&f.author%5B%5D=Comeau %2C+Steeve.
The Supplement related to this article is available online at https://doi.org/10.5194/bg-14-3549-2017-supplement.
Competing interests. The authors declare that they have no conflict of interest.
Acknowledgements. We thank Ruth D. Gates and Holly M. Putnam for access to the infrastructure of HIMB and laboratory assistance in Hawaii. This study was funded by the National Science Foun-dation (OCE 10-41270 and 14-15268) and the Mo’orea Coral Reef LTER (OCE 04-17413 and 10-26852). This is contribution number 235 of the CSUN Marine Biology Program. S. Comeau was supported by ARC (Discovery Early Career Researcher Award; DE160100668) during the writing of the manuscript.
Edited by: Jack Middelburg
Reviewed by: two anonymous referees
References
Anthony, K. R., Kline, D. I., Diaz-Pulido, G., Dove, S., and Hoegh-Guldberg, O.: Ocean acidification causes bleaching and produc-tivity loss in coral reef builders, P. Natl. Acad. Sci., 105, 17442– 17446, 2008.
Andersson, A. J. and Gledhill, D.: Ocean acidification and coral reefs: effects on breakdown, dissolution, and net ecosystem cal-cification, Annu. Rev. Mar. Sci., 5, 321–348, 2013.
Atkinson, M. J., Kotler, E., and Newton, P.: Effects of water velocity on respiration, calcification, and ammonium uptake of aPorites compressacommunity, Pac. Sci., 48, 296–303, 1994.
Borowitzka, M. A.: Photosynthesis and calcification in the articu-lated coralline red algaeAmphiroa ancepsandA. foliacea, Mar. Biol., 62, 17–23, 1981.
Britton, D., Cornwall, C. E., Revill, A. T., Hurd, C. L., and Johnson, C. R.: Ocean acidification reverses the positive effects of seawa-ter pH fluctuations on growth and photosynthesis of the habitat-forming kelp, Ecklonia radiata, Scientific Reports, 6, 26036, https://doi.org/10.1038/srep26036, 2016.
Brown, B. E., Ambarsari, I., Warner, M. E., Fitt, W. K., Dunne, R. P., Gibb, S. W., and Cummings, D. G.: Diurnal changes in pho-tochemical efficiency and xanthophyll concentrations in shallow water reef corals?: evidence for photoinhibition and photoprotec-tion, Coral Reefs, 18, 99–105, 1999.
Carpenter, R. C. and MCR LTER: Coral Reef: Benthic Pho-tosynthetically Active Radiation (PAR), ongoing since 2009, knb-lter-mcr.4005.8 https://doi.org/10.6073/pasta/ ea06e6d53df8b1cdf7c1d50d025b77fd, 2016.
Chalker, B. E.: Simulating light-saturation curves for photosynthe-sis and calcification by reef-building corals, Mar. Biol., 63, 135– 141, 1981.
Chalker, B. E., Barnes, D. J., Dunlap, W. C., and Jokiel, P. L.: Light and reef-building corals, Interdiscipl. Sci. Rev., 13, 222– 237, 1988.
Chisholm, J. R. M.: Calcification by crustose coralline algae on the northern Great Barrier Reef, Australia, Limnol. Oceanogr., 45, 1476–1484, 2000.
Chisholm, J. R. M. and Gattuso, J.-P.: Validation of the alkalinity anomaly technique for investigating calcification of photosyn-thesis in coral reef communities, Limnol. Oceanogr., 36, 1232– 1239, 1991.
Comeau, S. and Cornwall, C. E.: Contrasting effects of ocean acidification on coral reef “animal forests” versus sea-weed “kelp forests”, in: Marine Animal Forests, Springer, https://doi.org/10.1007/978-3-319-17001-5_29-1, 2016. Comeau, S., Edmunds, P. J., Spindel, N. B., and Carpenter, R. C.:
The responses of eight coral reef calcifiers to increasing par-tial pressure of CO2 do not exhibit a tipping point, Limnol.
Oceanogr., 58, 388–398, 2013.
Comeau, S., Edmunds, P. J., Spindel, N. B., and Carpenter, R. C.: DielpCO2oscillations modulate the response of the coral Acrop-ora hyacinthusto ocean acidification, Mar. Ecol.-Prog. Ser., 501, 99–111, 2014.
Comeau, S., Carpenter, R. C., Lantz, C. A., and Edmunds, P. J.: Ocean acidification accelerates dissolution of experi-mental coral reef communities, Biogeosciences, 12, 365–372, https://doi.org/10.5194/bg-12-365-2015, 2015.
Comeau, S., Carpenter, R. C., and Edmunds, P. J.: Effects of
sclerac-tinian corals and calcified algae, ICES J. Mar. Sci., fsv267, https://doi.org/10.1093/icesjms/fsv267, 2016a.
Comeau, S., Lantz, C. A., Edmunds, P. J., and Carpenter, R. C.: Framework of barrier reefs threatened by ocean acidification, Global Change Biol., 22, 1225–1234, 2016b.
Connell, S. D. and Russell, B. D.: The direct effects of increasing CO2 and temperature on non-calcifying organisms: increasing
the potential for phase shifts in kelp forests, P. Roy. Soc. B, 277, 1409–1415, 2010.
Connell, S. D., Kroeker, K. J., Fabricius, K. E., Kline, D. I., and Russell, B. D.: The other ocean acidification prob-lem: CO2 as a resource among competitors for ecosys-tem dominance, Philos. T. Roy. Soc. B, 368, 20120442, https://doi.org/10.1098/rstb.2012.0442, 2013.
Diaz-Pulido, G., Cornwall, C., Gartrell, P., Hurd, C., and Tran, D. V.: Strategies of dissolved inorganic carbon use in macroal-gae across a gradient of terrestrial influence: implications for the Great Barrier Reef in the context of ocean acidifica-tion, Coral Reefs, 35, 1327, https://doi.org/10.1007/s00338-016-1481-5, 2016.
Dickson, A. G., Sabine, C. L., and Christian, J. R.: Guide to best practices for ocean CO2measurements, PICES Special
Publica-tion 3, 191 pp., 2007.
Dove, S. G., Kline, D. I., Pantos, O., Angly, F. E., Tyson, G. W., and Hoegh-Guldberg, O.: Future reef decalcification under a business-as-usual CO2 emission scenario, P. Natl. Acad. Sci.,
110, 15342–15347, 2013.
Drupp, P., DeCarlo, E. H., Mackenzie, F. T., Bienfang, P., and Sabine, C. L.: Nutrient inputs, phytoplankton response, and CO2
variations in a semi-enclosed subtropical embayment, Kaneohe Bay, Hawaii, Aquat. Geochem., 17, 473–498, 2011.
Dufault, A. M., Ninokawa, A., Bramanti, L., Cumbo, V. R., Fan, T.-Y., and Edmunds, P. J.: The role of light in mediating the effects of ocean acidification on coral calcification, J. Exp. Biol., 216, 1570–1577, 2013.
Enochs, I. C., Manzello, D. P., Carlton, R., Schopmeyer, S., Van Hooidonk, R., and Lirman, D.: Effects of light and elevated
pCO2on the growth and photochemical efficiency ofAcropora cervicornis, Coral Reefs, 33, 477–485, 2014.
Enochs, I. C., Manzello, D. P., Kolodziej, G., Noonan, S. H. C., Valentino, L., and Fabricius, K. E.: Enhanced mac-roboring and depressed calcification drive net dissolution at high-CO2 coral reefs, P. R. Soc. B, 283, 20161742,
https://doi.org/10.1098/rspb.2016.1742, 2016.
Fagan, K. E. and Mackenzie, F. T.: Air – sea CO2 exchange in
a subtropical estuarine-coral reef system, Kaneohe Bay, Oahu, Hawaii, Mar. Chem., 106, 174–191, 2007.
Falter, J. L., Lowe, R. J., Atkinson, M. J., and Cuet, P.: Sea-sonal coupling and de-coupling of net calcification rates from coral reef metabolism and carbonate chemistry at Ninga-loo Reef, Western Australia, J. Geophys. Res., 117, C05003, https://doi.org/10.1029/2011JC007268, 2012.
Feely, R. A., Sabine, C. L., Lee, K., Berelson, W., Kleypas, J., Fabry, V. J., and Millero, F. J.: Impact of anthropogenic CO2 on the
CaCO3system in the oceans, Science, 305, 362–366, 2004.
Gattuso, J.-P. and Hansson, L.: Ocean acidification: background and history, Ocean acidification, Oxford University Press, 1–20, 2011.
Gattuso, J.-P., Allemand, D., and Frankignoulle, M.: Photosynthesis and calcification at cellular, organismal and community levels in coral reefs: a review on interactions and control by carbonate chemistry, Amer. Zool., 39, 160–183, 1999.
Gattuso, J.-P., Epitalon, J.-M., and Lavigne, H.: seacarb: Seawater carbonate chemistry, R package version 3.0.6., available at: http: //CRAN.R-project.org/package=seacarb (last access: 1 October 2016), 2015.
Giordano, M., Beardall, J., and Raven, J. A.: CO2 concentrating
mechanism in algae: mechanisms, environmental modulation, and evolution, Annual Rev. Plant Biol., 56, 99–131, 2005. Hepburn, C. D., Pritchard, D. W., Cornwall, C. E., McLeod, R. J.,
Beardall, J., Raven, J. A., and Hurd, C. L.: Diversity of carbon use strategies in a kelp forest community: implications for a high CO2ocean, Global Change Biol., 17, 2488–2497, 2011.
Hofmann, G. E., Smith, J. E., Johnson, K. S., Send, U., Levin, L. A., Micheli, F., Paytan, A., Price, N. N., Peterson, B., Takeshita, Y., Matson, P. G., Crook, E. D., Kroeker, K. J., Gambi, M. C., Rivest, E. B., Frieder, C. A., Yu, P. C., and Martz, T. R.: High-frequency dynamics of ocean pH: a multi-ecosystem comparison, PLoS One, 6, e28983, https://doi.org/10.1371/journal.pone.0028983, 2011.
Jokiel, P. L., Jury, C. P., and Ku’ulei, S. R.: Coral-algae metabolism and diurnal changes in the CO2-carbonate system of bulk sea
water, PeerJ, 2, e378, https://doi.org/10.7717/peerj.378, 2014. Jokiel, P. L., Rodgers, K. S., Brown, E. K., Kenyon, J. C., Aeby,
G., Smith, W. R., and Farrell, F.: Comparison of methods used to estimate coral cover in the Hawaiian Islands, PeerJ, 3, e954, https://doi.org/10.7717/peerj.954, 2015.
Kroeker, K. J., Kordas, R. L., Crim, R., Hendriks, I. E., Ramajo, L., Singh, G. S., Duarte, C. M., Gattuso, J.-P: Impacts of ocean acidification on marine organisms: quantifying sensitivities and interaction with warming, Global Change Biol., 19, 1884–1896, 2013.
Langdon, C. and Atkinson, M. J.: Effect of elevated pCO2 on photosynthesis and calcification of corals and inter-actions with seasonal change in temperature/irradiance and nutrient enrichment, J. Geophys. Res., 110, C09S07, https://doi.org/10.1029/2004JC002576, 2005.
Langdon, C., Broecker, W. S., Hammond, D. E., Glenn, E., Fitzsim-mons, K., Nelson, S. G., Peng, T.-H., Hajdas, I., Bonani, G.: Effect of elevated CO2 on the community metabolism of an
experimental coral reef, Global Biogeochem. Cy., 17, 1011, https://doi.org/10.1029/2002GB001941, 2003.
Lantz, C. A., Atkinson, M. J., Winn, C. W., and Kahng, S. E.: Dis-solved inorganic carbon and total alkalinity of a Hawaiian fring-ing reef: chemical techniques for monitorfring-ing the effects of ocean acidification on coral reefs, Coral Reefs, 33, 105–115, 2014. Leclercq, N., Gattuso, J.-P., and Jaubert, J.: Primary production,
respiration, and calcification of a coral reef mesocosm under in-creased CO2partial pressure, Limnol. Oceanogr., 47, 558–564, 2002.
Mackey, K. R. M., Morris, J. J., Morel, F. M. M., and Kranz, S. A.: Response of photosynthesis to ocean acidification, Oceanogr., 28, 74–91, 2015.
3560 S. Comeau et al.: Daily variation in net primary production and net calcification in coral reef communities
Marubini, F., Ferrier-Pagès, C., Furla, P., and Allemand, D.: Coral calcification responds to seawater acidification: a working hy-pothesis towards a physiological mechanism, Coral Reefs, 27, 491–499, 2008.
Moss, R. H., Edmonds, J. A., Hibbard, K. A., Manning, M. R., Rose, S. K., Van Vuuren, D. P., Carter, T. R., Emori, S., Kainuma, M., Kram, T., Meehl, G. A., Mitchell, J. F. B., Nakicenovic, N., Riahi, K., Smith, S. J., Stouffer, R. J., Thomson, A. M., Weyant, J. P., and Wilbanks, T. J.: The next generation of scenarios for climate change research and assessment, Nature, 463, 747–756, 2010. Muscatine, L.: The role of symbiotic algae in carbon and energy flux
in reef corals, in: Coral Reefs, Ecosystems of the World, edited by: Dubinsky, Z., Elsevier, Amsterdam, 75–87, 1990.
Muscatine, L., Goiran, C., Land, L., Jaubert, J., Cuif, J.-P., and Alle-mand, D.: Stable isotopes (δ13C andδ15N) of organic matrix from coral skeleton, P. Natl. Acad. Sci., 102, 1525–1530, 2005. Okazaki, R. R., Towle, E. K., van Hooidonk, R., Mor, C., Winter,
R. N., Piggot, A. M., Cunning, R., Baker, A. C., Klaus, J. S., Swart, P. K., and Langdon, C.: Species-specific responses to cli-mate change and community composition determine future cal-cification rates of Florida Keys reefs, Global Change Biol., 23, 1023–1035, https://doi.org/10.1111/gcb.13481, 2016.
Page, H. N., Andersson, A. J., Jokiel, P. L., Rodgers, K. S., Le-brato, M., Yeakel, K., Davidson, C., D’Angelo, S., and Bahr, K. D.: Differential modification of seawater carbonate chemistry by major coral reef benthic communities, Coral Reefs, 35, 1311– 1325, 2016.
Raven, J. A., Beardall, J., and Giordano, M.: Energy costs of carbon dioxide concentrating mechanisms in aquatic organisms, Photo-synth. Res., 121, 111–124, 2014.
Schoepf, V., Grottoli, A. G., Warner, M. E., Cai, W.-J., Melman, T. F., Hoadley, K. D., Pettay, D. T., Hu, X., Li, Q., Xu, H., Wang, Y., Matsui, Y., and Baumann, J. H.: Coral energy reserves and calci-fication in a high-CO2world at two temperatures. PLoS One, 8,
e75049, https://doi.org/10.1371/journal.pone.0075049, 2013.
Schoepf, V., Hu, X., Holcomb, M., Cai, W.-J., Li, Q., Wang, Y., Xu, H., Warner, M. E., Melman, T. F., Hoadley, K. D., Pettay, D. T., Matsui, Y., Baumann, J. H., and Grottoli, A. G.: Coral calcifi-cation under environmental change: a direct comparison of the alkalinity anomaly and buoyant weight techniques, Coral Reefs, 36, 13–25, https://doi.org/10.1007/s00338-016-1507-z, 2017.
Shaw, E. C., McNeil, B. I., and Tilbrook, B.:
Im-pacts of ocean acidification in naturally variable coral reef flat ecosystems, J. Geophys. Res., 117, C03038, https://doi.org/10.1029/2011JC007655, 2012.
Shaw, E. C., Phinn, S. R., Tilbrook, B., and Steven, A.: Natural in situ relationships suggest coral reef calcium carbonate produc-tion will decline with ocean acidificaproduc-tion, Limnol. Oceanogr., 60, 777–788, 2015.
Schneider, K. and Erez, J.: The effect of carbonate chemistry on calcification and photosynthesis in the hermatypic coral Acrop-ora eurystoma, Limnol. Oceanogr., 51, 1284–1293, 2006. Stambler, N.: Zooxanthellae: the yellow symbionts inside animals,
in: Coral Reefs: An Ecosystem in Transition, edited by: Dubin-sky, Z. and Stambler, N., Springer, Berlin, Germany, 2011. Suggett, D. J., Dong, L. F., Lawson, T., Lawrenz, E., Torres, L., and
Smith, D. J.: Light availability determines susceptibility of reef building corals to ocean acidification, Coral Reefs, 32, 327–337, 2013.