Phosphorus
and calcium carbonate
solubilities
in
Lake Kinneret
Yoram Avnimelech
Technion-Israel Institute of Technology, Tcchnion City, Haifa 32000
Ahs truct
Phosphate and calcium carbonate solubilities were calculated from data obtained for ncar- bottom water samples from Lake Kinneret during the years 1975-1977. A potential diagram technique was used to determine which solid phase is in equilibrium with the solution.
Both phosphorus and calcium carbonate solubilities arc controlled, during the January- August period, through equilibrium with calcium-carbonate-phosphate, Ca3(HCO:,):3P0,. The calcium carbonate ionic product changes, depending on the phosphoric acid potential, during this period. The solubility product, (Ca2+)3 x (HC03-)3 x (POd3-) is 10-2s.“. Calcium carbonate
activity is constant ( 10-8*56) during the last months of the stratified period (September-De- cembcr).
These findings support the hypothesis that the first and most reactive product of the reac- tions occurring between CaCO, and phosphorus is a CaCO,H,,PO, surface complex.
Phosphorus is a major nutrient regulat-
ing algal growth in lakes (Vollenweider
1968) and specifically in Lake Kinneret
(Serruya and Berman 1975). The supply
of phosphorus to water bodies depends
to a large extent on the solubility of phos-
phorus found in sediments and in sus-
pcndcd inorganic particles. However, no
clear agreement between a given solu-
bility product and soluble phosphorus
concentration has been found, probably
due to the complex system involved.
Syers et al. (1973, p. 3) concluded that “It
is difficult, if not impossible, however, to
take the finding obtained with pure sys-
tems in the laboratory and solubility pre-
dictions based on thermodynamics and to
extrapolate these to the extremely com-
plex environment in lake sediments .”
Most attempts to study the solubility of
phosphorus in lakes or lake sediments
have been based on the comparison of
ionic products in the lake with those of
well defined crystalline phosphatic
species (Sycrs et al. 1973; Emerson and
Widmer 1978). However, mixed crystals
or surface complexes of phosphorus arc
probably common in lakes. For example,
it has been suggested that mixed ferric-
hydroxo-phosphates precipitate in many
natural lake waters (Morgan and Stumm
1965), and that phosphorus is adsorbed
on hydrous ferric oxide colloids (Lee
1970) and is possibly chcmisorbed on
CaCO,,, forming a surface complex that is
later transformed into crystalline apatite
(Stumm and Leckie 1971). Such com-
pounds are usually poorly crystallized OI
present as surf&e complexes. Crystallo-
graphic study of them is difficult and their
presence may be elucidated mainly
through solubility functions.
Avnimelech (1980) showed that the re-
action between dilute orthophosphate so-
lutions and CaCO, cannot be attributed
to the formation of any distinct calcium
phosphate but that a surface complex
WHCQM04 is formed. This complex,
having a defined solubility behavior, is
probably kinetically favored over apatites
and thus could be of importance in con-
trolling phosphorus concentration in lake
waters.
Lake Kinneret is essentially a &CO,
system, The lake sediments contain up to 50% CaCO, (S erruya 1971) and the waters
are hard (4.5-5.2 meym liter-l as Ca2+, 225-
260 mg. liter-l as CaCO,) and alkaline (2-
2.4 meq. liter--l, loo-120 mg. liter-l as
CaCO,) (Scrruya 1978). Interaction of
phosphorus with CaCO, seems to be the
dominant factor controlling phosphorus
concentration under such conditions. I
used data available for the water com-
position in Lake Kinneret to compute the
appropriate solubility parameters and to
test the hypothesis that phosphorus con-
centrations in the bottom water are de-
641
termined by the solubility product of the
calcium-carbonate-phosphate or other
solid phases. I thank C. Serruya and T. P.
Murphy for comments and M. Gophen for
making the data available.
Muterials and methods
The data used here were provided by
the Lake Kinneret Limnological Labora-
tory. Data for the period January 1975 till
December 1977 at the deepest water
sampling depth in station A (42 m) are
used. Samples were taken weekly 1.5 m
above the bottom (Serruya et al. 1974).
Analyses were carried out according to
standard methods (Am. Public Health As-
soc. 1971). Ionic distribution in the so-
lution was computed from constants for
the orthophosphoric and carbonic acids
and the stability constants for the ionic
pairs CaHPOdO, Ca( H2P04)+ (Gregory et
al. 1970), CaCO,O, Ca( HCO,)+ (Nakayama
1968), and CaOH+ (Gimblett and Monk
1959). Activity coefficients were calculat-
ed with the extended Debye-Huckel
equation, using an estimate for the ionic
strength from the measured electrical
conductivity of the water (Griffin and Jur-
inak 1973). Phosphoric acid, calcium hy-
droxide, and calcium carbonate poten-
tials are taken as the negative logarithms
of (H+)” x (POd3-), ( Ca2+) x (OH-)2, and
(Ca2+) x (C0,2-), where values in paren-
theses represent activities.
Avnimelech (1980) assumed the for-
mation of a calcium-carbonate-phosphate
surface complex, Caz(HCO,),PO,, in
CaCO,-H,PO,-H,O systems. The rcac-
tion between the reacting electroneutral
components can be formulated as
3 CaCO,(l) + H,PO,(l)
+ Ca,( HCO&PO,( s). (1)
The two reacting components, CaCO, and
HtsP04, are taken as reacting electroneu-
tral species in the solution. The selection
of electroneutral species rather than that
of the reacting ionic species is conven-
tional (e.g. Lindsay 1979) and is advan-
tageous because of the avoidance of extra
thermodynamic functions,
At equilibrium, the chemical potentials
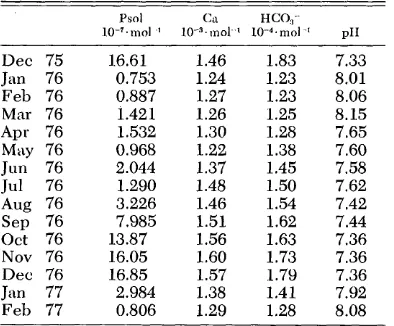
T&k 1. Soluble phosphorus and related param- etcrs in water overlying the sediment (monthly av- eragcs).
Psol Gl HCO;- 1o-‘~nlol ’ IfF~mol ’ 1W~rnol ’ PII
Dee 75 1.6.61 1.46 1.83 7.33
J an 76 0.753 1.24 1.23 8.01 Feb 76 0.887 1.27 1.23 8.06 Mar 76 1.421 1.26 1.25 8.15 Apr 76 1.532 1.30 1.28 7.65 May 76 0.968 1.22 1.38 7.60 Jun 76 2.044 1.37 1.45 7.58 Jul 76 1.290 1.48 1.50 7.62 Aug 76 3.226 1.46 1.54 7.42 Sep 76 7.985 1.51 1.62 7.44 Ott 76 13.87 1.56 1.63 7.36 Nov 76 16.05 1.60 1.73 7.36 Dee 76 16.85 1.57 1.79 7.36
J an 77 2.984 1.38 1.41 7.92 Feb 77 0.806 1.29 1.28 8.08
of the reacting components (pi) can be
related through Eq. 2:
3pCaC0, + pII,P04 = F” solid (2)
or
3 ln(CaCO,,) + ln(H,PO,) = constant (3)
(where the values in parentheses repre-
sent the activities of the given compo-
nents). If the solution composition is
determined by the solubility of the above-
mentioned complex, logarithms of H,PO,
activities plotted against those of C&O,
activities should follow a straight line with
a slope of -3. Similarly, if hydroxyapatite
is the phase controlling the phosphorus
concentration, a plot of log(H,,PO,) vs.
log[Ca(OH),] should yield a straight line with a slope of 1.67.
Results
Monthly average values for phos-
phorus, calcium, alkalinity, and pII in the
filtered water samples for the period De-
cember 1975-February 1977 are given in
Table 1. A rapid decrease in soluble P,
Ca, and alkalinity, and an increase in pH
occur after turnover (January). When the
lake stratifies again (March), levels of
these components are built up slowly,
reaching a peak during fall (October-De-
[image:2.499.256.453.104.267.2]36.
B In35
27 -i
34
33,
O’\O 0 -January -August I+
I! cF
- -lag CaCQ = 8.56 o\: 0
OP” l 0 b $8
.
A
I 1 I
a a.5 0 9
-log taco,
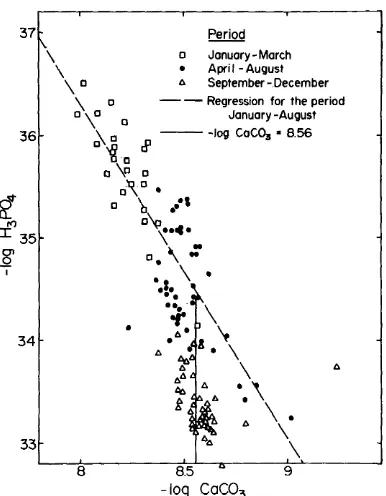
Fig. 1. H,PO, potentials as a function of CaCO, potentials in Lake Kinneret bottom water samples.
iere (Serruya
scribed in detail elsewl
1978).
The data in Table 1 can he grouped in
three periods: the mixed period, Janu-
ary-March, when P, Ca, and HCO, are
low; a transition period (April-August)
when P, Ca, and HC09 increase and pH
decreases slowly; and the completely
stratified period (September-December)
when P, Ca, and alkalinity are high and
pH is lowest. A similar grouping can be
seen in Fig. 1, where phosphoric acid po-
tentials are plotted against calcium car-
bonate potentials. Data from the first
group-the mixed period points-define
a diagonal line, showing a dependence
between phosphoric acid and calcium
carbonate potentials. Data from the com-
pletely stratified period are grouped along
a vertical line indicating no dependence
between CaCO, and HsP04 potentials and
a constant CaCO, potential (8.563 +
0,081). The data of the transition period
are located mostly at the intersection of
these two lines, The relationship be-
tween the HRP04 and &CO, potentials
for the mixed period is given by
-log H,PO, = A - B(-log CaCO,). (4)
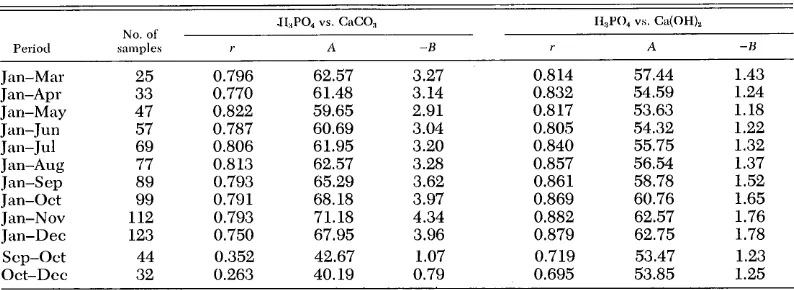
The parameters of this equation, tested
for different periods during the 3 years of
study are given in Table 2. The slope of
the logarithmic dependence is very close
to the expected value, -3, all along the
period from January to August. The
regression coefficients are high and the
intercept, A, which is a function of the
solubility constant, is fairly uniform.
When data from the completely stratified
period (September-December) are in-
cluded in the regression, variability in-
creases and the slope is rising, up to
-4.34. These last data, treated separate- ly, do not agree with the model tested.
The potential diagram relating the po-
tentials of H3P04 to those of Ca(OH), is
given in Fig. 2. The seasonal effect is less clear here, yet it is obvious that the data
of the completely stratified period de-
viate from the line defined by the rest of
the points. The relations between the
H,PO, and the Ca(OH), potentials are
given in the last three columns of Table
2. Examination of this table results in
conclusions somewhat similar to those ar-
rived at for the dependence with C&O,
potential. The slope of the logarithmic
dependence between the phosphoric acid
and the Ca(OH), potentials is fairly con-
stant, about - 1.3, for the period January-
August. Inclusion of the late summer data
raises the slope up to -1.78, yet, if the
latter data are treated separately, a slope
of -1.23-1.25 is obtained.
Discussion
The solubility behavior of phosphorus
in the water overlying the sediment in
Lake Kinneret was considered using two
possible mechanisms: control of solubil-
ity by a calcium-carbonate-phosphate sol-
id phase and control of solubility by a cal-
cium phosphate solid phase. Solubility
considerations are used here to test these
mechanisms.
The agreement between the data and
the first mechanism is good for the period
[image:3.506.53.246.73.321.2]P und CaCO, solubility
Table 2. Linear regression matrixes for the equations: pHSPO, -k A - B pCaCO,, and pIIsPO, + A - B pCa(OH),.
Period
No. of ,snmple.s
.II:,PO, vs. CaCO, II,P04 VS. Ca(OH),
, A -H r A -13
I Jan-Mar 25 0.796 62.57 3.27 0.8 14 57.44 1.43
Jan-Apr 33 0.770 61.48 3.14 0.832 54.59 1.24
Jan-May 47 0.822 59.65 2.91 0.817 53.63 1.18
Jan- Jun 57 0.787 60.69 3.04 0.805 54.32 1.22 Jan- Jul 69 0.806 61.95 3.20 0.840 55.75 1.32 Jan-hug 77 0.8 13 62.57 3.28 0.857 56.54 1.37 Jan-&p 89 0.793 65.29 3.62 0.861 58.78 1.52
Jan-Ott 99 0.791 68.18 3.97 0.869 60.76 1.65
Jan-Nov 112 0.793 71.18 4.34 0.882 62.57 1.76 Jan-Dee 123 0.750 67.95 3.96 0.879 62.75 1.78
Scp-Ott 44 0.352 42.67 1.07 0.719 53.47 1.23
Ott-Dee 32 0.263 40.19 0.79 0.695 53.85 1.25
lishment of complete stratification. The
slope of the relationship between the po-
tentials of phosphoric acid and those of
calcium carbonate is close to -3, in
agreement with the hypothesis that the
solid phase controlling the solubility is
Ca,(HCO,,),PO,. The solubility of this
phase is somewhat higher than that
found in laboratory experiments (Avni-
melech 1980). The ionic product
( Ca2+)“( HC03-)3( POd3-) was lo-” l** in the
laboratory experiments and 10-2R*5 for the
lake water (calculated for the period Jan-
uary-August). This differcncc could be
due to poorer crystallization in the lake
than in the laboratory equilibration ex-
periments. The variation of the &CO,
activity as a function of the HtjP04 activ-
ity is in agreement with this first hypoth-
esis. Calcium carbonate activity [( Ca2+).
(CO,“-)] is equivalent to the ionic prod-
uct of calcium carbonate and is usually
considered to be constant [p7c, +8.31 (Na-
kayama 1968) to 8.42 (Lindsay 1979)].
This was not the case during most of the
year. Calcium carbonate activity was not
constant and depended on the phospho-
ric acid potential. The product of the
&CO, and H,,PO, activities rather than
the CaCO, activity tended to be constant,
as expected for systems controlled
through the solubility of Ca,(HCO,),PO,.
This dependence did not occur during the
completely stratified period, when the
CaCO, activity was almost constant and
very close to the solubility product of
CaCO,. The different behavior of the
water overlying the sediment during the
completely stratified period could be due
to the specific composition of the water
at that time, i.e. lack of oxygen, low pH,
high iron (Serruya 1978), or to a lack of
equilibrium with the sediment during that
period, Serruya et al. (1974) found that
the sediment does not mix with the over-
lying water during this period, although
it does during the rest of the year. It seems
that the water sampled 1.5 m above the
bottom is not in equilibrium with the
&CO,-rich sediment or that P solubility
is controlled by Fe during the stratified
period. The significant dependence of the
phosphoric acid potentials on the Ca( OH),
potentials does indicate that the solution
composition is also controlled by a solu-
bility product of calcium phosphate solid
phase, the second mechanism tested here.
Avnimelech (1980) interpreted the de-
pendence of H3P0, potential on both
CaCO, and Ca(OH), potentials as im-
posed on the system when pC0, is con-
stant. Under such conditions, CaCO, and
Ca(OH), activities are linearly related.
This explanation does not hold in the
present study, where pC0, is certainly
not constant, being relatively low in the
mixed period and high in the stratified period.
Stumm and Leckie (1971) suggested
[image:4.487.46.443.89.234.2]t-1
‘\ \
\ \
h \
7---
---- -
T --
Period o January-March
l April -August
A September-December
l .
. l
I .--.---A
15 16 17
-log Ca(OH),
Fig. 2. As Fig. 1, but of Ca(OH), potentials. Dashed line-hydroxyapatitc solubility isotherm.
sorbed on calcium carbonate particles and
recrystallized to form hydroxyapatite
crystals. It is plausible according to phase
rule considerations that the solution will
be controlled by both solid phases: cal-
cium-carbonate-phosphate and calcium
phosphate. Four components-H,O,
HsP04, H2COn, and Ca(OH),-and two
solid phases in equilibrium with the
aqueous phase are involved in this sys-
tem. If we assume that pressure and tem- perature are constant, we still have 1 df
enabling a change along the solubility
line. The two solid phases that seemingly
are in equilibrium with the water are cal-
cium-carbonate-phosphate and calcium
phosphate during the winter and spring
periods, while calcium carbonate and
calcium phosphate seem to control the
system during late summer. There seem
to be two alternatives for the exact nature
of the calcium phosphate in equilibrium
with the water. One is hydroxyapatite, as
suggested by Stumm and Leckie (1971)
and the other is octacalcium phosphate.
The data points plotted in the H,P04-
Ca(OH), potential diagram (Fig. 2) are
very close to the line defined by the hy-
droxyapatite solubility product (Avnime-
lech et al. 1973). The octacalcium phos-
phate has a higher solubility in this range,
However, the slope of the H,PO,-Ca(OH),
potential (Fig. 2 and Table 2), being close
to 1.3, is in agreement with the existence
of octacalcium phosphate, (OCP),
C~&WU~, rather than hydroxyapatite.
Octacalcium phosphate is more readily
crystallized and thus was found to be an
important intermediate calcium phos-
phate in solutions, soils, and biological
systems (Brown et al. 1962). It is thus
plausible that it would also play an im-
portant role in lakes. The nature of the
calcium phosphate phases as well as the
properties of the calcium-carbonate-
phosphate have to be studied further,
possibly by more direct crystallographic
methods.
Conclusions
The application of potential diagrams
and the consideration of complex, or
mixed, phosphates improve our ability to
understand the equilibrium between the
solid phase and aqueous orthophos-
phates in lakes. The evidence presented
here indicates that in Lake Kinneret this
equilibrium is controlled mainly by cal-
cium phosphate crystals formed in con-
junction with surface complex calcium-
carbonate-phosphate. The exact nature of
the calcium phosphate (hydroxyapatite or
octacalcium phosphate) and the effects of
environmental conditions on this equi-
librium deserve further study.
A solubility equilibrium will be effec-
tive in the water layer in contact with the
sediment. Phosphorus concentration in
the bulk of the water column will be af-
fected by other mechanisms such as
transfer from the lake bottom upward, up- take by algae, bacteria, and other organ-
isms, release of orthophosphate by bio-
logical activity and external supplies.
Nevertheless, understanding the prcdic-
tive ability of the equilibrium mecha-
nism is a prerequisite of any basic ap-
[image:5.491.43.240.69.325.2]P and CaCO, solubility
References
AMERICAN PUBLIC HEALTH ASSOCIATION. 1971. Standard methods for the examination of water and waste water, 13th cd.
AVNIMELECII, Y. 1980. Calcium-carbonate-phos- phate sulfate complex in calcareous sytems.
Nature 290: 255-257.
-, E. C. MORENO, AND W. E. BROWN. 1973. Solubility and surface properties of finely di- vided hydroxyapatite. Natl. Bur. Std. J. Res.
77A: 147-155.
BROWN, W. E., J. P. SMITH, J. R. LEHR, AND A. W. FRAZIER. 1962. Octacalcium phosphate and hydroxyapatite. Nature 196: 1048-1055. EMERSON, S., AND G. WIDMER. 1978. Early dia-
genesis in anaerobic lake sediments-2. Ther- modynamic and kinetic factors controlling the formation of iron phosphate. Gcochim. Cos- mochirn. Acta 42: 1307-1316.
GIMBLETT, F.G., AND C. B. MONK. 1959. E.M.F. studies of electrolyte dissociation 7: Some al- kali an d alkaline earth metals hydroxides in water. Trans. Faraday Sot. 50: 965-972. GREGORY, T.M.,E.C. MORENO,AND W.E.BHOWN.
1970. Solubility of CaIIPO, in the system Ca(OII),-H,PO,-II,0 at 5, 15, 25 and 37.5%. Natl. Bur. Std. J. Res. 74A: 461475.
GRIFFIN, R. A., AND J. J. JUFUNAK. 1973. Estima- tion of activity coefficients from the electrical conductivity of natural aquatic systems and soil extracts. Soil Sci. 116: 26-30.
LEE, G. F. 1970. Factors affecting the transfer of material between waste and sediments. Univ. Wis. Eutrophication Inform. Program. Occas. Pap. 1. 50 p.
LINDSAY, W. L. 1979. Chemical equilibrium in soils. Wiley.
MORGAN, J, J., AND W. STUMM. 1965. The role of multivalent metal oxides in limnological trans- formations as exemplified by iron and man- gancsc. Proc. 2nd Int. Water Pollut. Res. Conf. (Tokyo), p. 103-131.
NAKAYAU, F. S. 1968. Calcium activity, complex an d ion-pair in saturated CaCO, solutions. Soil Sci. 106: 429-434.
SERRUYA, C. 1971. Lake Kinneret: The nutrient chemistry of the sediments. Limnol. Oceanogr.
16: 510-521.
-. 1978. Water chemistry, p. 185-205, In C. Scrruya [ed.], Lake Kinneret. Junk.
-, AND T. BEIUAN. 1975. Phosphorus, nitro- gen and the growth of algae in Lake Kinneret. J. Phycol. 11: 155-162.
-, M. EDELSTEIN, V. POLLINGER,AND S.SER- RUYA. 1974. Lake Kinneret sediments: Nu- tricnt composition of the port water and mud water cxchangcs. Limnol. Oceanogr. 19: 489-
508.
STUMM, W., AND J. 0. LECKIE. 1971. Phosphate exchange with sediments: Its role in the pro- ductivity of surface water. Adv. Water Pollut. Res. 1970. Pap. 3-26, p. l-16. Pergamon. SYERS, J. K.,R.F. HARRIS,AND D.E. ARMSTRONG.
1973. Phosphate chemistry in lake sediments. J. Environ. Qual. 2: 1-14.
VOLLENWEIDER, 1~. A. 1968. Water management research. OECD Paris. DAS/CS1/68.27.
Submitted: 21 December 1981