www.biogeosciences.net/12/921/2015/ doi:10.5194/bg-12-921-2015
© Author(s) 2015. CC Attribution 3.0 License.
Long-term spatial and temporal variation of CO
2
partial pressure in
the Yellow River, China
L. Ran1, X. X. Lu1,2, J. E. Richey3, H. Sun4, J. Han4, R. Yu2, S. Liao5, and Q. Yi6 1Department of Geography, National University of Singapore, 117570, Singapore
2College of Environment & Resources, Inner Mongolia University, Hohhot, 010021, China 3School of Oceanography, University of Washington, Box 355351, Seattle, WA 98195-5351, USA 4Institute of Geology and Geophysics, Chinese Academy of Sciences, Beijing, 100029, China 5Tongguan Hydrographic Station, Yellow River Conservancy Commission, Tongguan, 714399, China 6Toudaoguai Hydrographic Station, Yellow River Conservancy Commission, Baotou, 014014, China
Correspondence to: X. X. Lu ([email protected])
Received: 2 September 2014 – Published in Biogeosciences Discuss.: 2 October 2014 Revised: 23 January 2015 – Accepted: 23 January 2015 – Published: 16 February 2015
Abstract. Carbon transport in river systems is an impor-tant component of the global carbon cycle. Most rivers of the world act as atmospheric CO2sources due to high
river-ine CO2partial pressure (pCO2). By determining thepCO2
from alkalinity and pH, we investigated its spatial and tem-poral variation in the Yellow River watershed using historical water chemistry records (1950s–1984) and recent sampling along the mainstem (2011–2012). Except the headwater re-gion where thepCO2was lower than the atmospheric
equi-librium (i.e. 380 µatm), river waters in the remaining water-shed were supersaturated with CO2. The averagepCO2for
the watershed was estimated at 2810±1985 µatm, which is 7-fold the atmospheric equilibrium. As a result of severe soil erosion and dry climate, waters from the Loess Plateau in the middle reaches had higher pCO2 than that from the upper
and lower reaches. From a seasonal perspective, the pCO2
varied from about 200 µatm to > 30 000 µatm with higher pCO2usually occurring in the dry season and lowerpCO2
in the wet season (at 73 % of the sampling sites), suggesting the dilution effect of water. While thepCO2responded
ex-ponentially to total suspended solids (TSS) export when the TSS concentration was less than 100 kg m−3, it decreased slightly and remained stable if the TSS concentration ex-ceeded 100 kg m−3. This stablepCO2is largely due to gully
erosion that mobilizes subsoils characterized by low organic carbon for decomposition. In addition, human activities have changed thepCO2dynamics. Particularly, flow regulation by
dams can diversely affect the temporal changes ofpCO2,
de-pending on the physiochemical properties of the regulated waters and adopted operation scheme. Given the highpCO2
in the Yellow River waters, large potential for CO2evasion
is expected and warrants further investigation.
1 Introduction
Rivers play a crucial role in the global carbon cycle, be-cause they can modulate the carbon dynamics not only of the watersheds but also of the coastal systems into which river waters are discharged (Aufdenkampe et al., 2011). Fluvial carbon export represents an important pathway linking land and the ocean. Approximately 0.9 Gt of carbon is delivered into the oceans per year via inland waters (Cole et al., 2007; Battin et al., 2009). However, rivers are not merely passive conduits. Evidence is accruing to indicate that, while only a small portion of carbon that enters a river network finally reaches the ocean, a considerable fraction would be buried within the river network or returned to the atmosphere en route (Yao et al., 2007; Wallin et al., 2013). Consequently, rivers are viewed as sources of atmospheric carbon dioxide (CO2)(Cole et al., 2007; Butman and Raymond, 2011).
Figure 1. Location map of the sampling sites in the Yellow River watershed. Acronyms for the mainstem dams: LYX – Longyangxia since 1986; LJX – Liujiaxia since 1968; QTX – Qingtongxia since 1968; WJZ – Wanjiazhai since 1998; SMX – Sanmenxia since 1960; and XLD – Xiaolangdi since 2000.
budget (Melack, 2011). For example, Richey et al. (2002) show that CO2emission in the Amazon River basin is an
or-der of magnitude greater than fluvial export of organic carbon to the ocean.
Decomposition of terrestrially derived organic carbon and aquatic respiration are the primary sources of river-ine CO2 (Humborg et al., 2010). As an important
parame-ter in estimating CO2outgassing, partial pressure of
river-ine CO2 (pCO2)indicates the CO2 concentration in rivers
and the gradient relative to the atmospheric equilibrium (i.e. 380 µatm). Most rivers of the world have higherpCO2than
the overlying atmosphere, suggesting a great emission poten-tial (Cole et al., 2007; Striegl et al., 2012). While the river-ine pCO2 of mainstem or estuary waters has been widely
recognized, such as the Amazon (Richey et al., 2002), Pearl (Yao et al., 2007), and Columbia (Evans et al., 2013), a holis-tic assessment concerning a complete river network is rare. This is largely caused by the constraints of time and logistics to conduct spatial sampling covering not only the mainstem but also the lower stream-order tributaries. Indeed, tributaries are physically and biogeochemically more active because they have stronger turbulence and more rapid mixing with the benthic substrate and the atmosphere than the mainstem (Alin et al., 2011; Butman and Raymond, 2011; Benstead and Leigh, 2012). For instance, Aufdenkampe et al. (2011) found that the CO2outgassing fluxes from small streams could be
2–3 times higher than from larger rivers. Thus, estimating CO2 evasion based only on mainstem waters will
underes-timate the total efflux of a specific river system. Analysing pCO2at space- and timescales by high-resolution sampling
is a prerequisite for precisely evaluating CO2outgassing and
its implications for the carbon cycle.
The Yellow River is characterized by high sediment and total dissolved solids (TDS) among the world’s large rivers, primarily because of severe soil erosion and intensive chem-ical weathering and human activity. Its TDS concentration
of 452 mg L−1 is about four times the world median value
(Chen et al., 2005). Based on measurements at hydrologi-cal gauges or in specific river reaches, prior studies have in-vestigated its chemical weathering and carbon transport (e.g. Zhang et al., 1995; Wu et al., 2008; Wang et al., 2012; Ran et al., 2013). Soil respiration in terrestrial ecosystems and im-pact of land use change on carbon storage have also been analysed (Zhao et al., 2008; Li et al., 2010). By contrast, few studies have examined its carbon dynamics in river wa-ters and how riverinepCO2has responded to catchment
fea-tures (Wang et al., 2012; Ran et al., 2013). Using historical records across the watershed during the period 1950s–1984 and recent sampling along the mainstem, we calculated the riverinepCO2from alkalinity and pH. This study aimed to
investigate the spatial and temporal variation ofpCO2 and
its responses to natural and human factors. The results will provide insights into the coupling between soil erosion and riverinepCO2 and the impact of dam operation on
down-stream riverinepCO2changes.
2 Materials and methods
2.1 The Yellow River
The Yellow River drains 752 000 km2of north China, orig-inating in the Tibetan Plateau and flowing eastward into the Bohai Sea (Fig. 1). Located in a semiarid–arid cli-mate, its precipitation is spatially highly variable, decreas-ing from 700 mm yr−1 in the southeast to 250 mm yr−1 in the northwest (Zhao, 1996). Likewise, temperature changes significantly, with the mean temperature in the upper (above Toudaoguai), middle (approximately between Toudaoguai and the Xiaolangdi Dam), and lower (below the Xiaolangdi Dam) reaches being 1–8, 8–14 and 12–14◦C, respectively (Chen et al., 2005). Because the Yellow River basin is in large part surrounded by the Loess Plateau that has typically accu-mulated huge erodible loess deposits (Fig. 1), it suffers from severe soil erosion. Approximately 1.6 Gt of sediment was transported to the ocean per year prior to the 1970s (Syvitski et al., 2005). For comparison, the mean water discharge was only 49 km3yr−1over the same period (Zhao, 1996).
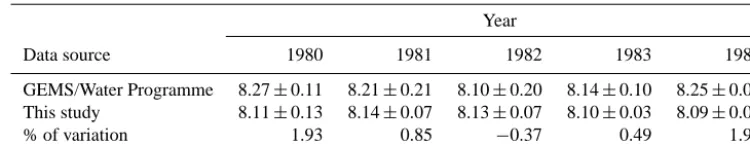
Table 1. pH at Luokou station during the period 1980–1984: a comparison of different data sources (arithmetic mean±standard deviation).
Year
Data source 1980 1981 1982 1983 1984
GEMS/Water Programme 8.27±0.11 8.21±0.21 8.10±0.20 8.14±0.10 8.25±0.09 This study 8.11±0.13 8.14±0.07 8.13±0.07 8.10±0.03 8.09±0.05
% of variation 1.93 0.85 −0.37 0.49 1.94
300 person km−2 in some agricultural areas in the middle reaches. Consequently, land use has become increasingly both extensive and intensive.
The Yellow River basin was mainly developed on the Sino-Korean Shield with Quaternary loess deposits overlying the vast middle reaches and Archean to Tertiary granites and metamorphic rocks in areas near the basin boundaries and in the lower reaches (Chen et al., 2005). Chemical analy-ses of loess samples show that feldspar, micas and quartz are the most common detrital minerals with carbonates ac-counting for 10–20 % (Zhang et al., 1995). Because the loess deposits cover about 46 % of the total drainage area, the river presents high alkalinity and intense rock weathering. With exceptionally high TDS concentration the Yellow River de-livers around 11 Mt of dissolved solids per year to the Bohai Sea (Gaillardet et al., 1999).
2.2 Historical records of water chemistry
Historical records of major ions (e.g. Ca2+, Mg2+, Na+, K+, Cl−, HCO−
3 and SO 2−
4 )measured from a hydrological
moni-toring network were extracted from the Yellow River Hydro-logical Yearbooks, which are yearly produced by the Yel-low River Conservancy Commission (YRCC). Other vari-ables concurrently measured at each sampling event, includ-ing pH, water temperature, water discharge and total sus-pended solids (TSS), were also retrieved from the yearbooks for this study. The water samples for pH and temperature were taken in the same time period as these for ion analy-sis. Over the period from the 1950s to 1984, the sampling frequency ranged from 1 to 5 times per month, depending on hydrological regime. Sampling at some stations during the period 1966–1975 were suspended or completely stopped. Post-1984 records are not in the public domain. Given the discontinuity in sampling, only the stations with at least 6 samples in a year were analysed. A total of 129 stations with 15 029 water chemistry measurements were compiled (Fig. 1).
Chemical analyses of the collected water samples were performed under the authority of the YRCC following the standard procedures and methods described by Alekin et al. (1973) and the American Public Health Associa-tion (1985). The pH and temperature were measured in field, and total alkalinity (TAlk) was determined using a fixed end-point titration method. Detailed description of the sampling
and analysis procedures can be found in Chen et al. (2002a). The results are summarized in the Supplement (Table S1).
Use of historical records always raises the issue of data reliability. No detailed information on quality assurance and quality control is available in the hydrological reports. Ex-tensive efforts have been made to assess the data quality by analysing the parameter differences measured at the same station but by different agencies. The Luokou station on the lower Yellow River mainstem has been monitored under the United Nations Global Environment Monitoring System (GEMS) Water Programme since 1980 (only yearly means available at http://www.unep.org/gemswater). As pCO2 is
considerably sensitive to pH changes (Li et al., 2012), the pH values from the two sources were compared (Table 1), which showed that the data set from the Hydrological Year-books agreed well with the GEMS/Water Programme data set with differences of < 2 %. High data quality of the hydro-logical reports can also be confirmed from the concentration comparison of major ions in the two data sets (see Chen et al., 2005).
Given the data paucity for the upper Yellow River, data collected at 17 sites in the headwater region were retrieved from Wu et al. (2005) (Fig. 1 and Table S1 in the Supple-ment). They measured pH and temperature along the main-stem and major tributaries and determined the TAlk through Gran titration. Comparison with previous sampling results (Zhang et al., 1995) showed their data agreed well.
2.3 Recent field sampling
From July 2011 to July 2012, weekly sampling on the main-stem was undertaken at Toudaoguai, Tongguan and Lijin stations (Fig. 1). The frequency increased (i.e. daily) when large floods occurred. Water column samples were collected
∼0.5 m below the surface water and kept in acid-washed, but carefully neutralized, high-density polyethylene contain-ers. Concomitant determination of pH and water temperature was performed in situ using a Hanna HI9125 pH meter on the NBS scale, which was calibrated prior to each measure-ment against pH7.01 and pH10.01 buffers. Replicate mea-surements showed the precision for pH and temperature were
the analytical error was below 3 %. The parallel alkalinity results were then averaged. In total, 163 samples were col-lected. Ancillary data, including daily water discharge and TSS, were acquired from the YRCC. Generally, the sam-pling results at Toudaoguai and Tongguan reflect the TAlk andpCO2changes on the Loess Plateau, while the Lijin
mea-surements represent seaward export as it is located 110 km upstream of the river mouth and free of tidal influences. 2.4 Calculations of DIC species andpCO2
Total dissolved inorganic carbon (DIC) species in river systems include HCO−3, CO2−3 , H2CO3 and aqueous CO2
(CO2aq). Their relative concentration is a function of
temper-ature and pH (Li et al., 2012). DIC species can be determined by Henry’s Law, from which thepCO2can be calculated
us-ing the CO2SYS program (Lewis and Wallace, 1998):
CO2+H2O↔H2CO3∗↔H++HCO3−↔2H++CO2−3 . (1)
At chemical equilibrium, the activities of the reactants and products are determined from the thermodynamic reaction constants (Ki)that are temperature (T )dependent:
KCO2= [H2CO3 ∗]
/[pCO2] (2)
K1= [H+][HCO3−]/[H2CO3∗] (3) K2= [H+][CO32−]/[HCO3−], (4)
where H2CO∗3is the sum of CO2aqand the true H2CO3. The pKivalues (negative log ofKi)can be calculated by the
fol-lowing equations (Clark and Fritz, 1997):
pKCO2= −7×10⁻⁵T2+0.016T+1.11 (5) pK1=1.1×10⁻⁴T2−0.012T+6.58 (6) pK2=9×10⁻⁵T2−0.0137T +10.62 (7)
Then, thepCO2can be simply expressed as:
pCO2= [H2CO3∗]/KCO2= [H +][
HCO3−]/KCO2K1. (8)
With the pH mostly ranging from 7.4 to 8.6 indicative of natural processes for the Yellow River (Chen et al., 2005), HCO−3 is considered equivalent to alkalinity because it rep-resents > 96 % of the TAlk. This approach has been fre-quently used and has demonstrated high pCO2 in Chinese
river systems (e.g. Yao et al., 2007; Li et al., 2012). To val-idate the simplification, we also estimated thepCO2 using
the program PHREEQC (Hunt et al., 2011). ThepCO2
re-sult derived by PHREEQC are very close to that by CO2SYS with < 3 % differences. However, the calculatedpCO2results
[image:4.612.310.547.64.317.2]may have slightly overestimated the actual values (Cole and Caraco, 1998; Abril et al., 2015).
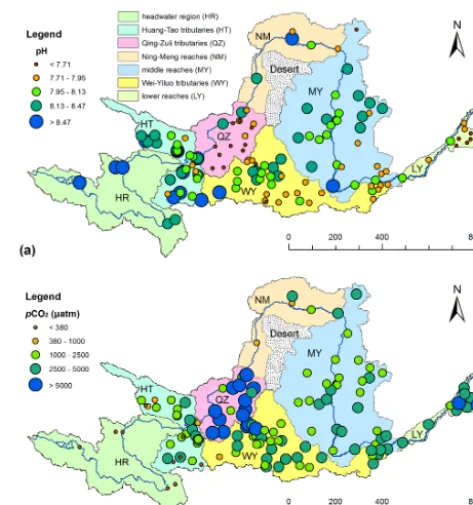
Figure 2. Spatial variations of pH (a) andpCO2(b) in the Yellow
River watershed.
3 Results
3.1 Characteristics of hydrochemical setting
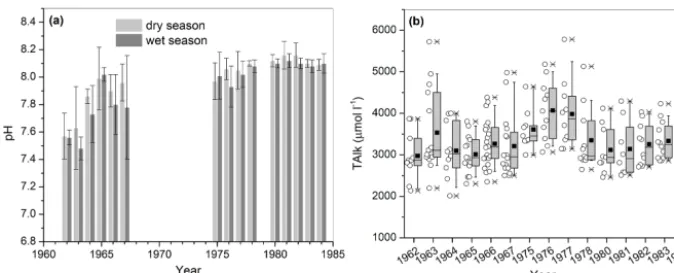
To better investigate the spatial changes of hydrochemi-cal variables, the watershed was divided into seven sub-basins: the headwater region (HR), the Huang–Tao tribu-taries (HT), the Qing–Zuli tributribu-taries (QZ), the Ning–Meng reaches (NM), the Wei–Yiluo tributaries (WY), the middle reaches (MY), and the lower reaches (LY) (Fig. 2). The Yellow River waters were characterized by high alkalinity with the pH presenting significant spatial variations (Fig. 2a). While high pH values were mostly observed in the HR sub-basin where the highest was 9.1, relatively low pH (i.e. < 7.71) was recorded at the QZ tributary sites with the low-est being 6.4. For the waters from the Loess Plateau, the pH ranged from 7.71 to 8.47. Towards the river mouth, it showed a downward trend in the lower reaches (LY). With one ex-ception at Lijin (Fig. 1), the pH values were all below 8.13 and even below 7 at some tributary sites. In addition to spa-tial variations, it showed considerable seasonal changes. As exemplified in Fig. 3a, the waters were generally more alka-line in the dry season (October–May) than in the wet season (June–September).
Figure 3. Seasonal comparison of pH (a) and box-and-whisker plot of TAlk (b) at Luokou station. The horizontal line is the median value, the black square is the mean value, the boxes represent the 25th to 75th percentile, the whiskers represent the 10th and 90th percentile, and the asterisks represent the maximum and minimum. Raw TAlk data are added to the left in (b).
3850±1000 µmol L−1. The highest TAlk (8633 µmol L−1) was measured in the QZ sub-basin. It is evident that the TAlk and pH showed similar spatial variations, but in the reverse direction with high TAlk coinciding with low pH (Fig. S1). With regard to all the sampling re-sults, about 58 % of the TAlk values fell into the range of 3000–4000 µmol L−1 and 92 % into the range of 2000– 5000 µmol L−1. For the whole Yellow River watershed, its mean TAlk was 3665±988 µmol L−1. In addition, its TAlk remained largely stable during the sampling period. Fig-ure 3b shows an example of the TAlk changes at Luokou. Despite the discontinuous measurement from 1968 to 1974, the TAlk did not change significantly over time (p=0.48). 3.2 Spatial and temporal variability ofpCO2
The pCO2 varied significantly throughout the watershed
with 2 orders of magnitude from ∼200 µatm to more than 30 000 µatm. Except the headwater region that showed lower pCO2than the overlying atmosphere, the remaining
water-shed had a considerably highpCO2(Fig. 2b). The highest pCO2 of 36 790 µatm was estimated on a tributary in the
QZ sub-basin resulting from low pH and high TAlk. For the middle Yellow River, including the MY and WY sub-basins, the waters were considerably supersaturated in CO2with the pCO2ranging from 1000 to 5000 µatm (Fig. 2b). Moreover,
thepCO2level in the lower Yellow River reaches (LY) was
much higher and can exceed 10 000 µatm. On average, the pCO2in the Yellow River watershed was 2810±1985 µatm,
7-fold the atmospheric CO2 equilibrium. However, it must
be recognized that, unlike the historical data set that was monthly measured, sampling in the HR sub-basin by Wu et al. (2005) was conducted only during the late May and June of 1999 and 2000 when the wet season had barely started. Given the flushing effect of infiltrating rainfall and snowmelt flows at the beginning of the wet season (Clow and Drever, 1996; Melack, 2011), the resultant TAlk andpCO2 are
ex-pected to be close to highest.
Similar to TAlk, thepCO2 at most sites also presented
strong seasonal variations. At 73 % of the sampling sites, higherpCO2occurred in the months before the onset of the
wet season. During the wet season, it decreased to a rel-atively low level before going up from October onwards. The seasonal ratio of pCO2, defined as the ratio ofpCO2
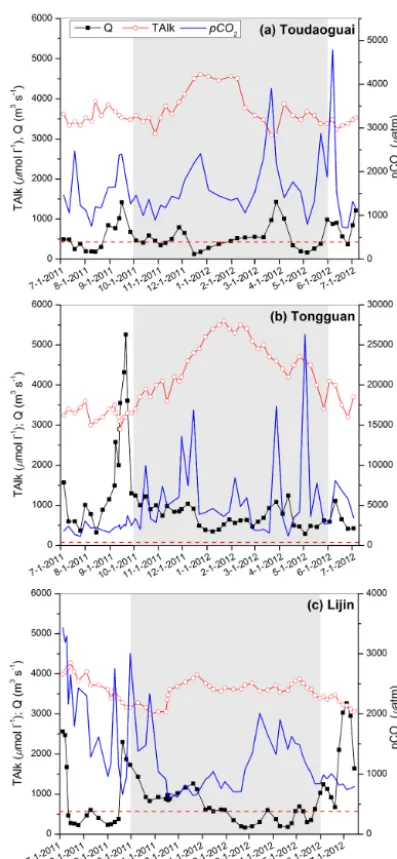
in the dry season over that in the wet season, ranged from 0.8 to 2.3. To more clearly show its spatial and temporal changes, Fig. 4 shows the high temporal-resolution results at Toudaoguai, Tongguan and Lijin. Both the TAlk andpCO2
exhibited large spatial differences among the three sites. The mean TAlk at Tongguan (4075±796 µmol L−1)was higher than at the upstream Toudaoguai and the downstream Lijin (3664±399 and 3622±292 µmol L−1, respectively). Like-wise, the meanpCO2at Tongguan (4770±3470 µatm) was
about 3 and 3.5 times that at Toudaoguai (1624±778 µatm) and Lijin (1348±689 µatm), respectively. The highestpCO2
of 26 318 µatm was estimated at Tongguan in early May. Compared with tributary streams showing pronounced seasonal variation, the mainstem exhibited more complicated seasonal patterns (Fig. 4). The TAlk was higher in the dry season than in the wet season, in particular for Tongguan lo-cated downstream of the Loess Plateau (Table 2; Fig. 1). The pCO2showed similar seasonal cycles. A contrast to the weak
seasonal changes at Toudaoguai and Lijin, thepCO2at
Tong-guan in the dry season (6016 µatm on average) was twofold that in the wet season. It is clear thepCO2 increased
sub-stantially in both seasons as waters from the Loess Plateau entered the mainstem, and then decreased along the channel course towards the ocean (Table 2). Furthermore, thepCO2
presented complex relationships with water discharge. While thepCO2changed synchronously with water at Toudaoguai,
it decreased with increasing water in the wet season at Tong-guan and Lijin (Fig. 4). ThepCO2 at all three stations was
Figure 4. Weekly variations in water discharge (Q), TAlk, and pCO2at (a) Toudaoguai, (b) Tongguan and (c) Lijin from July 2011
to July 2012. The dotted line denotes the atmospheric CO2 equilib-rium (i.e. 380 µatm) and the shaded grey represents the dry season.
Longitudinal variations of TAlk andpCO2along the
main-stem indicated that the waters from the Loess Plateau had higher TAlk and were more supersaturated in CO2than the
upper and lower Yellow River waters (Fig. 5). Both the TAlk andpCO2 decreased remarkably downstream of the Loess
Plateau. In addition, with extremely high suspended solids, the Yellow River provides an excellent case study for un-derstanding the responses ofpCO2to TSS export (Fig. 6).
Based on measurements in the sediment-yielding areas on the Loess Plateau, the pCO2 increased exponentially with
increasing TSS concentration under low TSS scenarios (i.e. 100 kg m−3). When the TSS concentration was higher than
Figure 5. Longitudinal variations of TAlk andpCO2 along the
mainstem channel. The shaded region approximately represents the Loess Plateau. Whiskers indicate the standard deviation.
100 kg m−3, however, the pCO2 decreased slightly and
re-mained stable thereafter (Fig. 6).
4 Discussion
4.1 Environmental controls on riverinepCO2
The alkalinity of river water reveals its buffering capacity in a carbonate system to neutralize acids and bases. Due to abun-dant carbonate outcrops, groundwater in the Yellow River basin was highly alkaline (Chen et al., 2002b), which di-rectly led to higher TAlk in the dry season when baseflow constituted 90 % of the river runoff. High TAlk on the Loess Plateau was probably the result of chemical weathering. With widespread carbonates, chemical weathering in the loess de-posits has generated high dissolved solids with HCO−3 be-ing the dominant ion (Zhang et al., 1995; Chen et al., 2005). Plotting TAlk against flow showed that they were negatively correlated (Fig. 7). However, the TAlk did not change syn-chronously with water in the wet season. It decreased more slowly as revealed by the exponents of the fitted equations. Compared with the flow changes, a narrower TAlk fluctua-tion suggested the coupling results of enhanced alkalinity ex-port in the wet season and the dilution effect of water (Piˇnol and Avila, 1992; Raymond and Cole, 2003). Analysing the temporal variations of major ions during 1958–2000, Chen et al. (2005) found that they persistently increased due largely to human impacts. In contrast, the long-term stable TAlk (Fig. 3b) indicates that it is not significantly affected. Natu-ral weathering processes must have played a more important role in controlling the export of DIC species and TAlk.
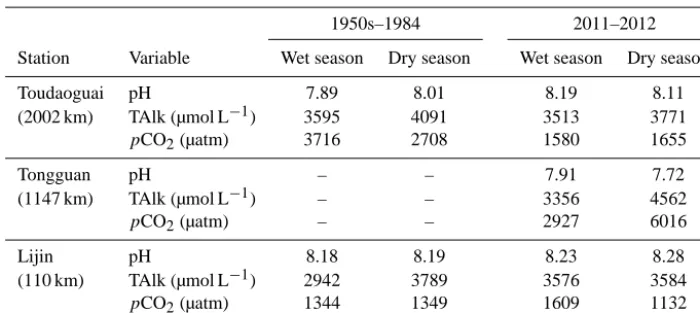
[image:6.612.310.543.65.226.2]Table 2. Inter-annual and seasonal differences of pH, TAlk, andpCO2at the three stations. The number below the station name denotes the channel length to the river mouth.
1950s–1984 2011–2012
Station Variable Wet season Dry season Wet season Dry season
Toudaoguai pH 7.89 8.01 8.19 8.11
(2002 km) TAlk (µmol L−1) 3595 4091 3513 3771
pCO2(µatm) 3716 2708 1580 1655
Tongguan pH – – 7.91 7.72
(1147 km) TAlk (µmol L−1) – – 3356 4562
pCO2(µatm) – – 2927 6016
Lijin pH 8.18 8.19 8.23 8.28
(110 km) TAlk (µmol L−1) 2942 3789 3576 3584
[image:7.612.51.283.272.452.2]pCO2(µatm) 1344 1349 1609 1132
Figure 6. Relationship between total suspended solids (TSS) and pCO2based on measurements on the Loess Plateau. The solid line denotes the fitted line for the TSS concentration ranging from 0 to 100 kg m−3, and the dashed line indicates the stable trend ofpCO2 when the TSS concentration is higher than 100 kg m−3.
are highly dependent on temperature and rainfall (Epron et al., 1999; Hope et al., 2004; Shi et al., 2011), higher riverine pCO2is expected in the wet season due to soil CO2
flush-ing. This is in contrast to the observed seasonal variations in the Yellow River. A unique precipitation distribution and hydrological regime may have contributed to these anoma-lous observations. The Yellow River basin is characteristic of high-intensity rainfalls; several storms in the wet season can account for > 70 % of the annual precipitation (Zhao, 1996). Coupled with its distinct soil surface microtopography with texture consisted mainly of silt and clay, Hortonian overland flow is the dominant runoff process (Liu and Singh, 2004). As a result of greatly reduced soil infiltration capacity, the generated overland flow by high-intensity rainfalls may have diluted the TAlk and caused the lowered riverinepCO2.
Responses of the pCO2 to TSS concentration (Fig. 6)
reflect the soil erosion processes distinctive to the Loess Plateau (Zhao, 1996; Rustomji et al., 2008). At the initial stage of soil erosion, the surficial soils with abundant or-ganic carbon are first eroded into river water. Decomposi-tion of the labile organic carbon in the eroded soils will in-crease thepCO2. Thus, it responded positively to soil erosion
and TSS. This positive response lasted until the topsoils were completely eroded. The threshold of ca. 100 kg m−3is con-sistent with the commonly defined hyperconcentrated flows (Xu, 2002). Hyperconcentrated flows indicating TSS concen-tration greater than 100 kg m−3 are frequently recorded in the Yellow River, in which gully erosion contributes > 50 % of the fluvial sediment loads (Ran et al., 2014). Compared with the organic carbon content in the topsoils (usually 0.5– 1.5 %), it is much lower in the subsoils (i.e. 0.2–0.3 %) and shows uniformity with depth (Wang et al., 2010; Zhang et al., 2012). The mobilized subsoils through gully erosion there-fore have lower organic carbon quantity for decomposition, resulting in the reduced and stable riverinepCO2regardless
of the increasing TSS concentration.
Lower pCO2 in the HR sub-basin was caused by
rela-tively low TAlk and high pH. Statistical analyses showed that its TAlk was 25 % lower than the basin average while the pH was 7 % higher. Compared to other sub-basins, the HR sub-basin is covered by an alpine meadow ecosystem with soils being slightly eroded, which may have constrained the leaching of organic matter. Moreover, this sub-basin is in cold environments and its temperature falls below zero from October to March. Microbial decomposition of organic mat-ter and ecosystem respiration are kinetically inhibited as af-fected by the low temperature (Kato et al., 2004), resulting in the lowpCO2. Unique climate also denotes the seasonal
patterns of pCO2 in the upper and middle Yellow River.
Occurrence of the highestpCO2 at Toudaoguai and
Figure 7. Dependence of TAlk on natural water discharge for different water discharge scales at typical sampling sites: (a) is from a tributary and (b) and (c) are from the Yellow River mainstem (see Fig. 1 for locations).
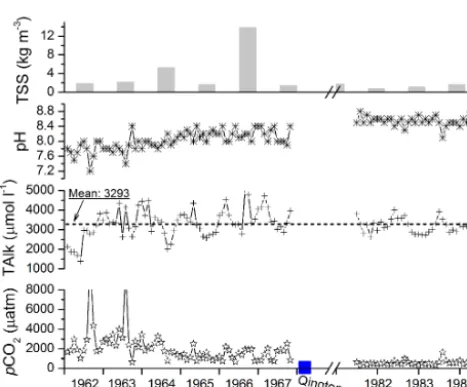
Figure 8. Impacts of Qingtongxia (QTX) dam on riverine TSS, pH, TAlk and pCO2. Measurements were conducted∼850 m
down-stream of the dam that was built in 1968 (see Fig. 1 for its location).
in the northernmost reaches (between QTX and Toudaoguai; Fig. 1) will freeze up (Chen and Ji, 2005). Aqueous CO2
could not be efficiently released due to ice protection and typ-ically accumulates below the ice cover. Starting from early spring, the ice begins to thaw and CO2-laden waters are
ex-ported downstream to the sampling sites, probably causing the sharply increasedpCO2. Also, the lower temperature in
the dry season would be responsible for the higherpCO2as
the solubility of CO2 increases with decreasing water
tem-perature.
HighpCO2in the QZ sub-basin (Fig. 2b) was primarily
the result of high TAlk due to its geological background. Its major rock types are carbonates, detritus (quartz and feldspar) and red-beds (gypsum and halite) (Zhang et al., 1995). These rocks are highly vulnerable to weathering, thus producing TAlk (mainly HCO−3)into river. In fact, its mean TDS was 8–14 times the basin average (Chen et al., 2005). Further, this sub-basin has high drought index with its annual evaporation being > 8 times the annual precipitation (Chen et
al., 2005). Such strong evaporation will result in not only the precipitation of minerals with low solubility, but also the ele-vated concentrations of solutes not removed during the crys-tallization process. Another possible cause is the severe ero-sion due to sparse vegetation cover. In addition to mobiliza-tion of organic matter, soil erosion is able to enhance chem-ical weathering by increasing the exposure surface of fresh minerals to atmosphere (Millot et al., 2002). This would also contribute to greatly condensed DIC species in river waters and thus highpCO2.
As for the longitudinal variations (Fig. 5), severe soil ero-sion on the Loess Plateau may be the major reason as dis-cussed above. In addition, low groundwater table in the arid climate allows deeper soil horizons to adequately interact with the atmosphere, which could also facilitate the exposure of mineral surfaces to weathering and generate huge quanti-ties of alkalinity. IncreasingpCO2until Tongguan suggested
the integrated responses ofpCO2 to these factors. Without
large tributaries joining the lower Yellow River (Fig. 1), the decreasing TAlk andpCO2along the mainstem revealed
re-duced TAlk input. Overall, the spatial changes of TAlk and pCO2were the combined results of differences in soil
prop-erty, hydrological regime, climate and landform develop-ment.
4.2 Anthropogenic impacts on riverinepCO2
Agricultural activity within a watershed can affect its river-ine pCO2. Tilling practices can not only expand the
[image:8.612.52.286.228.422.2]for the elevatedpCO2in these regions relative to the
head-water region that had higher pH (Fig. 2).
Differences in the hydrochemical parameters between his-torical records and recent sampling clearly reveal the tem-poral changes over the period. Significant increase in pH at Toudaoguai was largely caused by widespread salinization of agricultural soils. There are two large irrigation zones up-stream of Toudaoguai; large quantities of water is diverted for desalination and irrigation (Chen et al., 2005). The di-verted water volume has gradually increased since 1960 due to growing demand (Ran et al., 2014). When washed out from irrigated farmlands, the return water characterized by high pH caused the riverine pH to increase, leading further to greatly reduced pCO2 despite the roughly stable TAlk
(Fig. 3b). Particularly, it is worth noting that the magnitude of reduction was much higher in the wet season when the high-pH return water reached the mainstem with floods (Ta-ble 2).
Trapping of water and suspended solids by dams will alter river-borne carbon dynamics (Cole et al., 2007). Ex-tended residence time combined with sufficient organic mat-ter availability may enhance CO2 production, causing a
higherpCO2. This is particularly true for tropical reservoirs
into which organic matter inputs are sufficient, especially in the initial years after impoundment (Roland et al., 2010; Raymond et al., 2013). On the other hand, reduced flow tur-bulence and increases in water residence time would pro-mote photosynthesis of aquatic plants and reduce aqueous CO2concentration (Teodoru et al., 2009; Wang et al., 2011).
An example of the impact of dams on downstream pCO2
changes is presented in Fig. 8. Located on the upper main-stem channel (Fig. 1), operation of the Qingtongxia Dam since 1968 has substantially affected thepCO2. Despite
in-significant changes of the TAlk between the pre- and post-dam periods (Fig. 8), enhanced aquatic photosynthesis af-ter dam operation owing to reduced TSS concentration may have absorbed aqueous CO2and resulted in increased pH by
shifting the chemical equilibrium of Eq. (1). Accordingly, the riverinepCO2declined during the post-dam period with the
elevated pH and roughly stable TAlk.
For the dams on the Loess Plateau constructed mostly in 1960–2000, however, aqueous photosynthesis appears to be at a low level owing to its extremely high TSS concentra-tion and limited light availability (Chen et al., 2005). In con-trast, flow regulation plays a more important role in control-ling the seasonal patterns of downstreampCO2. Man-made
floods have been regularly released from the Xiaolangdi Dam sluice gates since 2000 to flush sediment deposition in the lower Yellow River, usually from late June (Wang et al., 2012; Ran et al., 2014). The deep waters supersaturated with CO2 are first discharged, resulting in the highpCO2 at
Li-jin in the wet season (Fig. 4c). Unlike the seasonal varia-tions at Toudaoguai and Tongguan as mentioned above, du-ration of the high pCO2 at Lijin coincided well with the
sediment flushing period, indicating the impact of flow
reg-ulation onpCO2 dynamics. Operation of dam cascade has
also modified the TAlk andpCO2levels at the inter-annual
scale. Affected by upstream dams (see Fig. 1), both the TAlk andpCO2 at Lijin in the wet season were elevated during
the period 2011–2012, by 22 and 20 %, respectively, rela-tive to the baseline period 1950s–1984 (Table 2). Further-more, soil conservation and vegetation restoration conducted on the Loess Plateau since the 1970s have contributed to the inter-annual changes. More organic carbon has been seques-trated as a result of these land management practices (Chen et al., 2007). Given the strong flushing and leaching effects of high-intensity rainfalls, riverine organic matter export tends to increase in the wet season, and the accompanying decom-position can elevatepCO2.
4.3 Implications for CO2outgassing
CO2 outgassing from river waters into the atmosphere
dur-ing the carbon transport processes from land to the ocean has not been fully realized until recent years (Richey et al., 2002; Cole et al., 2007; Battin et al., 2009). Because riverine pCO2demonstrates the CO2concentration in surface water,
a higher riverinepCO2usually represents stronger CO2
out-gassing under favourable environmental conditions, forming a carbon source for the atmosphere. However, accurate esti-mates of global CO2outgassing have been hampered by the
absence of a spatially resolvedpCO2database. Previous
es-timates from rivers alone involve large uncertainties, varying from 0.23 to 0.56 Gt C yr−1(Cole et al., 2007; Aufdenkampe et al., 2011). A recent study has even concluded that up to 1.8 Gt of carbon is annually emitted from global rivers (Ray-mond et al., 2013), considerably higher than was previously thought. This estimate accounts for about 32 % of the annual carbon flux transferred from terrestrial systems to inland wa-ters (Wehrli, 2013). Given the existing uncertainties, quan-tifyingpCO2 in different orders of streams of a complete
river network is critical to resolve a robust estimate of river-ine CO2evasion.
With respect to the Yellow River, the lower riverinepCO2
in the HR sub-basin relative to the atmospheric equilibrium indicates a potential CO2drawdown. In comparison, the river
waters in the remaining watershed are generally supersat-urated with CO2, mostly greater than 1000 µatm (Fig. 2b).
With an averagepCO2 of 2810±1985 µatm for the whole
watershed comparable to the median of global rivers (i.e. 1300–4300 µatm; Aufdenkampe et al., 2011), the Yellow River waters tend to act as a net carbon source for the atmo-sphere. As stated earlier, despite the uncertainties associated with outgassing calculation, recent studies on watershed-scale carbon delivery demonstrate that CO2efflux from rivers
is likely to be emitted as CO2into the atmosphere. In view
of the severe soil erosion and high TSS transport (Syvitski et al., 2005), interpretation of these fluxes in the context of climate change is of great importance for understanding the role of Yellow River in the global carbon cycle.
5 Conclusions
The Yellow River was characterized by high alkalinity with a mean TAlk of 3665±988 µmol L−1. Although with sig-nificant spatial variations, the TAlk remained largely stable over the study period. However, it showed seasonal vari-ability and decreased in the wet season, suggesting the di-lution effect of water discharge. Except for the HR sub-basin where the pCO2 was lower than the atmospheric
equilib-rium, river waters in the remaining watershed were supersat-urated with CO2. The basin-wide meanpCO2was estimated
at 2810±1985 µatm. Similar to the pH and TAlk, thepCO2
also presented significant spatial and seasonal variations. The middle reaches, mainly the Loess Plateau, showed higher pCO2 than the upper and lower reaches, which were
prin-cipally resulting from severe soil erosion and the unique hy-drological regime. ThepCO2correlated exponentially with
TSS transport when the erosion intensity was low and only the topsoils rich in organic carbon were eroded. When the TSS concentration exceeded 100 kg m−3indicating the pre-dominance of gully erosion, the subsoils with low organic carbon content were mobilized. Owing to the reduced or-ganic carbon available for decomposition, thepCO2slightly
decreased and remained stable thereafter, regardless of the increasing TSS concentration.
The observed spatial and temporal variations of river-ine pCO2were collectively controlled by natural processes
and human activities. High pCO2 in the upper and
mid-dle reaches was usually estimated from March through May when ice-melt floods transported the accumulated CO2-laden
waters in winter. Human activities, especially flow regula-tion, have significantly changed its seasonal patterns by al-tering hydrological regime and riverine carbon delivery pro-cesses. While reduced turbidity and extended residence time due to dam trapping has enhanced aquatic photosynthesis and resulted in a decreasedpCO2, man-made floods through flow
regulation would increase downstreampCO2. Other
anthro-pogenic perturbations, such as acidification, soil conserva-tion and irrigaconserva-tion, have also affected pCO2. The
acceler-ating human activity within the watershed is likely to ex-pand the role of anthropogenic over natural factors on the pCO2dynamics, because stronger anthropogenic impacts are
certain to occur concerning present economic development. Considerably high riverine pCO2 in the Yellow River
wa-ters with respect to the overlying atmosphere indicates that substantial amounts of CO2are emitted into the atmosphere.
Given the huge human impacts on flow, TSS and carbon
fluxes, future efforts to estimate CO2evasion and assess its
importance in the global carbon cycle are urgently needed.
The Supplement related to this article is available online at doi:10.5194/bg-12-921-2015-supplement.
Acknowledgements. This work was supported by the Ministry of
Education, Singapore (MOE2011-T2-1-101). We are grateful to the YRCC for access to the hydrological data. We thank the staff at Toudaoguai, Tongguan and Lijin gauges for their assistance in the field. Comments from two anonymous reviewers were instrumental in improving this paper.
Edited by: S. Bouillon
References
Abril, G., Bouillon, S., Darchambeau, F., Teodoru, C. R., Mar-wick, T. R., Tamooh, F., Ochieng Omengo, F., Geeraert, N., Deir-mendjian, L., Polsenaere, P., and Borges, A. V.: Technical Note: Large overestimation ofpCO2calculated from pH and alkalinity in acidic, organic-rich freshwaters, Biogeosciences, 12, 67–78, doi:10.5194/bg-12-67-2015, 2015.
Alekin, O. A., Semenov, A. D., and Skopintsev, B. A.: Handbook of Chemical Analysis of Land Waters, Gidrometeoizdat, St. Pe-tersburg, Russia, 269 pp., 1973.
Alin, S. R., Rasera, M. d. F. F. L., Salimon, C. I., Richey, J. E., Holt-grieve, G. W., Krusche, A. V., and Snidvongs, A.: Physical con-trols on carbon dioxide transfer velocity and flux in low-gradient river systems and implications for regional carbon budgets, J. Geophys. Res., 116, G01009, doi:10.1029/2010jg001398, 2011. American Public Health Association (APHA): Standard Methods for the Examination of Water and Wastewater, 16th edition, American Public Health Association, Washington, DC, 1268 pp., 1985.
Aufdenkampe, A. K., Mayorga, E., Raymond, P. A., Melack, J. M., Doney, S. C., Alin, S. R., Aalto, R. E., and Yoo, K.: Riverine coupling of biogeochemical cycles between land, oceans, and at-mosphere, Front. Ecol. Environ., 9, 53–60, 2011.
Battin, T. J., Luyssaert, S., Kaplan, L. A., Aufdenkampe, A. K., Richter, A., and Tranvik, L. J.: The boundless carbon cycle, Nat. Geosci., 2, 598–600, 2009.
Benstead, J. P. and Leigh, D. S.: An expanded role for river net-works, Nat. Geosci., 5, 678–679, 2012.
Butman, D. and Raymond, P. A.: Significant efflux of carbon diox-ide from streams and rivers in the United States, Nat. Geosci., 4, 839–842, 2011.
Chen, L. D., Gong, J., Fu, B. J., Huang, Z. L., Huang, Y. L., and Gui, L. D.: Effect of land use conversion on soil organic carbon sequestration in the loess hilly area, loess plateau of China, Ecol. Res., 22, 641–648, 2007.
Chen, J., Wang, F. Y., Xia, X. H., and Zhang, L. T.: Major element chemistry of the Changjiang (Yangtze River), Chem. Geol., 187, 231–255, 2002a.
Chen, J., Tang, C. T., Sakura, Y., Kondoh, A., and Shen, Y.: Ground-water flow and geochemistry in the lower reaches of the Yellow River: a case study in Shandang Province, China, Hydrogeol. J., 10, 587–599, 2002b.
Chen, J., Wang, F., Meybeck, M., He, D., Xia, X., and Zhang, L.: Spatial and temporal analysis of water chemistry records (1958– 2000) in the Huanghe (Yellow River) basin, Global Biogeochem. Cy., 19, GB3016, doi:10.1029/2004gb002325, 2005.
Clark, I. D. and Fritz, P.: Environmental isotopes in hydrogeology, CRC Press/Lewis Publishers, New York, 328 pp., 1997. Clow, D. W. and Drever, J. I.: Weathering rates as a function of flow
through an alpine soil, Chem. Geol., 132, 131–141, 1996. Cole, J. J. and Caraco, N. F.: Atmospheric exchange of carbon
diox-ide in a low-wind oligotrophic lake measured by the addition of SF6, Limnol. Oceanogr., 43, 647–656, 1998.
Cole, J. J., Prairie, Y. T., Caraco, N. F., McDowell, W. H., Tranvik, L. J., Striegl, R. G., Duarte, C. M., Kortelainen, P., Downing, J. A., Middelburg, J. J., and Melack, J.: Plumbing the global carbon cycle: Integrating inland waters into the terrestrial carbon budget, Ecosystems, 10, 171–184, 2007.
Epron, D., Farque, L., Lucot, E., and Badot, P. M.: Soil CO2efflux
in a beech forest: dependence on soil temperature and soil water content, Ann. For. Sci., 56, 221–226, 1999.
Evans, W., Hales, B., and Strutton, P. G.:pCO2distributions and
air-water CO2 fluxes in the Columbia River estuary, Estuar. Coastal Shelf S., 117, 260–272, 2013.
Gaillardet, J., Dupre, B., Louvat, P., and Allegre, C. J.: Global sil-icate weathering and CO2consumption rates deduced from the
chemistry of large rivers, Chem. Geol., 159, 3–30, 1999. Guo, J. H., Liu, X. J., Zhang, Y., Shen, J. L., Han, W. X., Zhang, W.
F., Christie, P., Goulding, K. W. T., Vitousek, P. M., and Zhang, F. S.: Significant acidification in major Chinese croplands, Science, 327, 1008–1010, 2010.
Hope, D., Palmer, S. M., Billett, M. F., and Dawson, J. J. C.: Varia-tions in dissolved CO2and CH4in a first-order stream and
catch-ment: an investigation of soil-stream linkages, Hydrol. Process., 18, 3255–3275, 2004.
Humborg, C., Mörth, C., Sundbom, M., Borg, H., Blenckner, T., Giesler, R., and Ittekkot, V.: CO2 supersaturation along the aquatic conduit in Swedish watersheds as constrained by ter-restrial respiration, aquatic respiration and weathering, Glob. Change Biol., 16, 1966–1978, 2010.
Hunt, C. W., Salisbury, J. E., and Vandemark, D.: Contribution of non-carbonate anions to total alkalinity and overestimation ofpCO2in New England and New Brunswick rivers,
Biogeo-sciences, 8, 3069–3076, doi:10.5194/bg-8-3069-2011, 2011. Kato, T., Tang, Y., Gu, S., Cui, X., Hirota, M., Du, M., Li, Y., Zhao,
X., and Oikawa, T.: Carbon dioxide exchange between the atmo-sphere and an alpine meadow ecosystem on the Qinghai-Tibetan Plateau, China, Agr. Forest Meteorol., 124, 121–134, 2004. Lewis, E. and Wallace, D. W. R.: Program developed for CO2
system calculations, ORNL/CDIAC-105, Carbon dioxide Infor-mation Analysis Center, Oak Ridge National Laboratory, Oak Ridge, TN, 1998.
Li, S., Lu, X. X., He, M., Zhou, Y., Li, L., and Ziegler, A. D.: Daily CO2partial pressure and CO2outgassing in the upper Yangtze
River basin: A case study of the Longchuan River, China, J. Hy-drol., 466–467, 141–150, 2012.
Li, X. D., Fu, H., Guo, D., Li, X. D., and Wan, C. G.: Partitioning soil respiration and assessing the carbon balance in a Setaria
ital-ica (L.) Beauv. Cropland on the Loess Plateau, Northern China,
Soil Biol. Biochem., 42, 337–346, 2010.
Liu, Q. and Singh, V.: Effect of microtopography, slope length and gradient, and vegetative cover on overland flow through simula-tion, J. Hydrol. Eng., 9, 375–382, 2004.
Melack, J.: Riverine carbon dioxide release, Nat. Geosci., 4, 821– 822, 2011.
Millot, R., Gaillardet, J., Dupre, B., and Allegre, C. J.: The global control of silicate weathering rates and the coupling with phys-ical erosion: new insights from rivers of the Canadian Shield, Earth Planet. Sci. Lett., 196, 83–98, 2002.
Piˇnol, J. and Avila, A.: Streamwater pH, alkalinity,pCO2and
dis-charge relationships in some forested Mediterranean catchments, J. Hydrol., 131, 205–225, 1992.
Ran, L. and Lu, X. X.: Delineation of reservoirs using remote sens-ing and their storage estimate: an example of the Yellow River basin, China, Hydrol. Process., 26, 1215–1229, 2012.
Ran, L., Lu, X. X., Sun, H., Han, J., Li, R., and Zhang, J.: Spatial and seasonal variability of organic carbon transport in the Yellow River, China, J. Hydrol., 498, 76–88, 2013.
Ran, L., Lu, X. X., and Xin, Z.: Erosion-induced massive or-ganic carbon burial and carbon emission in the Yellow River basin, China, Biogeosciences, 11, 945–959, doi:10.5194/bg-11-945-2014, 2014.
Raymond, P. A. and Cole, J. J.: Increase in the export of alkalinity from North America’s largest river, Science, 301, 88–91, 2003. Raymond, P. A., Hartmann, J., Lauerwald, R., Sobek, S.,
McDon-ald, C., Hoover, M., Butman, D., Striegl, R., Mayorga, E., and Humborg, C.: Global carbon dioxide emissions from inland wa-ters, Nature, 503, 355–359, 2013.
Richey, J. E., Melack, J. M., Aufdenkampe, A. K., Ballester, V. M., and Hess, L. L.: Outgassing from Amazonian rivers and wetlands as a large tropical source of atmospheric CO2, Nature, 416, 617–
620, 2002.
Roland, F., Vidal, L. O., Pacheco, F. S., Barros, N. O., Assireu, A., Ometto, J. P., Cimbleris, A. C., and Cole, J. J.: Variability of car-bon dioxide flux from tropical (Cerrado) hydroelectric reservoirs, Aquat. Sci., 72, 283–293, 2010.
Rustomji, P., Zhang, X., Hairsine, P., Zhang, L., and Zhao, J.: River sediment load and concentration responses to changes in hydrology and catchment management in the Loess Plateau region of China, Water Resour. Res., 44, W00A04, doi:10.1029/2007WR006656, 2008.
Shi, W.-Y., Tateno, R., Zhang, J.-G., Wang, Y.-L., Yamanaka, N., and Du, S.: Response of soil respiration to precipitation during the dry season in two typical forest stands in the forest-grassland transition zone of the Loess Plateau, Agr. Forest Meteorol., 151, 854–863, 2011.
Striegl, R. G., Dornblaser, M., McDonald, C., Rover, J., and Stets, E.: Carbon dioxide and methane emissions from the Yukon River system, Global Biogeochem. Cy., 26, GB0E05, doi:10.1029/2012GB004306, 2012.
Teodoru, C. R., del Giorgio, P. A., Prairie, Y. T., and Camire, M.: Patterns in pCO2 in boreal streams and rivers of
north-ern Quebec, Canada, Global Biogeochem. Cy., 23, GB2012 doi:10.1029/2008gb003404, 2009.
Tranvik, L. J., Downing, J. A., Cotner, J. B., Loiselle, S. A., Striegl, R. G., Ballatore, T. J., Dillon, P., Finlay, K., Fortino, K., Knoll, L. B., Kortelainen, P. L., Kutser, T., Larsen, S., Laurion, I., Leech, D. M., McCallister, S. L., McKnight, D. M., Melack, J. M., Over-holt, E., Porter, J. A., Prairie, Y., Renwick, W. H., Roland, F., Sherman, B. S., Schindler, D. W., Sobek, S., Tremblay, A., Vanni, M. J., Verschoor, A. M., von Wachenfeldt, E., and Weyhenmeyer, G. A.: Lakes and reservoirs as regulators of carbon cycling and climate, Limnol. Oceanogr., 54, 2298–2314, 2009.
Wallin, M. B., Grabs, T., Buffam, I., Laudon, H., Ågren, A., Öquist, M. G., and Bishop, K.: Evasion of CO2from streams–The
domi-nant component of the carbon export through the aquatic conduit in a boreal landscape, Glob. Change Biol., 19, 785–797, 2013. Wang, F. S., Wang, B. L., Liu, C. Q., Wang, Y. C., Guan, J., Liu, X.
L., and Yu, Y. X.: Carbon dioxide emission from surface water in cascade reservoirs-river system on the Maotiao River, southwest of China, Atmos. Environ., 45, 3827–3834, 2011.
Wang, X., Ma, H., Li, R., Song, Z., and Wu, J.: Sea-sonal fluxes and source variation of organic carbon trans-ported by two major Chinese Rivers: The Yellow River and Changjiang (Yangtze) River, Global Biogeochem. Cy., 26, GB2025, doi:10.1029/2011gb004130, 2012.
Wang, Z., Liu, G., and Xu, M.: Effect of revegetation on soil or-ganic carbon concentration in deep soil layers in the hilly Loess Plateau of China, Acta Ecologica Sinica, 30, 3947–3952, 2010 (in Chinese).
Wehrli, B.: Biogeochemistry: Conduits of the carbon cycle, Nature, 503, 346–347, 2013.
Wu, L. L., Huh, Y., Qin, J. H., Du, G., and van der Lee, S.: Chemical weathering in the Upper Huang He (Yellow River) draining the eastern Qinghai-Tibet Plateau, Geochimi. Cosmochim. Ac., 69, 5279–5294, 2005.
Wu, W., Xu, S., Yang, J., and Yin, H.: Silicate weathering and CO2
consumption deduced from the seven Chinese rivers originating in the Qinghai-Tibet Plateau, Chem. Geol., 249, 307–320, 2008. Xu, J.: Implication of relationships among suspended sediment size, water discharge and suspended sediment concentration: the Yel-low River basin, China, CATENA, 49, 289–307, 2002.
Yao, G. R., Gao, Q. Z., Wang, Z. G., Huang, X. K., He, T., Zhang, Y. L., Jiao, S. L., and Ding, J.: Dynamics of CO2partial pressure
and CO2 outgassing in the lower reaches of the Xijiang River,
a subtropical monsoon river in China, Sci. Total Environ., 376, 255–266, 2007.
Zhang, J., Huang, W. W., Létolle, R., and Jusserand, C.: Major el-ement chemistry of the Huanghe (Yellow River), China: Weath-ering processes and chemical fluxes, J. Hydrol., 168, 173–203, 1995.
Zhang, J., Xu, M., Wang, Z., Ma, X., and Qiu, Y.: Effects of reveg-etation on organic carbon storage in deep soils in hilly Loess Plateau region of Northwest China, Chinese Journal of Applied Ecology, 23, 2721–2727, 2012 (in Chinese).
Zhao, M. X., Zhou, J. B., and Kalbitz, K.: Carbon mineralization and properties of water-extractable organic carbon in soils of the south Loess Plateau in China, Eur. J. Soil Biol., 44, 158–165, 2008.