Research Paper
The Economic Opportunity Cost for the Arab Spring
Countries
Youssra Loukil
a, Sahar Loukil
b, Souhaila Kammoun
c*a
Department of Economics, University of Sfax, Tunisia;
bDepartment of Economics, University of Sfax, Tunisia;
cDepartment of Economics, IHEC, University of Sfax, Tunisia
*Corresponding author:
ssouhaila.kammoun
@
yahoo.fr
Received 20 April 2019; Accepted 15 May 2019; Published 25 May 2019
Abstract
This article examines the effect of political instability on countries caught in such a situation and also by their location. Using an interrupted time series model and an unrestricted error correction model, the indirect economic costs of political unrest are estimated for Tunisia, as an example of the Arab spring countries. Foreign direct investment fell by 17% in Arab countries. Indeed, the Arab Spring countries are the most affected countries in terms of investment as the fall of FDI for Tunisia by 21%. In the same direction, Egypt lost 92% of its FDI since it records $ 0.5 billion in 2011 against $ 6.4 billion in 2010 and also Libya 87% and 65% in Syria .This substantial loss is a warning sign that should be seriously taken into account by politicians and economists from the Middle East and the Arab Union, especially for countries whose resources are already limited.
Keywords: Opportunity cost, military expenditure, GDP, FDI, Arab Spring, political instability, UECM
JEL Classifications: F3, F4, E2, E6
1. Introduction
The misfortune of living in a politically unstable zone is generally supported by the majority of the population because of the economic consequences. In theory, political uncertainty disrupts countries involved in social movements but also neighboring countries by discouraging savings and foreign direct investment through a negative incentive effect, by disrupting trade with other countries and increasing military expenditures (Ades and Chua, 1997). The economic costs of political conflicts bear the direct and indirect costs such as political instability, inefficient resource allocation, income losses due to reduced domestic and foreign investment (Arunatilake et al., 2001). Rising military spending can hinder economic growth by avoiding investment and also deterring savings and resource creation (Deger 1986, Arunatilake and Al-2001, Abu-Bader and Abu-Qarn 2003), 1986; Arunatilake, 2001; Abu-Bader and Abu-Qarn, 2003).
The relationship between military spending and investment in economic growth is well documented. Chen et al. (2014) and Arunatilake et al. (2001) examined the effect of crowding out military spending. In this context, several authors have demonstrated the negative effect of military spending on economic growth, Borensztein et al. (1998), Alfaro et al. (2004), Li and Liu (2005) and Gupta et al. (2014). In addition, numerous studies have confirmed that the current economic and political situation in the Middle East Arab union is unstable, Abu-Bader and Abu-Qarn, 2003), Aizenman and Glick, 2006) and Deger, 1986). The year 2011 will remain in the memory of the citizens of the Arab Spring
and economic growth lost due to political instability and increased military spending. To our knowledge, this study is the first to attempt to estimate the opportunity cost of investment in monetary value of political instability in the Arab Maghreb Union. The remainder of this document is organized as follows: Section 2 reviews the relevant literature, Section 3 presents the data and describes the methodology, Section 4 presents the results and reviews them and Section 5 summarizes the findings.
2. Literature Review
Since 2011, in almost all MENA zone countries, the mass protests significantly affect economic situation by the fall of dictators (Tunisia, Egypt, Libya and Yemen) and by precipitation political reforms in many countries in the region. These changes, in their hasty and improvised realization, without real program or strategy, have not led to real transformations of the regimes in place. Even worse, some countries face an economic collapse (Lybia and Syria). In these cases, we have witnessed the exasperation of infighting, the emergence of unpublished entities (Islamic "state") and real implosions.
To analyze these phenomena, a new combination of sociological approaches and political science appears and frees itself from overarching analyzes - notably geopolitical - to find the social, economic and political logics of the uprisings. The literature review show that political unrest and social movements in the country or in the neighbouring ones had a significant negative impact on a country's economic growth, due to disturbed cycle of production and trade cycle and increased military spending. These are behind the elimination of public investment, private investment and FDI, and modifying economic growth efficiency of investments. In fact, several previous studies support the fact that regional instability disturbs not only the countries involved in the turbulence but also neighboring countries by discouraging saving and investment via a negative incentive effect. Thus, academics and politicians are interested to know the extent to which their respective countries suffer from the neighbor‟s curse in order to apply sound policies and regulatory rules to reduce negative impact on economy and prevent massive impact on social welfare.
The relationship flow from military spending to investment to economic growth is well documented. Several researchers found that military spending affect negatively economic situation resulting from the opportunity cost of lost investment through reduced savings (Abu-Bader and Abu-Qarn (2003), Aizenman and Glick (2006), and Deger (1986)) While others confirmed the positive outcomes for developed countries; ( Omri and Kahouli 2014 a, Gupta et al. (2014), Li and Liu (2005), Alfaro et al. (2004), Borensztein et al. (1998), and Levine and Renelt (1992). They postulate that as military spending increases, higher opportunity costs dominate the relationship. Moreover, Aizenman and Glick (2006) find a nonlinear relationship depending on a threshold level of threat. So, there is a positive effect if the threat is above the threshold level and negative effect if it is under the threshold level. To explain these mixed results, Alptekin and Levine (2012) postulate that for developed countries, there is a positive relationship between military spending and economic growth and then, as these spending increase, higher opportunity costs dominate the relationship. According to emerging economies, our empirical research is one of the few studies that have examined the interrelationship among social unrest and economic growth. Most of previous studies mainly consider the major Asian and Latin
American countries and less attention has been given to smaller emerging countries, especially in Arab Spring countries.
According to the literature review, it is widely accepted that in the host economy foreign direct investment (FDI) is beneficial for economic growth. In fact, according to the neoclassical economy, economic growth is a positive function of FDI, which increases the level and the efficiency of investment (Li and Liu, 2005). The importance of the effect of FDI on economic growth was also examined by Alfaro et al. (2004) and Borensztein et al. (1998). Several studies have shown that while FDI and domestic investment stimulate economic growth, FDI has a very relevant effect if it is strengthened by human capital and thus becomes able to absorb the technologies brought by foreign investors (Borensztein et al., 1998). Li and Liu (2005) found that economic growth is a positive direct function of FDI and domestic investment. In addition, they found a negative indirect function by the interaction of FDI and the technology gap in developing countries, but in all countries, economic growth was a positive indirect function of FDI through the interaction between FDI and FDI human capital. In addition, Durham (2004) has shown that foreign investment has a positive but conditional effect on financial development. In their article titled “Does Foreign direct Investment Generate Economic Growth?”, Jorge Bermejo Carbonell & Richard A. Werner (2018) postulate that because of mixed results, there are gaps remaining in the literature. To fill this gap, they verify whether FDI has enhanced growth in Spain. To do so, they empirically apply an improved model during a specific period. In fact, this period is characterized by a certain increase in FDI. Empirical results show that despite the favorable economic conditions, FDI does not significantly influence economic growth economic growth. These results suggest a call for further fundamental rethinking of other potential factors that could moderate this type of economic relationship. In our paper, we intend to take into consideration these different approaches explaining the relationship between FDI and economic growth and we are aware that every causal relationship could be modified when we consider different contexts and periods especially when we take into account social movements and political unrest like it is the case for Arab Spring countries.
3. Data Analysis
This paper study the conceptual and methodological problems associated with assessing the economic cost of social conflicts and present the evaluation of economic cost of social movements in Arab spring countries based on the approach of Arunatilake et al. (2001). Annual data over a period of time (1996-2017) for the variables required for this study were obtained from various sources: Development Indicators in the World Bank Database, Central Bank of Tunisia. All data has been downloaded mainly for Tunisia unless otherwise indicated. The variables obtained from each source are as follows:
Net inflows of FDI (for all countries)
Net FDI inflows as a percentage of GDP
Military spending
Military expenditure as a percentage of GDP (for all countries)
Household final consumption expenditure per capita
4. Methodology
4.1. Interrupted Panel Data Model
In order to examine the trade effect of social movements, we used the multiple interrupted panel data approach of Lewis-Beck and Alford (1980). Therefore, to investigate the disruption to Arab Spring countries economy caused by social movements and major political crises, this paper follows the Anderton and Carter (2001) methodology of the multiple interrupted panel data approach of Lewis-Beck and Alford (1980) estimated by Generalized least squares (GLS) or maximum likelihood (ML) regression in the presence of autocorrelation, as follows:
Ln (Economic Activity) = a0 + ∑5n=1 (an * λt) + μt (1)
in which Economic Activity represents one of the following variables : FDI net inflows, Military expenditure and GDP. Also in the model, λt represents number of variables; Trend, represents an increasing discrete number for each year for the whole period, starting with 1 for the first year; Revolution level, which is set equal to 1 for the year in which the social revolution begins and for all subsequent years in the time series, and zero for all preceding years; revolution trend, which takes an increasing discrete number for each year during and after the revolution, starting with 1 for the year in which the revolution begins, and zero for all preceding years. In addition, we include others indicators to assess political and social; control of corruption1, government2; political stability3; regulatory4 and rule of law5. Those variables express the country's score on the aggregate indicator, in units of a standard normal distribution, i.e. ranging from approximately -2.5 to 2.5. Table 2 reports the results. As Anderton and Carter (2001) stated, the coefficient of interest is the coefficient on the variable War level.
4.2. Unrestricted Error Correction Modeling
In our paper, we intend to measure economic costs of social movement in Arab Spring Countries following the methodology of Diana Abu Ghunmi (2015) based on the approach of Arunatilake et al. (2001). We model government capital expenditure as a percentage of GDP as a function of military expenditure and foreign investment as follows using the Johansen technique as well as Engle and Granger (1987) specify the existence of at least a dynamic of adjustment between these variables. Johansen's (1992) weak exogeneity test allows us to determine weakly and not weakly exogenous variables and therefore leads us to define the sense of causality between these variables and the dynamics that characterize them. The empirical highlighting of such a dynamic will be following the estimation of the following theoretical specification:
Gov. Capital. Exp=
Expt-1 inv t-1 .Cap Exp t-1 +
(2)
in which Gov. Capital Exp. is government capital expenditure as a percentage of GDP; Δ represents the change in a variable from the preceding period, Military Exp. is military expenditure; For. Inv. is FDI as a percentage of GDP, Revolution Dummy is a dummy variable equal to 1 for each year in which a social revolution occurs in an Arab spring country and 0 for all other years and t is time period.
The time-series proprieties of the data were examined using the augmented Dicky-Fuller test, which showed the non-stationary variables. In order to retain the long-run relationship while minimizing the possibility of estimating spurious relationships, we follow the recommendation of Arunatilake et al. (2001) and we use the unrestricted error correction modeling (UECM) 6 to estimate
Equation 2. Table 3 reports the results.
4.3. Estimated Economic Costs of social movements:
In our study, we measure the indirect economic cost of social movements represented by lost GDP and lost FDI, which is due to a significant increase in public spending on military forces in the Arab Spring countries.
Based on the procedure of Arunatilake et al. (2001), we measure the following coefficients:
The reduction in government capital expenditure
resulting from the increase in military expenditures is calculated from equation 2.
The Differential Capital Coefficient (ICOR): indicates investment as a percentage of GDP / GDP growth rate for each year.
The loss of the GDP growth rate, the hypothetical GDP growth rate, which would have been calculated without the increase in military spending, are estimated on the basis of the ICOR.
The difference between hypothetical GDP and real GDP
is calculated for each year. This amount represents the lost GDP for each year.
5. Discussion of Results
5.1. Economic Activities and the social movements in Arab Spring Countries
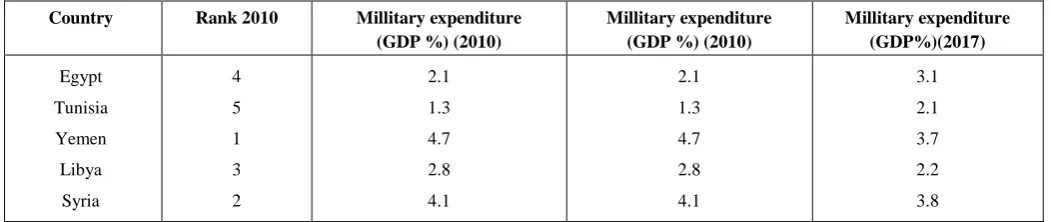
In order to have an insight into the potential effect on a country‟s economy facing social movements. Table 1 shows Arab‟s Spring countries military spending as a percentage of GDP during 1996 to 2017.
Table 1: Ranking of countries by military expenditure
Country Rank 2010 Millitary expenditure
(GDP %) (2010)
Millitary expenditure (GDP %) (2010)
Millitary expenditure (GDP%)(2017)
Egypt
Tunisia
Yemen
Libya
Syria
4
5
1
3
2
2.1
1.3
4.7
2.8
4.1
2.1
1.3
4.7
2.8
4.1
3.1
2.1
3.7
2.2
Notes: This table reports the results of the multiple interrupted panel model estimated for a number of economic variables, based on GLS regression for GDP; annual gross domestic product growth; FDI; foreign direct investment; MILLITARY; military expenditure. P-values are shown in parentheses.
Furthermore, Table 2 shows the results of estimating a multiple interrupted time series model for each of several measures of economic activity for Arab Spring countries. In every model, the intercept measures the level of the dependent economic variable before the beginning of the social movement, the coefficient on
Trend captures the growth rate in economic activity before the social movement, and the coefficients on Revolution level and Revolution trend indicate whether the social movement changed the level of economic activity and its growth rate during and after these movements, (Anderton and Carter, 2001).
It is empirically evident that the turbulence in a country‟s society influenced economic activity in all Arab spring countries. In fact, it‟s obvious that social movements are accompanied with significant loss in terms of gross domestic production.
Figure 1: Tunisian’s Foreign Direct Investment
Figure 2: Tunisian’s Military Expenditure: 1960–2017
Tunisian‟s FDI dramatically fell during 2011 the revolution year and then grew positively afterward. FDI absolute value ignores
economic size. This could be explained through the
implementation of new investment incentives to attract foreign investment. Tunisia enacted a new investment law, which, inter alia, removes profit taxes on major investment projects for 10 years and gives foreign investors more flexibility to transfer funds out of
the country, (UNTCTAD 2017). In fact, the larger the economy is the greater the FDI inflows. To better measure the attractiveness of the economy, the economy size is accounted for FDI performance. Therefore, we present below FDI flows, by region and economy during 2011−2017 for the Arab Spring Countries according to the word investment report of 20177.
Tableau 2: FDI flows, by region and economy, 2011−2016
FDI inflows FDI outflows
Region/economy 2011 2012 2013 2014 2015 2016 2017 2011 2012 2013 2014 2015 2016 2017
Tunisia 0,94 3,45 2,28 2,15 2,24 1,48 2,01 0,04 0,02 0,04 0,04 0,07 0,57 0,14
Libya 0,37 3,06 1,08 -0,18 1,34 1,36 0.21 1.68 1,74 1,07 0,12 2,47 1,52 1.6
Egypt 0,26 0,07 0,10 0,08 0,05 0,06 0,08 -0,20 1,00 1,45 1,50 2,08 2,43 3.14
Yemen 0,17 0,02 0,01 0,02 0,01 0,00 0.01 -1,58 -0,04 -0,33 -0,53 -0,04 -3.08 3.09
Tunisian‟s economic performance deteriorated during the year of the social revolution, for which the reduction was statistically significant. But, it interestingly grew up during the following years. The FDI performance, in terms of growth rate, improved significantly after 2011, the revolution year. This finding is interesting and not expected, given there were several terrorist attacks during following years of revolution. This could be explained by the fact that the army was neutral and supportive of the democratic transition process. Then, there was more FDI into Tunisia from other Arab spring countries because Tunisia was seen as comparatively more stable.
The FDI inflows from after the revolution allow Tunisians economy regaining its pre-revolutionary economic growth rate (GDP). As can be seen in figure 1, Tunisian military spending slightly grew after the revolution. This can be explained by the fact that the army was never the backbone of the Tunisian authoritarian regime; the military did not have to engage in repression in case of social mobilizations against the regime. The Tunisian armed forces were kept out of politics during the authoritarian period, and remained obedient to the regime without meddling in corruption affairs like the police. This separation from politics allowed the army to become one of the most professionalized forces of the Arab world, which partly explains its behavior during the revolution, Audrey Pluta (2012).
But, after the revolution, military expenditure moderately grew up because of terrorist attacks that happened during the years following the revolution. Several researchers have examined the relationship between military spending and the economic environment for example Abu Al-Foul (2014) who studied this relationship and takes the example of Jordan. This author confirmed that military spending has a negative effect on economic growth by crowding out public investment. This result is confirmed with Keynesian theory and the studies of Deger (1986) and Arunatilake et al. (2001). In the case of Tunisia, we note that military spending did not dramatically grow up after the revolution but it did in 2013 to 2016 where it becomes more stable. Tunisia ranks 80th in terms of military spending worldwide. This could be explained in part by the neutral position of the army and the several terrorist attacks following the revolution year. In addition, the Carthage Pact was concluded in July 2016 by nine political parties and representatives the main trade union and employer centers. A government of national unity, representatives of the signatory parties to the pact, was formed in August 2016. The essential components of this pact are: the fight against terrorism and corruption; accelerated growth and employment; control of public finances; setting implementation of an effective social policy; and regional development.
5.2. Social movements and Indirect Economic Costs
The Jasmine Revolution is an exception in the history of Tunisia whose economy is in a transitional phase and has not yet found its balanced growth path given the debate raised especially at the levels of several economic and financial sectors, Alexander (2000) and Villieu (2000). Taking into account the phenomenon of socio-political instability and its impact on investment in Tunisia is still a new field for economic studies. This new data is important for evaluating and proposing guidelines to create a conducive and timely business environment in Tunisia. During this phase, we note that the partial indicator relating to the social climate is a main constraint factor to investment, insofar as social instability is the reason why 20% of companies did not invest in 2017. As a result,
strikes represent supply problems for 8% of companies and have even been behind the suspension of activity during the first half of 2017 for 2% of the companies surveyed. According to the statistics, it is stated that 45% of the companies surveyed attribute the suspension of production mainly to the movement of strikes and 36% to the insecurity which has been absent during the revolution and for this the costs of the companies become more and more heavy. In this context, losses proliferated by strikes are estimated at tions as only 19% of Tunisian companies have declared that they plan to hire imore than 10% of turnover by 43% of companies affected by these repercussions (ITCEQ, 2012). Political uncertainty is having an effect on employment expectan 2018.
Table 3: Reasons for falling investment in Tunisia (in %)
Reasons Percent
Strike of employee 45
Insecurity and uncertainty 36
Supply deficit 27
Insufficient Demand 24
Collateral effects of revolution 20
Source: (ITCEQ, 2012)
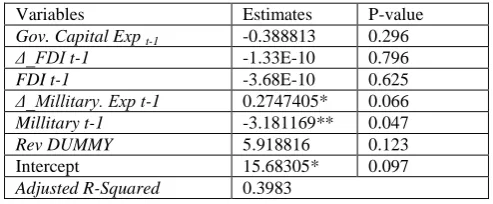
According to Moreno and Trehan (1997) a country‟s location matters when we measure economic costs of conflicts. To be able to assess such economic opportunity costs resulting from lost investment caused by social movements, we start to estimate Government Capital Expenditure (see equation 2). The estimated results are reported in Table 3.
Table 4: Unrestricted Error Correction Estimation8 of the Government Capital Expenditure Model
Variables Estimates P-value
Gov. Capital Exp t-1 -0.388813 0.296
Δ_FDI t-1 -1.33E-10 0.796
FDI t-1 -3.68E-10 0.625
Δ_Millitary. Exp t-1 0.2747405* 0.066
Millitary t-1 -3.181169** 0.047
Rev DUMMY 5.918816 0.123
Intercept 15.68305* 0.097
Adjusted R-Squared 0.3983
Notes: This table reports the results of estimating Equation 2 using UECM. Gov. Capital Exp. is government capital expenditure as a percentage of GDP; Δ represents the change in a variable from the preceding period, Military Exp. is military expenditure as a percentage of GDP; FDI is foreign direct investment as a percentage of GDP, and Rev Dummy is a dummy variable equal to 1 for each year in which a major social movement occurs in the country but 0 for all other years. The augmented Dicky-Fuller (ADF) test is used to test for stationarity. P-values are also reported.
6. Concluding Remarks
This study has examined the effect of political instability and social movements on a number of measures of economic activity, using Tunisia as an example country. The analysis has shown Tunisian‟s military spending its FDI and its GDP inflows seem to respond to social movements. The positive effect of the revolution on military spending has been confirmed, and the GDP lost as a result of the social movement has been estimated. As a robustness test, we confirm these results through the positive effect of the respect of the rule of law on GDP while it significantly reduces military expenditure. In addition, foreign direct investment significantly grew up through government efficiency.
These findings have important implications for politicians and economists in Tunisia, in particular, and in the Arab Spring countries in general. They should design effective economic policies to counter the adverse effects of the social movement in order to revive their economies and boost democratic process.
Notes
1. Control of Corruption captures perceptions of the extent to which public power is exercised for private gain, including both petty and grand forms of corruption, as well as "capture" of the state by elites and private interests. Estimate gives the country's score on the aggregate indicator, in units of a standard normal distribution, i.e. ranging from approximately -2.5 to 2.5. 2. Government Effectiveness captures perceptions of the
quality of public services, the quality of the civil service and the degree of its independence from political pressures, the quality of policy formulation and implementation, and the credibility of the government's commitment to such policies. Estimate gives the country's score on the aggregate indicator, in units of a standard normal distribution, i.e. ranging from approximately -2.5 to 2.5.
3. Political Stability and Absence of Violence/Terrorism measures perceptions of the likelihood of political instability and/or politically-motivated violence, including terrorism. Estimate gives the country's score on the aggregate indicator, in units of a standard normal distribution, i.e. ranging from approximately -2.5 to 2.5. 4. Regulatory Quality captures perceptions of the ability of
the government to formulate and implement sound policies and regulations that permit and promote private sector development. Estimate gives the country's score on the aggregate indicator, in units of a standard normal distribution, i.e. ranging from approximately -2.5 to 2.5. 5. Rule of Law captures perceptions of the extent to which
agents have confidence in and abide by the rules of society, and in particular the quality of contract enforcement, property rights, the police, and the courts, as well as the likelihood of crime and violence. Estimate gives the country's score on the aggregate indicator, in units of a standard normal distribution, i.e. ranging from approximately -2.5 to 2.5.
6. Vector or multivariate modeling allows to study the joint dynamics of several series: When the series are stationary, this is a generalization of the study of AR processes. The popularity of autoregressive vector (VAR) models is related to their flexibility of use and
their ability to test economic assumptions. When the series are not stationary but cointegrated, vector error correction models (VECM) make it possible to specify long-term stable relationships while at the same time analyzing the short-term dynamics of the variables under
consideration. Structural VAR models (SVAR)
complement this multivariate approach.
7. United Nations Conference on Trade And Development (UNCTAD, 2017)
8. It's called unrestricted because all the long run relationship'varaiables are specified. So, there is no restriction about the presence of any variables. So, when you replace this long run relationship by its Residuals, the model becomes ECM because the ECT (Error Correction Term) corrects the disequilibrum happened in a short period, by bringing the situation to a steady statement.
References
[1] AbuAl-Foul, B.M., (2014), „Military spending and economic growth: Evidence from Jordan‟, Working paper SBAWPS: 19-04/2014, American University of Sharjah, Sharjah, United Arab Emirates.
[2] Abu-Bader, S., Abu-Qarn, A.S, (2003), „Government expenditures, military spending and economic growth: Causality evidence from Egypt, Israel, and Syria‟, Journal of Policy Modeling, 25(6-7), 567–583.
[3] Ades, A., Chua, H., (1997), „Thy neighbor‟s curse: Regional instability and economic growth‟, Journal of Economic Growth, 2(3), 279–304.
[4] Aizenman, J., Glick, R., (2006), „Military expenditure, threats, and growth‟, Journal of International Trade and Economic Development 15(2), 129–155.
[5] Al khatib, H., Altaleb, G., Alokor, S., (2012), „Economical determinants of domestic Investment‟, European Scientific Journal, 8(7), 1–17.
[6] Alfaro, L., Chanda, A., Kalemli-Ozcan, S., Sayek, S., (2004), „FDI and economic growth: The role of local financial markets‟, Journal of International Economics 64 (1), 89–112.
[7] Alptekin, A., Levine, P., (2012), „Military expenditure and economic growth: A meta-analysis‟, European Journal of Political Economy 28(4), 636–650.
[8] Anderton, C., Carter, J.R., (2001), „The impact of war on trade: An interrupted time-series Study‟, Journal of Peace Research, 38(4), 445–457.
[9] Arunatilake, N., Jayasuriya, S., Kelegama, S., (2001), „The economic cost of the war in Sir Lanka‟, World Development, 29(9), 1483–1500.
[10] Barbieri, K., Levy, J., (1999), „Sleeping with the enemy: The impact of war on trade‟, Journal of Peace Research 36(4), 463–479.
[11] Borensztein, E., De Gregorio, J., Lee, J-W., (1998), How does foreign direct investment affect economic growth?‟, Journal of International Economics, 45(1), 115–135. [12] Campante, F.R., Chor, D., (2012), „Why was the Arab
world poised for revolution?‟ Schooling, economic opportunities, and the Arab Spring‟, Journal of Economic Perspectives. 26(2):167-187
[14] Dakurah, A., Davies, S., Sampath, R., (2001), „Defense spending and economic growth in developing countries: A causality analysis‟, Journal of Policy Modeling 23(6), 651–658.
[15] Dabla-Norris, E., Brumby, J., Kyobe, A., Mills, Z., Papageorgiou, C., (2012), „Investing in public investment: An index of public investment efficiency‟, Journal of Economic Growth.
[16] Deger,S., (1986), „Economic development and defense expenditure‟, Economic Development and Cultural Change, 85(1), 179–196.
[17] Durham, J.B., (2004), „Absorptive capacity and the effects of foreign direct investment and equity foreign portfolio investment on economic growth‟, European Economic Review, 48(2), 285–306.
[18] Ghunmi., (2015), „The Economic Opportunity Cost for Countries Located in Crisis Zones: Evidence from the Middle East, Research in International Business and Finance, 2016, vol. 36, issue C, 532-542.
[19] Granger, C.W.J. and Hyung, N. (2004), "Occasional structural breaks and long memory with application to the S&P500 absolute stock returns", Journal of Empirical Finance, Vol. 11, No.3, pp.399–421.
[20] Grobar, L., Gnanaselvam,S., (1993), „The economic effects of the Sri Lankan Civil War‟, Economic Development and Cultural Change, 41(2), 395–405. [21] Gupta, S. Kangur, A., Papageorgiou, C., Wane, A.,
(2014), „Efficiency-adjusted public capital and growth‟, World Development, 57, 164–178.
[22] Johansen S., (1995), "Likelihood-Based Inference in Cointegrated Vector Autoregressive Models". Oxford University Press, Oxford.
[23] Levine, R., Renelt, D., (1992), „A sensitivity analysis of cross-country growth regressions‟, The American Economic Review, 82(4), 942–963.
[24] Lewis-Beck, M., Alford, J., (1980),‟ Can government regulate safety? The coal mine example‟, American Political Science Review, 74(3), 745–756.
[25] Li, X, Liu, X., (2005), „Foreign direct investment and
economic growth: An increasingly endogenous
relationship‟, World Development, 33(3), 393–407. [26] Moreno, R., Trehan, B., (1997), „Location and the
growth of nations‟, Journal of Economic Growth, 2 (4), 399- 418.
[27] Organisation for Economic Co-operation and
Development (OECD), (2013), investment policy reviews: Jordan 2013. OECD Publishing.
[28] Omri, A., Kahouli, B., (2013), in press. The nexus between foreign investment, domestic capital and economic growth: Empirical evidence from the MENA
region, Research in Economics,
http://dx.doi.org/10.1016/j.rie.2013.11.001i.
[29] Levine, R., Renelt, D., (1992), „A sensitivity analysis of cross-country growth regressions‟, The American Economic Review, 82(4), 942–963.
[30] Lewis-Beck, M., Alford, J., (1980), „Can government regulate safety? The coal mine example‟, American Political Science Review,
[31] Li, X, Liu, X., (2005), „Foreign direct investment and
economic growth: An increasingly endogenous
relationship‟, World Development.
[32] Moreno, R., Trehan, B., (1997), „Location and the growth of nations‟, Journal of Economic Growth.
Organisation for Economic Co-operation and
Development (2013), OECD investment policy reviews: Jordan 2013. OECD Publishing,