An Adaptive Test for Exponentiality Based on Empirical
Quantile Function
Mbanefo S. Madukaife
Department of Statistics, University of Nigeria, Nsukka, Nigeria
Abstract
A new technique for testing whether or not a set of data is drawn from an exponential distribution is proposed in this paper. It is based on the equivalence property between kth order statistic and the pth quantile of a distribution. The critical values of the test were evaluated for different sample sizes through extensive simulations. The empirical type-I-error rates and powers of the proposed test were compared with those of some other well known tests for exponentiality and the result showed that the proposed technique can be recommended as a good test for exponentiality.Keywords
Exponentiality, kth order statistic, Sample quantile function, Empirical critical value, Empirical power1. Introduction
One of the most important distributions that are mostly used in statistical analysis is the exponential distribution. Its importance is often seen in lifetime modelling, reliability theory, failure mechanism of systems, queuing theory and renewal processes. As a result of this wide application, several characterizations of the exponential distribution have been discovered in the literature. Some of them include the memory-less property, constant hazard rate property and closed form distribution function.
In statistical data analysis, the problem of testing the goodness of fit of the data set to a known statistical distribution has always been an important challenge. The importance of goodness of fit cannot be overemphasized. Most parametric statistical methods are not robust to distributional assumptions, hence the goodness of fit test in order to ensure appropriateness of methods and acceptability of results. Suppose that X is a non-negative random variable with cumulative distribution function (cdf) given by
0( ) 1 ; 0; 0
x
F x e x and probability density function (pdf) f0( , )x ex; x0; 0. Let a random sample x , x , ..., x1 2 n be drawn from an unknown distribution with cdf F x( ) and pdf f x( ). The problem of goodness of fit test for exponentiality is that of testing the hypotheses:
0: ( ) 0( ) 1: ( ) 0( )
H F x F x vs H F x F x (1)
* Corresponding author:
[email protected] (Mbanefo S. Madukaife) Published online at http://journal.sapub.org/statistics
Copyright©2019The Author(s).PublishedbyScientific&AcademicPublishing This work is licensed under the Creative Commons Attribution International License (CC BY). http://creativecommons.org/licenses/by/4.0/
This problem has drawn the attention of many researchers and applying various characterizations of the exponential distribution, several of such tests have been proposed in the literature. Some of them include Gnedenko, Belyayev and Solovyev [1], Harris [2], Gail and Gastwirth [3], Lin and Mudholker [4], Deshpande [5], Cox and Oakes [6], Kochar [7], Epps and Pulley [8], Baringhaus and Henze [9,10], Henze [11], Henze and Klar [12], Henze and Meintanis [13,14], Baratpour and Habibirad [15], Volkova and Nikitin [16], Sadeghpour, Baratpour and Habibirad [17], Ahrari, Habibirad and Baratpour [18] and many other tests.
The literature has been dominated especially in the recent times by tests presented as functional representing distance measures between two functions. For instance, different authors have obtained test statistics as distance measures between empirical and theoretical distribution functions of the exponential distribution. Such tests include the Kolmogorov – Smirnov and the Anderson – Darling tests for exponentiality.
The tests in this class are quite appropriate and have appreciable power performances. This is because of the uniqueness property of the distribution function of the exponential distribution which has a closed form expression. Another closed form characterization of the exponential distribution which also has the uniqueness property is the quantile function of the distribution. In this paper, the empirical quantile function is obtained and a functional which measures the squared distance between empirical and the theoretical quantile functions of the exponential distribution is proposed as an appropriate test statistic for assessing the exponentiality of data sets.
2. The Proposed Statistic
exponentially distributed with pdf f x( , ) ex; 0; 0
x and cdf F x( ) 1 ex;x0; 0 . The quantile function Q p( ) is given by:
1 log(1 )
( ) ( ) p ; (0, 1)
Q p F p p
(2)
If X is standardized (rescaled) by Y X / such that the parameter in the resulting variable Y is equal to 1, then the pdf and the cdf will respectively be fy( )y ey;y0
and Fy( )y 1 ey, and the quantile function associated
with Fy( )y is given by: 1
( ) ( ) log(1 ); (0, 1)
y y
Q p F p p p (3)
Now, for a random sample x , x , . . ., x1 2 n obtained from an unknown non-negative continuous distribution, the order statistics obtained from the random sample are
1:n, 2:n, . . ., n n:
X X X where Xj n: is the jth smallest
observation in the sample of n observations. That is, 1:n 2:n . . . n n:
X X X . Xu and Miao [19] have stated that the
pth quantile of a distribution can be estimated by either the sample pth quantile of the distribution or the appropriate kth order statistic of a sample drawn from the distribution. The sample pth quantile of a distribution, denoted by ˆp is obtained as the inverse of the sample distribution function, also known as the empirical distribution function, which is denoted by Fn( )x . For p(0, 1),
1
ˆ ( ) inf : ( )
p Fn p x F xn p
(4)
where n( ) 1 n 1 ( )
j
F x n
I X x which is the number of observations in the random sample that are less than or equal to x divided by n. Let the number of observations in the sample that are less than or equal to x be j. Then( ) / n
F x j n . Hence, p(0, 1) can be approximated by /
j n. Madukaife [20] has shown that the approximation
holds, provided j/np, Xj n: ˆp a s.. 0, see also Xu
and Miao [19] and Serfling [21].
From the foregoing, the sample pth quantile of a distribution can be given as Xj n: ;p(0, 1) where
/
p j n. The problem now is to obtain a distance function
j n: , x( ) ;
D X Q p p j/ ,n j1, 2, . . .,n which for each j
measures the distance apart between the sample and population quantiles. This function is adapted from Madukaife [22] and Madukaife and Okafor [23,24] as the sum of squared deviations of the sample quantiles from the population quantiles. For the exponentiality test, this is given by:
1
2
: , ( ) : log(1 )
j
n
j n x j n
D X Q p X p
(5)In order to obtain a measure that does not depend on , the parameter of the exponential distribution, the sample observations are first rescaled (standardized) by
/ j j X
y x where Xn1
nj1xj . Then the order statistics of the rescaled observations are obtained as1:n, 2:n, . . ., n n:
Y Y Y such that Yj n: is the jth order statistic of the rescaled observations. Also, estimating p by j n/ will obviously give inappropriate results especially at the extreme order statistics. van der Vaart [25] has shown that
1 : ( )
n j n
F p Y for p j 1, j
n n
. Taking the average of the
limits in the interval of p for which the sample quantile of a distribution equals the jth order statistic gives p j 0.5
n
.
Therefore, an appropriate statistic for testing the goodness of fit for exponentiality of a data set is given by:
: 1
2
( 0.5)
log n
j n j n
n j
M Y
n
(6)The statistic in (6) is both affine invariant and consistent against all fixed alternatives. Its affine invariance stems from the fact that it is based on rescaled null distribution and hence does not depend on the parameter . Also, its consistency against any fixed alternative is guaranteed since the quantile function of the null distribution is unique. The test rejects null hypothesis of exponentiality for large values of the statistic Mn.
3. Empirical Critical Values of the Test
– values of the test through extensive bootstrapping. This means that for any sample size situation, the empirical p – value is obtained which will be compared with the appropriate level of significance for the test in order for judgment to be passed on the rejection or otherwise of the null hypothesis of exponentiality. With this, applicability of this statistic is always guaranteed.
In this paper, the empirical critical values of the proposed statistic are evaluated at five different levels of significance and 11 different sample sizes. The levels of significance are
= 0.005, 0.01, 0.025, 0.05 and 0.1 while the sample sizes are n = 5 (5) 50 (50) 100. In each of the sample size situations, 100,000 samples are generated from the standard exponential distribution. In each of the generated samples, the value of the statistic is evaluated, resulting in 100,000 values of the statistic. The - level critical value of the test is obtained as the 100(1) percentile of the values. The percentiles are presented in Table 1.
Table 1. Empirical critical values of the Mn statistic
n\ 0.005 0.01 0.025 0.05 0.1
5 10 15 20 25 30 35 40 45 50 100
4.0608 8.5222 11.1794 13.0516 14.3664 15.2471 17.1985 17.9056 18.3010 19.1063 22.3322
3.3521 6.5153 8.6922 10.1153 11.3674 11.7179 13.0578 13.4685 13.7384 14.3806 17.0592
2.3367 4.2922 5.6115 6.5844 7.3182 7.8203 8.4084 8.9631 9.0777 9.6394 11.5452
1.7336 3.0175 3.9010 4.5808 5.1300 5.4890 5.8952 6.2727 6.5047 6.8194 8.3467
1.2946 2.1828 2.7762 3.2624 3.6272 3.9435 4.2098 4.4438 4.6275 4.8497 6.0563
4. Empirical Power Studies
Assessing the relative power of the statistic proposed in this paper involves comparing its power performance with the powers of some other good tests for exponentiality in the literature. These good tests in the literature (also regarded as competing tests) which are considered in this work are presented in what follows.
The Kolmogorov – Smirnov KSn Test
Let Xj be the jth observation of a random sample of size
n and let Yj Xj/ˆn, where 1
1
ˆ n
n X n j Xj
, bethe scaled form of the observation Xj . Also, let
1 exp
j j
Z Y be the transformed form of
; 1, 2, . . ., j
Y j n and Zj n: be the jth order statistic of the transformed data. The Kolmogorov – Smirnov (K-S) test rejects the null hypothesis of exponentiality for large values of the statistic given by:
: :
1 1
max max ; max ( 1)
n j n j n
j n j n
KS j n Z Z j n
max KSn,KSn
,
where :
1
max
n j n
j n KS j n Z
and
: 1
max ( 1)
n j n
j n
KS Z j n
.
The Anderson – Darling ADn Test
Like the Kolmogorov – Smirnov KSn test, this goodness of fit procedure rejects the null hypothesis of exponentiality for large values of the statistic which is given by:
1
2 1 2 1
2 1 1
2 2
n
n j j
j
j j
AD n InZ In Z
n n
where Zj has its usual meaning.
The COn Test of Cox and Oakes [6]
Cox and Oakes [6] developed a two-sided test of exponentiality whose statistic:
1
1 ; 1, 2,...,
j
n
n j j
CO n Y InY j n
where Yj remains the scaled form of Xj. The statistic
rejects the null hypothesis of exponentiality for both small and large values of COn.
The BHn a, Test of Baringhaus and Henze [9]
With an appropriate choice of a smoothing parameter “a”, Baringhaus and Henze [9] proposed a test of exponentiality which rejects the null hypothesis for a large value of the statistic:
2
0
, 1 '( ) ( ) exp
n a n n
BH n t t t at dt
2 2 3
1
, ( ) ( ) ( )
(1 )(1 ) 2 2
1
j k j k j k
n
j k j k j k j k
j k
j k Y Y a Y Y a Y Y a
Y Y Y Y Y Y Y Y
n Y Y a
The test is said to be consistent against any distribution with positive finite mean .
The
T
n Test of Baratpour and Habibirad [15]Baratpour and Habibirad [15] obtained an estimator of the cumulative residual entropy (CRE) of a distribution F
and by using the cumulative Kullback – Leibler (CKL) divergence between two distributions, proposed the statistic
n
1 1 1 1 2 1: : 1 2 2 ;1 2 j j j n j nj n j n n j j n n j j n j X n j n j
In X X
n n
X
T j n
X X
The null hypothesis of exponentiality is rejected for large values of Tn and the statistic is said to be consistent against any fixed alternative.
The Tr n, Test of Sadeghpour, Baratpour and Habibirad [17]
Sadeghpour, Baratpour and Habibirad [17] improved on the work of Baratpour and Habibirad [15] by introducing a statistic that is based on the equilibrium distance using the Renyi divergence. The statistic is given as:
1
1: :
, 0
( 1) ( 1)
exp exp
r n
j n j n
r n
n n
j
r X r X
n j T
n X X
The test is affine invariant and rejects the null hypothesis for large values of the statistic.
A total of 10,000 samples in each case of sample size,
n = 10, 25, 50 and 100 are generated from six different distributions with different parameter values. The distributions include:
The standard exponential distribution with pdf
( ) x; 0
f x e x , E(1).
Weibull distribution with probability function, f x( ) 1
exp( );
x x
1;x0, W( ,1) .
Gamma distribution with probability function, f x( )
1 1
( ) x exp( x); 1;x 0
, G( ,1) .
Uniform distribution in the interval (0, 1), U(0,1). Beta distribution with probability function, f x( )
0 1 1 1
1
0 1
( , ) (1 ) ; 0; 0,
B x x x B( 0, 1). The standard lognormal distribution with pdf,
1 2 2
( ) ( 2 ) exp (log ) / 2 ;
f x x x 1,
(0,1)
LN .
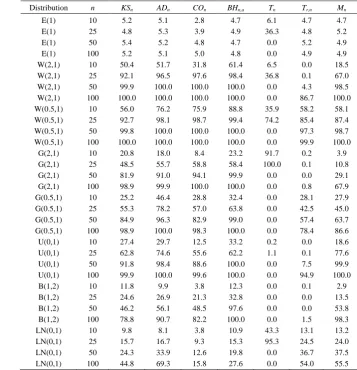
Table 2. Empirical power comparison of tests for exponentiality at = 0.05
Distribution n KSn ADn COn BHn,a Tn Tr,n Mn
The values of the seven statistics being compared are evaluated in each of the 10,000 simulated samples and the power of each test obtained as the percentage of the 10,000 samples that is rejected by the statistic at 5 percent level of significance. The power performance of each of the tests is presented in Table 2.
From Table 2, it will be observed that the proposed test has a good control over type-1-error along with the other competing tests except the Tn. This is because none of
the tests except the Tn gave the power under the null distribution of exponentiality greater than 5.4% and since the power in this case supports the null hypothesis, it is also known as the empirical type-1-error rate. Lack of control over the type-1-error is a serious deficiency of a goodness of fit statistic. In addition, the proposed test equally does not conserve the type-1-error as all its values range from 4.5% to 5.4% as against the Tn and the COn.
Distributions alternative but contiguous to the exponential distribution may be classified according to their hazard functions as those with increasing hazard rate, those with decreasing hazard rate and those with non-monotone hazard rate. This study considers all these classes of distributions and the proposed statistic maintained an appreciable power in all the classes. In each of the alternative distributions, the power performance of the statistic continued to increase as the sample size increased. These show that the proposed statistic is both omnibus and consistent.
Compared to the power performances of the other statistics in this paper, the proposed statistic is no doubt not the best as no test can be adjudged to be the best. However, the power performances show that it is very competitive especially at large samples.
5. Conclusions
It has been observed from the foregoing that there is no shortage of tests for exponentiality in the literature. Some of these tests however have been observed to be more effective in some classes of distributions alternative to the exponential than some other classes. Also, some are found to be deficient with respect to some properties of a good goodness of fit procedure. The basic properties of a good statistic for a goodness of fit test are affine invariance, consistency, good control over type-1-error and generally good power performance. The test statistic proposed in this paper satisfies all these qualities. Hence, the statistic Mn can be recommended as a good test for assessing exponentiality of a data set.
REFERENCES
[1] B. V. Gnedenko, YU. K. Belyayev and A. D. Solovyev, Mathematical Models of Reliability Theory, Academic Press, 1969.
[2] C. M. Harris, A note on testing for exponentiality. Nav. Res. Logist. Quarterly, vol. 23, pp. 169-175, 1976.
[3] M. H. Gail, and J. L. Gastwirth, A scale – free goodness – of – fit test for the exponential distribution based on the Gini statistic, J. Roy. Statist. Soc. B, vol. 40, pp. 350–357, 1978. [4] C. C. Lin, and G. S. Mudholker, A test of exponentiality
based on the bivariate F distribution, Technometrics, vol. 22, pp. 79–82, 1980.
[5] V. J. Deshpande, A class of tests for exponentiality against increasing failure rate average alternatives, Biometrika, vol. 70, pp. 514–518, 1983.
[6] D. R. Cox and D. Oakes, Analysis of survival data, Chapman and Hall, 1984.
[7] S. C. Kochar, Testing exponentiality against monotone failure rate average, Communications in Statistics – Theory and Methods, vol. 14, pp. 381–392, 1985.
[8] T. W. Epps and L. B. Pulley, A test of exponentiality vs. monotone – hazard alternatives derived from the empirical characteristic function, J. Roy. Statist. Soc. B, vol. 48, pp. 206–213, 1986.
[9] L. Baringhaus and H. Henze, A class of consistent tests for exponentiality based on the empirical Laplace transform, Ann. Inst. Statist. Math., vol. 43, pp. 551–664, 1991.
[10] L. Baringhaus and H. Henze, Tests of fit for exponentiality based on a characterization via the mean residual life function, Statist. Papers, vol. 41, pp. 225–236, 2000.
[11] N. Henze, A new flexible class of omnibus tests for exponentiality, Comm. Statist. – Theo. Meth., vol. 22, pp. 115–133, 1993.
[12] N. Henze and B. klar, Testing exponentiality against the L class of life distributions. Math. Meth. Statist., vol. 10, pp. 232–246, 2001.
[13] N. Henze and S. G. Meintanis, Tests of fit for exponentiality based on the empirical Laplace transform, Statistics, vol. 36, pp. 147–161, 2002a.
[14] N. Henze and S. G. Meintanis, Goodness – of – fit tests based on a new characterization of the exponential distribution, Comm. Statist. – Theo. Meth., vol. 31, pp. 1479–1497, 2002b. [15] S. Baratpour and A. H. Habibirad, Testing goodness – of – fit for exponential distribution based on cumulative residual entropy, Comm. Statist. – Theo. Meth., vol. 41, pp. 1387–1396, 2012.
[16] K. Yu. Volkova and Ya. Yu. Nikitin, Exponentiality tests based on Ahsanullah’s characterization and their efficiency, Journal of Mathematical Sciences, vol. 204, No. 1, pp. 42-54, 2015.
[17] M. Sadeghpour, S. Baratpour and A. Habibirad, Exponentiality test based on Renyi distance between equilibrium distributions, Communications in Statistics - Simulation and Computation, 2017,
DOI: 10.1080/03610918.2017.1366514.
[19] S. Xu and Y. Miao, Limit Behaviors of the Deviation Between the Sample Quantiles and the Quantile, Filomat, vol. 25 no. 2, pp. 197-206, 2011.
[20] M. S. Madukaife, An empirical examination of the asymptotic normality of the kth order statistic, International Journal of Statistical Distributions and Applications, vol. 4, no. 4, pp. 68-73. 2018, doi: 10.11648/j.ijsd.20180404.11.
[21] R. J. Serfling, Approximation Theorems of Mathematical Statistics, New York: John Wiley and Sons Inc., pp. 74-89, 1980.
[22] M. S. Madukaife, A new affine invariant test for multivariate normality based on beta probability plots, Journal of the Nigerian Statistical Association, vol. 29, pp. 58-70, 2017.
[23] M. S. Madukaife and F. C. Okafor, A powerful affine invariant test for multivariate normality based on interpoint distances of principal components, Communications in Statistics - Simulation and Computation, 47:5, 1264-1275, 2018, DOI: 10.1080/03610918.2017.1309667.
[24] M. S. Madukaife and F. C. Okafor, A new large sample goodness of fit test for multivariate normality based on chi squared probability plots, Communications in Statistics - Simulation and Computation, vol. 48, no. 6, 1651-1664, DOI: 10.1080/03610918.2017.1422749.