!
∀#∃∀ %&∋% ∋&
&&((& )% ∗+
∋#,,) %),−.∃/,
Making Software Cost Data Available for Meta-Analysis
Carolyn Mair and Martin Shepperd
Empirical Software Engineering Research Group
Bournemouth University, UK
{
cmair, mshepper
}
@bmth.ac.uk
Abstract
In this paper we consider the increasing need for meta-analysis within empirical software engineering. However, we also note that a necessary precondition to such forms of analysis is to have both the results in an appropriate format and sufficient contextural information to avoid misleading inferences. We consider the implications in the field of soft-ware project effort estimation and show that for a sample of 12 seemingly similar published studies, the results are diffi-cult to compare let alone combine. This is due to different reporting conventions. We argue that a protocol is required and make some suggestions as to what it should contain.
Keywords: meta-analysis, software effort estimation,
soft-ware project data.
1
Introduction
In recent years there have been exhortations from many quarters to conduct empirical studies in order that our un-derstanding of software engineering might be based upon real world evidence. We now find ourselves in the inter-esting position of possessing this evidence and needing to tackle the next step, namely, how to construct a body of knowledge, particularly when not all evidence is consistent. This process of forming a body of knowledge is generally referred to as meta-analysis. It is an essential activity if we are to have any hope of making sense of, and utilising, re-sults from our empirical studies.
Meta-analysis has been defined as a “systematic proach to identifying, appraising, synthesizing and (if ap-propriate) combining the results of relevant studies to arrive at conclusions about a body of research” [32]. Conclusions from a meta-analysis attempt to explain why results from individual studies differ. In addition, meta-analyses provide practitioners with an objective view of the literature through the combination of domain insight with quantitative results [8]. Meta-analysis has been suggested by a number of re-searchers as a method of improving understanding of
em-pirical software engineering results [2, 10, 17, 22, 25], but these suggestions are generally accompanied by reports of heterogeneity of studies and problems with the format and provision of data. In addition, the main focus has been upon experimental software engineering. Another actively re-searched area is cost modelling where the problem is recon-ciling results from different studies using various data sets and prediction techniques. Since the problem is as much one of reconciliation as of shortage of studies, we propose that some form of meta-analysis is in order.
Naturally, meta-analysis is not unique to software engi-neering and indeed is a commonplace activity in, say, epi-demiology. Nevertheless, meta-analysis is quite controver-sial and many concerns have been articulated, see for exam-ple [27].
The remainder of this paper is organised as follows. The next section reviews different approaches to meta-analysis and how this might relate to software engineering. We then move onto the specific field of software project effort esti-mation and consider the implications of meta-analysis upon the way we present our empirical results. We show for a sample of 12 empirical studies drawn from two journals be-tween 1999 and 2003 that meta-analysis is greatly hindered by the lack of essential information. This is followed by a discussion of the minimal required information and a stan-dard template proposed. We conclude by considering the prospects for this type of analysis in the field of empirical software engineering.
2
Related Work
• narrative review articles and bibliometric analysis
• quantitative analysis of published results including sta-tistical and meta-level learning analyses
• re-analysis or pooled analysis of published results
• prospectively planned meta-analysis
We briefly consider each in turn.
Review articles: provide a qualitative summary of
pub-lished results. However, without an a priori strict protocol for the review, narrative reviews are influenced by publica-tion bias [6]. That is, studies which have non-significant or negative results are published less frequently than positive studies. In addition, there exists the ‘file drawer problem’ [26], in which unpublished results are thought to be ‘tucked away’ in a researcher’s filing drawer and therefore excluded from the review. For example, replication studies frequently remain unpublished internationally because they may add little to existing knowledge. The result is therefore a re-view of material determined by subjective judgement. To remedy this, Weed [35] published guidelines to enhance re-view quality. He emphasised the need for clear and focused topic definition, criteria for inclusion and exclusion, and the importance of locating all relevant published and unpub-lished studies. Furthermore, characteristics and results of each study should be described, tabulated and provided in graphical form to clearly illustrate heterogeneity.
In contrast to the qualitative narrative review described above, a quantitative review of a body of literature is termed a bibliometric analysis. Statistical methods are used to re-veal the historical development of subject fields and patterns of authorship, publication and usage in the analysis. Biblio-metric assessment of research performance is not without problems either as it is based on a central assumption that ‘scientists who have to say something important, publish their findings vigorously in the open, international litera-ture’ [34]. It is therefore subject to bias from peer-review and expert judgement of what constitutes quality.
Quantitative analysis: of published results including
sta-tistical and meta-level learning analysis aim to calculate a quantitative pooled estimate of the effect of interest and can be performed without co-operation or agreement from other study groups. These approaches not only suffer from the same limitations as reviews, but also from the lack of ho-mogeneity of study design, data collection methods, and definition of variables. When only published data are avail-able, the degree of heterogeneity can only be assessed by means of a sensitivity analysis. Where there is high het-erogeneity, meta-analysis results can be unstable and unre-liable and therefore, in such cases, should be treated with extreme caution. Quantitative analysis can be conducted using statistical or machine learning (ML) methods such as
case-based reasoning, neural nets and rule induction. The latter is known as meta-level learning.
Meta-level learning aims to find a model to explain the results from the different studies inductively. For example, an arbitrary ML algorithm applied to empirical data can pro-vide insight into the relationship between the performance of different ML algorithms and characteristics of the data set [33]. Typically this relationship is found using attribute-driven algorithms for rule induction by means of choosing a fixed set of attributes that describe the data sets. The result is data set characteristics that are measured across the entire data set, with a loss of individual information. Other meth-ods to help algorithm selection have been developed, but assessing the most appropriate is problematic. Error rate is frequently used to assess algorithm performance. How-ever, it is not sufficient to consider accuracy in isolation: explanatory value and configurability or are also important [21, 30].
As with meta-analytical approaches, in order to achieve these outcomes from meta-level learning, data from indi-vidual studies need to be made available in a standardised format that enables cross comparison. Some disadvantages associated with quantitative meta-analyses can be reduced if individual data from all studies are available. This ap-proach, known as re-analysis or pooled analysis of pub-lished results, is described below.
Pooled analysis: is enabled by access to individual data,
the inclusion of unpublished data, and co-operation between different research centres. In combination these allow in-vestigators to undertake a less biased analysis. The re-analysis should include criteria for inclusion or exclusion of studies, definition of the variables, and new statistical mod-elling. New hypotheses might be generated which could lead to further analyses of newly defined subgroups. Sev-eral statistical tests can be used to assess heterogeneity, but determining the degree of heterogeneity is still problematic because of the low statistical power of such formal tests. Blettner et al. [3] suggest that in addition to formal statisti-cal tests for heterogeneity, informal and graphistatisti-cal methods should be used.
Prospectively planned meta-analyses: here many
Turning to empirical software engineering, we see that several proposals have been made to elicit a set of unifying principles. Basili et al. [2] suggest that individual studies should be seen as part of a ‘family of study’ rather than isolated events. In this case, studies could be replicated and context variables varied so that a framework for organizing related studies could be built. However, such a framework, making explicit the different models, and documenting key choices and rationales of experimental design used in each experiment, would be required. Although this process is desirable in itself, it does not go as far meta-analysis in that it concentrates on replicating studies and refining results, rather than combining results from a number of separate yet, hopefully, comparable studies.
Hayes [10] proposed that empirical software engineering research could benefit from research synthesis techniques that help summarize and assess the body of empirical re-sults. In agreement, Pickard et al. [25] suggest that the combined ‘weight of evidence’, the extent to which empir-ical results are consistent across studies, should be taken into account. Miller [22] states that the ‘reliable combina-tion of results from independent experiments is an essen-tial building block in any discipline attempting to build a solid empirical foundation’. However, he adds that results from meta-analysis in software engineering would be unsta-ble because of variability between replicated experiments and the lack of clear definitions of measures. Hedges and Olkin [11] suggest that meta-analysis relies on quantifying the effect magnitudes for the results to be combined, rather than focusing on statistical significance alone, but few stud-ies report effect size [22]. Furthermore, few provide access to raw data, or other experimental details, consequently, re-sults from individual studies frequently are neither gener-alizable [25] nor reliable [22]. Pickard et al. argue that without agreed sampling protocols in properly defined soft-ware engineering populations, and a set of standard mea-sures recorded for all empirical studies, meta-analysis can-not be conducted.
Many authors have reported on the heterogeneity of methodologies and measures chosen by researchers in stud-ies in software engineering. For example, despite the ex-istence of only a few surveys directly related to software effort estimation, Moløkken and Jørgensen [23] found that design variability made transfer of results problematic. Ad-ditionally, they emphasize the need for a thorough descrip-tion of the reasons for selecting an estimadescrip-tion method or methods in order to understand the influence of project char-acteristics on the choice of estimation method. Previously, Jørgensen et al. [13] had combined empirical results to analyse expert effort estimation accuracy as a function of expert’s control and knowledge of the environment as well as environmental predictability using MMRE. However, be-cause of the large number of disparate methodologies,
the-ories and models used in studies of human judgement, soft-ware estimation researchers should collaborate more with psychologists.
Clearly, scientific theory cannot be developed from one empirical study: in order to achieve the necessary pop-ulation statistics, results from individual studies must be pooled and results used to enable empirical relationships to be examined and theories constructed. However, as the examples above illustrate, conflicting results across studies may be due to errors or heterogeneous methods in sam-pling, measurement or reporting in individual studies. Soft-ware engineering professionals demand theories grounded on real world evidence, and researchers working in empir-ical software engineering are turning to meta-analyses to formulate theories. However, in order that these theories are reliable and generalizable, investigators need access to data that have been collected and analysed in a standardised manner according to agreed definitions of measures.
3
Some Examples
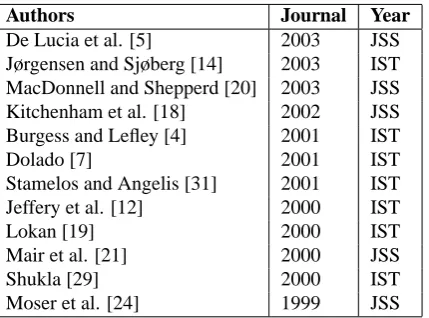
This next section illustrates potential problems when at-tempting to combine empirical results from seemingly com-parable individual studies. We focus on project effort pre-diction or software cost models and the various empirical studies that have been published. For our sample we anal-ysed the past five years (i.e. 1999 to 2003 inclusive) of the journal Information & Software Technology and the Journal
of Systems & Software. This exercise identified 12 papers
(see Table 1). These concerned a range of different project effort prediction systems ranging from regression models to machine learning techniques such as case-based reasoning and neural nets.
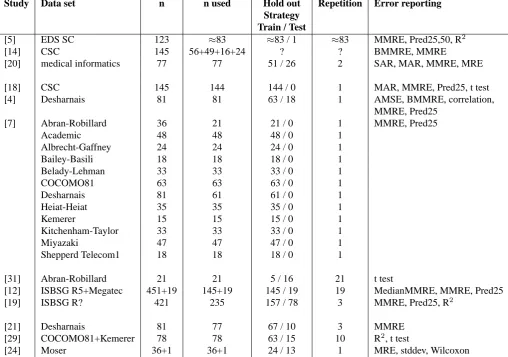
Table 2 summarises the validation information reported by the studies and highlights some of the differences. The initial number of cases in the data set is denotedn. In some cases this information is not provided within the paper but where we have been able to ascertain it from other sources we have added this information. The next column, labeled ‘n used’, contains the actual number of cases utilised for the study. Where there is a difference between the two counts, this implies case deletion which make the compar-ison of results more complex. Some studies, for example Kitchenham et al. [18] explicitly identify the cases removed along with the rationale. Other studies, such as Mair et al. [21] report the number of cases removed and the mecha-nism whereby they were selected. This is acceptable since it at least provides the means for subsequent researchers to identify the deleted cases.
Study Data set n n used Hold out Repetition Error reporting Strategy
Train / Test
[5] EDS SC 123 ≈83 ≈83 / 1 ≈83 MMRE, Pred25,50, R2
[14] CSC 145 56+49+16+24 ? ? BMMRE, MMRE
[20] medical informatics 77 77 51 / 26 2 SAR, MAR, MMRE, MRE
[18] CSC 145 144 144 / 0 1 MAR, MMRE, Pred25, t test
[4] Desharnais 81 81 63 / 18 1 AMSE, BMMRE, correlation,
MMRE, Pred25
[7] Abran-Robillard 36 21 21 / 0 1 MMRE, Pred25
Academic 48 48 48 / 0 1
Albrecht-Gaffney 24 24 24 / 0 1
Bailey-Basili 18 18 18 / 0 1
Belady-Lehman 33 33 33 / 0 1
COCOMO81 63 63 63 / 0 1
Desharnais 81 61 61 / 0 1
Heiat-Heiat 35 35 35 / 0 1
Kemerer 15 15 15 / 0 1
Kitchenham-Taylor 33 33 33 / 0 1
Miyazaki 47 47 47 / 0 1
Shepperd Telecom1 18 18 18 / 0 1
[31] Abran-Robillard 21 21 5 / 16 21 t test
[12] ISBSG R5+Megatec 451+19 145+19 145 / 19 19 MedianMMRE, MMRE, Pred25
[19] ISBSG R? 421 235 157 / 78 3 MMRE, Pred25, R2
[21] Desharnais 81 77 67 / 10 3 MMRE
[29] COCOMO81+Kemerer 78 78 63 / 15 10 R2, t test
[24] Moser 36+1 36+1 24 / 13 1 MRE, stddev, Wilcoxon
Authors Journal Year De Lucia et al. [5] 2003 JSS Jørgensen and Sjøberg [14] 2003 IST MacDonnell and Shepperd [20] 2003 JSS Kitchenham et al. [18] 2002 JSS Burgess and Lefley [4] 2001 IST
Dolado [7] 2001 IST
Stamelos and Angelis [31] 2001 IST Jeffery et al. [12] 2000 IST
Lokan [19] 2000 IST
Mair et al. [21] 2000 JSS
Shukla [29] 2000 IST
Moser et al. [24] 1999 JSS
Table 1. Papers Describing Empirical Studies of Software Project Effort Prediction from IST and JSS (1999-2003)
comprise 81 cases. Likewise the author reports that a subset of 21 cases are used out of a total of 36 cases for the Abran-Robillard data set. Of most concern is where we infer from other sources that cases have been deleted. Burgess and Lefley [4] note that of the Desharnais data set of 81 cases, four cases are incomplete. They state they have imputed values using a random process but do not inform us what these values are, consequently it is difficult to replicate their work or may comparisons with other studies using the same data set. Whilst this may seem to be hairsplitting, it makes comparison of results needlessly complex and potentially misleading. Likewise with replication.
The next two columns of Table 2 (Hold Out Strategy and Repetitions) define the validation approach of the study. These fall into four general classes. First there is model fit-ting. This is characterised by using all the data for training so the accuracy of the model or prediction system is de-termined by the goodness of fit to the training data. The number of repetitions is by definition one. Second is the jackknife. This is based on iterating a leave-one-out strat-egy. Here the number of repetitions is the number of cases since each case will be successively ‘held out’. Third, is the n-fold validation, and variants thereof, where the data set is arbitrarily split into training and test subsets where the test subset comprises unseen cases in order to determine the ac-curacy of the prediction system (strictly speaking its ability to generalise). Fourth and last is cross validation where a prediction system developed from one data set is tested on a second independent data set.
From Table 2 we see that a range of different approaches are adopted. These are summarised in Table 3 where we ob-serve that then-fold validation is most common, however, even within this technique there is considerable variation in
Validation Technique Count Studies Model fitting 2 [18, 7] Jackknife 3 [5, 31, 12]
n-fold 6 [20, 4, 19, 21, 29, 24] Cross validation 1 [14]
Table 3. Frequencies of Different Prediction System Validation Techniques
terms of the number of training sets sampled from the over-all data set (ranging from 1 to 10). It should be appreciated that the confidence limits on an accuracy statistic may be unacceptably wide when only using a small number of sam-ples [15]. Note that whilst [14] state that they use a cross validation technique no other details are provided hence the ‘?’s in Table 2. Different validation techniques are poten-tially problematic for meta-analysis since they may favour different prediction systems in ways that are not fully un-derstood.
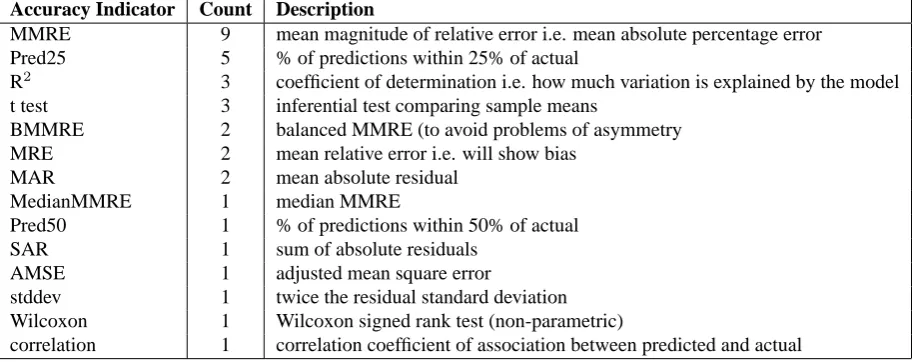
Finally, there are also many differences in accuracy mea-sures between the 12 studies. Table 4 shows 14 different ac-curacy indicators and whilst MMRE is most popular being used in three quarters of the studies many researchers have expressed reservations about its efficacy, not least because of its inherent asymmetry and being defined with respect to the actual rather than the predicted value [16]. Given the variety of possible accuracy measures (see [16] for a review and critique) it might seem attractive to focus on a single agreed measure. Unfortunately different indicators describe different aspects of the prediction errors and these cannot always be ignored since prediction goals themselves can differ (e.g. risk averse, bias avoidance, etc.). Thus the most effective approach is to provide the individual residu-als from which any accuracy indicator can be calculated.
Accuracy Indicator Count Description
MMRE 9 mean magnitude of relative error i.e. mean absolute percentage error Pred25 5 % of predictions within 25% of actual
R2 3 coefficient of determination i.e. how much variation is explained by the model t test 3 inferential test comparing sample means
BMMRE 2 balanced MMRE (to avoid problems of asymmetry MRE 2 mean relative error i.e. will show bias
MAR 2 mean absolute residual
MedianMMRE 1 median MMRE
Pred50 1 % of predictions within 50% of actual SAR 1 sum of absolute residuals
AMSE 1 adjusted mean square error
stddev 1 twice the residual standard deviation Wilcoxon 1 Wilcoxon signed rank test (non-parametric)
correlation 1 correlation coefficient of association between predicted and actual
Table 4. Frequencies of Use of Different Accuracy Indicators
treatment variables since this allows more general models to be induced.
4
How to Present Results
We can now apply the benefits of hindsight to consider what information these empirical studies should ideally have re-ported in order that they might be usefully included in a meta-analysis. Clearly it is not our desire to generate a bur-densome list which will then either put off prospective re-searchers or simply be ignored. Nevertheless it is our view to describe accuracy and context, the following is minimal:
• predicted values
• true values
• validation technique e.g. jackknife,n-fold
• the model (and not just the technique)
• parameter settings to configure the technique
• an indication of the amount of human effort to find the model
Predicted and true values are necessary in order that a standardized indicator of effect size for each study can be estimated. Meta-analysis relies on quantifying the effect magnitudes for the results to be combined, rather than fo-cusing on statistical significance alone, but as shown in this presentation, few studies report effect size, provide access to raw data, or other experimental details.
Detailed reporting of the validation technique, including partitioning procedures and the number of replications, as
well as details of the model would allow the analyst to un-derstand how the results were obtained and how generaliz-able they are to the dataset in question. These details would indicate also whether such results should be included in the meta-analysis.
We have argued previously that although accuracy is clearly desirable, it should not be the single indicator of a model’s success in effort prediction. Other important fac-tors are understandability and ease of configurability. For example, typical ANN architectures provide little informa-tion other than input, transformainforma-tion funcinforma-tion and output, whereas a decision tree provides details of each step taken to reach the final outcome. Furthermore, ease of model con-figuration should be reported in terms of specific modeller prerequisites.
The authors believe that a standard measure of error would facilitate the interpretation of results as well as mak-ing them more readily generalisable. In the twelve papers described here, 14 different statistics were used. However, this is not possible as there are many aspects of the errors that we need to describe: central tendency, spread, skew and kurtosis. Consequently we urge investigators to provide the residuals from which other accuracy statistics may be con-structed as needed.
In addition to accuracy measures, Shepperd and Kadoda [28] found a strong relationship between the success of a particular estimation technique and characteristics of the problem. Therefore to describe the context we need:
• the data set or an indication of where it can be obtained
• information on measurement error, i.e. how confident are the researchers in the values for each feature col-lected
• ideally a contact so that follow up questions and clari-fications may be sought
Few authors provide raw data from the original dataset, but it is of course, desirable. If not provided as an appendix, dataset availability, as well as contact details, should be clearly stated.
Frequently, data cleaning takes place prior to analysis. Several authors give little detail about the data cleaning pro-tocol used. For example, some report the total number (or proportion) of projects removed from the original dataset; some describe the type of project that was removed (e.g. outliers, or projects with missing data); but only one of the twelve papers included in this presentation reports precise details of the excluded case. Missing data is problematic for analysis, in fact some techniques cannot be performed on datasets with missing values. Despite this, some authors do not describe how they dealt with projects with incom-plete data. In addition, some studies have not reported any details of data cleaning, nor have they given the number of projects in the original dataset. Thus, it appears that anal-ysis was carried out on the entire dataset, yet this is not necessarily the case.
Some data collection methods are automated, while oth-ers are manual. Reports of less stringent recording of metrics when performed manually are common. Authors should therefore give details of how and by whom the met-rics in the dataset were recorded. They might additionally include confidence levels for these values.
Issues not described in studies might need to be clari-fied with someone who was involved in the data collection. Therefore it would be useful, not only for the meta-analyst, but also generally, for contact details to be given in empiri-cal work.
Obviously there is some relationship between the goal of the meta-analysis and the information required, but we believe the above has some generality.
The authors are involved with a recently commenced meta-analysis research project to apply meta-level learning to empirical studies of effort prediction systems1. This work is motivated, first, by the lack of a coherent picture of which type of prediction system is to be preferred with no sin-gle technique dominating. Second, the realisation that there is marked relationship between the study setting or context and the performance of different prediction systems. Meta-level learning was chosen as a means of inductively con-structing models that relate the response variable (accuracy) to treatment variables (relating to the technique and the data
1For further details please visit the project website at
dec.bmth.ac.uk/ESERG/MeLLow/.
set). From the comparison of two sample papers in the pre-vious section this is will be hindered since we do not have precisely the same response variables nor the same treat-ment variables describing the parameterisation of the ANN or the data editing performed. For this reason a major of the goal is to agree a protocol and language for reporting future results. The language will be XML based, not dissimilar to PMML a language used for comparing data mining algo-rithm results [9].
5
Summary
In this paper we have noted that, within the field of em-pirical software engineering, attention is turning to how to combine results in order to construct bodies of knowledge. A number of researchers are proposing meta-analytic ap-proaches. However, the primary focus has been upon statis-tical approaches which are best suited to situations of rela-tive homogeneity and well understood and generally agreed response variables. Design inspections could be a fruitful example. We argue that for effort prediction systems the in-ductive approach of meta-level learning may have merit as a means of finding models relating variables such as predic-tion technique, data set size and amount of noise to accu-racy. Unfortunately we also show for 12 seemingly similar published studies the difficulties of making a comparison and integrating the data. We propose that there is an over-whelming need for an agreed protocol and mechanism for publishing and integrating results in this field.
Acknowledgements
This work is partly supported by the Engineering and Phys-ical Sciences Research Council of the UK under grant GR/S45119.
References
[1] Armstrong, J.S., (Ed.). Principles of Forecasting: A
Handbook for Researchers and Practitioners.
Interna-tional Series in Operations Research & Management Science. Boston, Kluwer Academic Publishers, 2001.
[2] Basili, V.R. Shull, F. Lanubile, F. “Building Knowl-edge through Families of Experiments”, IEEE
Trans-actions on Software Engineering, 25, pp456-473,
1999.
[4] Burgess, C.J. Lefley, M. “Can genetic programming improve software effort estimation? A comparative evaluation”, Information & Software Technology, 43, pp863-873, 2001.
[5] De Lucia, A. Pompella, E. Stefanucci, S. “Assessing the maintenance processes of a software organization: an empirical analysis of a large industrial project”, J.
of Systems & Software, 65, pp87-103, 2003.
[6] Dickersin, K. “The existence of publication bias and risk factors for its occurrence”, J. Am. Med. Assoc., 263, pp1385-1389, 1990.
[7] Dolado, J.J. “On the problem of the software cost function”, Information & Software Technology, 43, pp61-72, 2001.
[8] Goodman, S.N. “Have you ever meta-analysis you didn’t like?”, Annals of International Medicine 114(3) pp244-246, 1991.
[9] Grossman, R. Bailey, S. Ramu, A. Malhi, B. Hall-strom, P. Pulleyn, I. Qin, X. “The management and mining of multiple predictive models using the predic-tive modeling markup language”, Information &
Soft-ware Technology, 41, pp589-595, 1999.
[10] Hayes, W. “Research synthesis in software engineer-ing: a case for meta-analysis”, presented at 6th IEEE
International Softw. Metrics Symp., Boca Raton, Fl,
1999.
[11] Hedges, L.V. Olkin, I. Statistical Methods for
Meta-Analysis. N.Y., Academic Press, 1985.
[12] Jeffery, R. Ruhe, M. Wieczorek, I. “A comparative study of two software development cost modeling techniques using multi-organizational and company-specific data”, Information & Software Technology, 42, pp1009-1016, 2000.
[13] Jørgensen, M., G. Kirkeboen, et al. “Human judge-ment in effort estimation of software projects.” Beg,
Borrow, or Steal Workshop, International Conference on Software Engineering, Limerick, Ireland, June
2000.
[14] Jørgensen, M. Sjøberg, D.I.K. “An effort prediction interval approach based on the empirical distribution of previous estimation accuracy”, Information &
Soft-ware Technology, 45, pp123-136, 2003.
[15] Kirsopp, C. Shepperd, M.J. “Making inferences with small numbers of training sets”, IEE Proceedings
-Software 149(5), 2002.
[16] Kitchenham, B.A. MacDonell, S.G. Pickard, L. Shep-perd, M.J. “What accuracy statistics really measure”,
IEE Proceedings - Software, 148, pp81-85, 2001.
[17] Kitchenham, B.A. S.L. Pfleeger, L.M. Pickard, P.W. Jones, D.C. Hoaglin, K. El Emam, and J. Rosenberg, “Preliminary guidelines for empirical research in soft-ware engineering”, IEEE Transactions on Softsoft-ware
Engineering, 28, pp721-734, 2002.
[18] Kitchenham, B.A. Pfleeger, S.L. McColl, B. Eagan, S. “An empirical study of maintenance and development estimation accuracy”, J. of Systems & Software, 64, pp57-77, 2002.
[19] Lokan, C.J. “An empirical analysis of function point adjustment factors”, Information & Software
Technol-ogy, 42, pp649-660, 2000.
[20] MacDonell, S. Shepperd, M.J. “Combining Tech-niques to Optimize Effort Predictions in Software Project Management”, J. of Systems & Software, 66, pp91-98, 2003.
[21] Mair, C. Kadoda, G. Lefley, M. Phalp, K. Schofield, C. Shepperd, M. Webster, S. “An investigation of ma-chine learning based prediction systems”, J. of
Sys-tems Software 53(1), pp23-29, 2000.
[22] Miller, J. “Can results from software engineering ex-periments be safely combined?”, presented at IEEE
6th Intl. Metrics Symp., Boca Raton, Fl., 1999.
[23] Moløkken, K. Jørgensen, M. “A review of surveys on software effort estimation”, Proc. of 2nd IEEE
Inter-national Symposium on Empirical Software Engineer-ing (ISESE 2003), Rome, Italy, pp223-230, 2003.
[24] Moser, S. Henderson-Sellers, B. “Cost estimation based on business models”, J. of Systems & Software, 49, pp33-42, 1999.
[25] Pickard, L.M. Kitchenham, B.A. Jones, P.W. “Com-bining empirical results in software engineering”,
In-formation & Software Technology, 40, pp811-821,
1998.
[26] Rosenthal, R. “The ‘file-drawer’ problem and tol-erence for null results.” Psychological Bulletin 86, pp638-641, 1979.
[27] Shapiro, S. “Meta analysis/shmeta analysis”,
Ameri-can J. of Epidemiology, 140, pp771-778, 1994.
[28] Shepperd, M.J. Kadoda, G. “Using Simulation to Evaluate Prediction Techniques”, IEEE Transactions
[29] Shukla, K.K. “Neuro-genetic prediction of software development effort”, Information & Software
Technol-ogy, 42, pp701-713, 2000.
[30] Soares, C., J. Costa, et al. “A Simple and Intuitive Measure for Multicriteria Evaluation of Classification Algorithms”, Proc. of Meta-Learning: Building
Au-tomatic Advice Strategies for Model Selection and Method Combination, Barcelona, Catalonia, Spain,
2000.
[31] Stamelos, I. Angelis, L.“Managing uncertainty in project portfolio cost estimation”, Information &
Soft-ware Technology, 43, pp759-768, 2001.
[32] Stroup, D.F., J.A. Berlin, S.C. Morton, I. Olkin, G.D. Williamson, D. Rennie, D. Moher, B.J. Becker, T.A. Sipe and S.B. Thacker, “Meta-analysis of observa-tional studies in epidemiology - A proposal for report-ing”, J. Am. Med. Assoc. 283(15), pp2008-2012, 2000.
[33] Todorovski, L. Dzeroski, S. “Experiments in meta-level learning with ILP”, Proc. Third European
Con-ference on Principles of Data Mining and Knowledge Discovery., Springer-Verlag, 1999.
[34] van Raan, A.F.J., Visser, M.S. et al. “Bibliometric Analysis of Psychotherapy Research: Performance Assessment and Position in the Journal Landscape.”
Psychotherapy Research 13(4(G)), pp511-528, 2003.
[35] Weed, D.L. “Methodological guidelines for review pa-pers.” Journal of the National Cancer Institute 89, pp6-7, 1997.