Materials2015,8, 5621-5646; doi:10.3390/ma8095267
OPEN ACCESS
materials
ISSN 1996-1944 www.mdpi.com/journal/materials Article
Influence of Flame Retardants on the Melt Dripping Behaviour
of Thermoplastic Polymers
Melissa Matzen1, Baljinder Kandola2, Christian Huth1 and Bernhard Schartel1,*
1 BAM Federal Institute for Materials Research and Testing, Unter den Eichen 87, Berlin 12205, Germany; E-Mails: [email protected] (M.M.); [email protected] (C.H.);
2 Institute for Materials Research and Innovation, University of Bolton, Deane Road, Bolton BL3 5AB, UK; E-Mail: [email protected]
*Author to whom correspondence should be addressed; E-Mail: [email protected]; Tel.: +49-308-104-1021.
Academic Editor: Rodolphe Sonnier
Received: 19 June 2015 / Accepted: 20 August 2015 / Published: 27 August 2015
Abstract: Melt flow and dripping of the pyrolysing polymer melt can be both a benefit and a detriment during a fire. In several small-scale fire tests addressing the ignition of a defined specimen with a small ignition source, well-adjusted melt flow and dripping are usually beneficial to pass the test. The presence of flame retardants often changes the melt viscosity crucially. The influence of certain flame retardants on the dripping behaviour of four commercial polymers, poly(butylene terephthalate) (PBT), polypropylene (PP), polypropylene modified with ethylene-propylene rubber (PP-EP) and polyamide 6 (PA 6), is analysed based on an experimental monitoring of the mass loss due to melt dripping, drop size and drop temperature as a function of the furnace temperature applied to a rod-shaped specimen. Investigating the thermal transition (DSC), thermal and thermo-oxidative decomposition, as well as the viscosity of the polymer and collected drops completes the investigation. Different mechanisms of the flame retardants are associated with their influence on the dripping behaviour in the UL 94 test. Reduction in decomposition temperature and changed viscosity play a major role. A flow limit in flame-retarded PBT, enhanced decomposition of flame-retarded PP and PP-EP and the promotion of dripping in PA 6 are the salient features discussed.
1. Introduction
Fire behaviour is reflected by the response of defined specimens or components in distinct fire scenarios. The fire properties observed are not material properties, but are based on complex interactions of different phenomena in the gas phase and the condensed phase. The pyrolysis of the polymer in the condensed phase, the oxidation of volatile fuel in the gas phase (flame), the mass transport to the flame and the heat transport to the pyrolysis front are the main phenomena controlling burning. Each of these main actors is merely a category comprised of a dozen sub-phenomena. For instance, the pyrolysis includes the processes of heating the polymer, melting, decomposition, charring, and so on. Furthermore, the different processes interact with each other. The function of flame retardants usually involves several phenomena, both chemical and physical, at the same time. Apart from thermal insulation through intumescence, the role of flame retardants in changing the physical phenomena is often underestimated or neglected. This may be misleading in several systems, because the physical phenomena can be minor, but crucial or even become the main flame retardancy mode of action. For instance, heat absorption and reflection at the polymer surface, as well as heat shielding by hot surfaces are usually neglected, but the key role of changes in heat absorption on ignition in polymer/carbon nanoparticle nanocomposites has been presented [1,2]. An effective heat reflection (=infrared mirror) increases the time to ignition by an order of magnitude and, thus, reduces the maximum average rate of heat emission (MARHE) below 90 kW/m2 in the cone calorimeter at 50 kW/m2 irradiation [3]. Heat shielding (re-radiation of the hot surface) is the main general flame retardant mode of action for nanocomposites based on polymers that exhibit little or no charring [4,5]. In this paper, an important physical phenomenon in flame retardancy is addressed: the influence of flame retardants on dripping phenomenaversusclassification in the UL 94 test. Dripping in the UL 94 setup is controlled by thermophysical properties, such as the viscosity of the melt. This study elucidates the quite different impact of certain flame retardants on the dripping during reaction to small flame tests. It indicates how the change in properties is used to achieve a desired classification in commercial products.
Of course, melt flow and dripping of the pyrolysing polymer melt can be both a benefit and a detriment during a fire. Melt flow and dripping can reduce flame spread and even result in extinction, as it removes mass and heat from the actual pyrolysis zone. On the other hand, melt flow and dripping often provide an additional ignition source, an additional process of flame spread and even harbour the potential to start a pool fire separate from the original burning item. In several small-scale fire tests addressing the sustained ignition of a small specimen as a reaction to an ignition source at the beginning of a fire (oxygen index, UL 94 burning chamber, FMVSS 302, all kinds of Bunsen burner type tests, glow wire test), a well-adjusted melt flow and dripping are crucial to passing the test.
Materials2015,8 5623
UL 94 classification V-2, which is still a very interesting classification for some products, such as films or thin-wall building products.
Recently, the quantification of dripping behaviour during burning has been the subject of various reports [7–17]. Most studies have been performed under fire operating conditions that resemble the UL 94 test [7–10,14,15]. The effect of convective heat on non-flaming melt dripping has been less intensively studied [12]. In the work reported in [12], six commercially available polymers without flame retardants were subjected to convective heat in a tube furnace, and their melt dripping behaviour was studied by measuring the mass loss as a function of time. Number, mass, shape, sizes and temperatures of individual drops were recorded, which varied depending on the polymer type and the furnace temperature [12,13]. From rheological and thermogravimetric analyses of the polymer and the fallen drops, it was established that during melt dripping, partial decomposition of the polymer occurs, the degree of which depends on the furnace temperature. Tests equivalent to UL 94 were also performed. It was demonstrated that dripping during fire tests is a complex interaction of physical and chemical processes, e.g., softening temperatures or viscosity changes due to chemical decomposition.
Adding flame retardants often changes the viscosity of the polymer melt, since they function as plasticizers or as reinforcing fillers. Further, the efficiency of many flame retardants depends on the viscosity of the modified polymers. In fact, flame retardants are often applied together with distinct adjuvants to adjust the dripping behaviour. Two different approaches are successfully realized in commercial systems: first, reducing viscosity to enhance dripping and, thus, achieving V-0 dripping or V-2 classification; second, inducing a flow limit (solid-like behaviour at low shear stresses below a yield point) to avoid dripping and, thus, achieving V-0 non-dripping. The latter case has been examined in detail for polycarbonate/acrylonitrile-butadiene-styrene (PC/ABS)/bisphenol A bis(diphenyl phosphate) (BDP)/polytetrafluoroethylene (PTFE) [10,18]. The flame retardant BDP functions as an efficient plasticizer for PC/ABS, so that not only PC/ABS, but also PC/ABS/BDP achieve V-2 classification. To get the desired non-dripping V-0 classification, the anti-dripping adjuvant PTFE was added, just as it is for several commercial flame-retardant thermoplastics. All kinds of anisotropic nanoparticles, such as layered silicate or multiwall carbon nanotubes, also induce flow limits in flame-retardant thermoplastics, so that the UL 94 classification is changed from dripping to non-dripping [19–21]. In contrast, melamine and its salts in polyamide promote dripping and are used to achieve dripping UL 94 classifications of V-2 and V-0, respectively [22,23]. Intumescent systems are believed to require an adjusted viscosity of the pyrolysing melt, which keeps the bubbles within the condensed phase, while enabling considerable deformation [24].
The viscosity, thermal transition, thermal and thermo-oxidative decomposition of the flame-retarded polymers and corresponding polymers have also been investigated. The results are analysed and compared to explain the different dripping behaviours and their relation to UL 94 classifications.
2. Results and Discussion
2.1. Thermal Transition, Thermal and Thermo-Oxidative Decomposition
Melt flow and dripping of flame-retarded polymers during exposure to an external heat source are a complex interaction of physical and chemical processes. The physical processes, such as glass transition and melting, as well as chemical, such as molecular weight reduction and charring, caused by thermal and thermo-oxidative decomposition play a major role with respect to melt flow and dripping. Thus, the effects of flame retardants on the thermal transition, thermal and thermo-oxidative decomposition of PBT HB, PBT V-2, PBT V-1, PBT V-0, PP HB, PP V-2, PP-EP HB, PP-EP V-2, PA 6 HB, PA 6 V-2 and PA 6 V-0 were investigated.
MaterialsMaterials20152015,, 88 56255
Figure 1. TGA under N2. Mass of: (a) poly(butylene terephthalate) (PBT) HB, PBT V-2,
PBT V-1, PBT V-0; (b) polypropylene (PP) HB, PP V-2, PP-ethylene-propylene (EP) HB, PP-EP V-2; and (c) polyamide 6 (PA 6) HB, PA 6 V-2, PA 6 V-0. Heating rate: 10 °C·min−1.
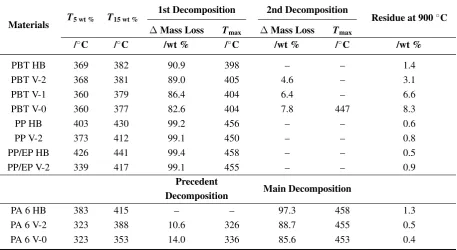
Table 1. TGA: thermal decomposition.
Materials T5 wt % T15 wt %
1st Decomposition 2nd Decomposition
Residue at 900 °C
Δ Mass Loss Tmax Δ Mass Loss Tmax
/°C /°C /wt % /°C /wt % /°C /wt %
PBT HB 369 382 90.9 398 – – 1.4
PBT V-2 368 381 89.0 405 4.6 – 3.1
PBT V-1 360 379 86.4 404 6.4 – 6.6
PBT V-0 360 377 82.6 404 7.8 447 8.3
PP HB 403 430 99.2 456 – – 0.6
PP V-2 373 412 99.1 450 – – 0.8
PP/EP HB 426 441 99.4 458 – – 0.5
PP/EP V-2 339 417 99.1 455 – – 0.9
Precedent
Decomposition Main Decomposition
PA 6 HB 383 415 – – 97.3 458 1.3
PA 6 V-2 323 388 10.6 326 88.7 455 0.5
PA 6 V-0 323 353 14.0 336 85.6 453 0.4
Figure 1b shows the decomposition of PP HB, PP V-2, PP-EP HB and PP-EP V-2. PP HB shows a single decomposition step with Tmax = 456 °C; T5 wt % = 403 °C. PP-V-2 also decomposed in a single
Figure 1. TGA under N2. Mass of: (a) poly(butylene terephthalate) (PBT) HB, PBT V-2, PBT V-1, PBT V-0; (b) polypropylene (PP) HB, PP V-2, PP-ethylene-propylene (EP) HB, PP-EP V-2; and (c) polyamide 6 (PA 6) HB, PA 6 V-2, PA 6 V-0. Heating rate: 10˝C
¨min´1.
Table 1.TGA: thermal decomposition.
Materials T5 wt % T15 wt %
1st Decomposition 2nd Decomposition
Residue at 900˝C
∆Mass Loss Tmax ∆Mass Loss Tmax
/˝C /˝C /wt % /˝C /wt % /˝C /wt %
PBT HB 369 382 90.9 398 – – 1.4
PBT V-2 368 381 89.0 405 4.6 – 3.1
PBT V-1 360 379 86.4 404 6.4 – 6.6
PBT V-0 360 377 82.6 404 7.8 447 8.3
PP HB 403 430 99.2 456 – – 0.6
PP V-2 373 412 99.1 450 – – 0.8
PP/EP HB 426 441 99.4 458 – – 0.5
PP/EP V-2 339 417 99.1 455 – – 0.9
Precedent
Decomposition Main Decomposition
PA 6 HB 383 415 – – 97.3 458 1.3
PA 6 V-2 323 388 10.6 326 88.7 455 0.5
PA 6 V-0 323 353 14.0 336 85.6 453 0.4
Figure 1b shows the decomposition of PP HB, PP V-2, PP-EP HB and PP-EP V-2. PP HB shows a single decomposition step with Tmax = 456 ˝C; T
in a single step, starting at a reduced T5 wt % = 373 ˝C, showing a slightly reduced T
max, and was completed at a similar Tend = 470 ˝C with a residue of 0.8 wt % remaining at the end of the experiment. The significant difference of 30 ˝C in the beginning of decomposition is proposed to be caused by a radical generator used as a flame retardant, enhancing the chain scission of PP. PP-EP HB undergoes single-step decomposition, whereas PP-EP V-2 decomposed in two steps (Figure 1b). The preceding minor decomposition is attributed to the decomposition of the brominated flame retardant tetrabromobisphenol A bis(2,3-dibromopropyl ether) (BDDP) with a decomposition temperature above 260˝C. Thus,T
5 wt %representing the decomposition of BDDP (Figure1b) is lowered by 87˝C compared to PP-EP. The influence on the beginning of the main decomposition step of the PP matrix is apparent when T15 wt %(=temperature at 15 wt % mass loss) is compared. The T15 wt % = 417 ˝C of PP-EP V-2 occurred 24˝C earlier than theT
15 wt %= 441˝C for PP-EP HB, whereasTmaxhardly changed. A similar earlier decomposition (∆T = 18˝C) is observed for T
15 wt % of PP V-2 compared to PP HB. Thus, both PP-EP V-2 and PP V-2 show particularly early decomposition. Taking into account that PP decomposes by random chain scission, it is assumed that early decomposition may also result in a crucial decreased molecular weight and, thus, may promote melt flow and dripping.
PA 6 HB decomposed in one step, as seen from Figure 1c. The decomposition started at T5 wt %= 383˝C withTmax= 458˝C. The residue remaining after a maximum temperature of 900˝C was 1.3 wt %. In contrast, PA 6 V-2 and PA 6 V-0 decomposed in a two-step process, the first one being a minor decomposition step followed by the main decomposition of the polymer. BetweenT5 wt %= 318˝C and 355˝C, a mass loss of 10.6 wt % for PA 6 V-2 and 14.0 wt % for PA 6 V-0, respectively, are attributed to the evaporation of melamine [22,29–31]. Above 320˝C, melamine cyanurate undergoes endothermic decomposition to melamine and cyanuric acid [22] and catalyses the dehydration of the primary amine chain ends. The difference in decomposition of PA 6 V-2 and PA 6 V-1 from PA 6 HB is exemplified by the change inT15 wt %. TheT15 wt %of PA 6 V-2 and PA 6 V-0 differed from PA 6 HB by 27 and 62˝C, respectively, and indicates an enhanced decomposition of the polymer chains by melamine cyanurate into chain fragments instead of the formation of caprolactam, resulting in a promotion of melt flow and dripping. The second main decomposition step of PA 6 V-2 and PA 6 V-0 with Tmax = 453 ˝C and residues of 0.5 and 0.4 wt %, respectively, corresponds to the decomposition of the polymer.
Materials2015,8 5627
pattern of PBT V-2 and PBT V-1 lies in between those of PBT HB and PBT V-0, reflected by the increasing concentration of the aluminium diethyl phosphinate.
Materials2015, 8 7
of PBT V-2 and PBT V-1 lies in between those of PBT HB and PBT V-0, reflected by the increasing concentration of the aluminium diethyl phosphinate.
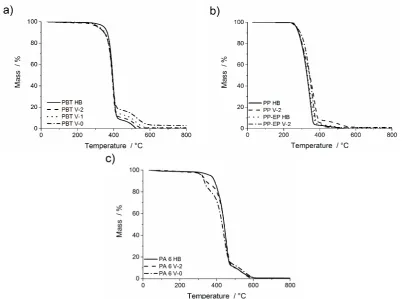
Figure 2. TGA under synthetic air. Mass of: (a) PBT HB, PBT V-2, PBT V-1, PBT V-0; (b) PP HB, PP V-2, PP-EP HB, PP-EP V-2; and (c) PA 6 HB, PA 6 V-2, PA 6 V-0. Heating rate: 10 °C min−1.
Table 2. TGA: thermo-oxidation.
Materials T5 wt %
1st Decomposition 2nd Decomposition 3rd Decomposition
Δ Mass Loss Tmax Δ Mass Loss Tmax Δ Mass Loss Tmax Residue at 900 °C
/°C /wt % /°C /wt % /°C /wt % /°C /wt %
PBT HB 347 90.5 396 9.5 516 – – 0.0
PBT V-2 325 88.7 394 11.3 511 – – 0.7
PBT V-1 322 85.9 398 14.1 523 – – 1.9
PBT V-0 312 77.6 396 19.4 529 – – 3.1
PP HB 271 96.4 328 3.6 499 – – 0.0
PP V-2 274 91.8 342 7.5 498 – – 0.7
PP-EP HB 271 95.7 332 3.9 497 – – 0.5
PP-EP V-2 272 93.3 344 5.7 495 – – 1.2
PA 6 HB 368 – – 88.1 449 11.5 529 0.4
PA 6 V-2 323 10.6 334 79.0 443 10.4 540 0.0
PA 6 V-0 318 14.0 332 73.2 441 12.8 553 0.0
Under thermo-oxidative conditions (Figure 2b), the major mass loss step for PP HB and PP V-2 started early, T5 wt % = 270 °C, and, thus, differs clearly from the values obtained for thermal
Figure 2. TGA under synthetic air. Mass of: (a) PBT HB, PBT V-2, PBT V-1, PBT V-0; (b) PP HB, PP V-2, PP-EP HB, PP-EP V-2; and (c) PA 6 HB, PA 6 V-2, PA 6 V-0. Heating rate: 10˝C min´1.
Table 2. TGA: thermo-oxidation.
Materials T5 wt %
1st Decomposition 2nd Decomposition 3rd Decomposition
∆Mass Loss Tmax ∆Mass Loss Tmax ∆Mass Loss Tmax Residue at 900˝C
/˝C /wt % /˝C /wt % /˝C /wt % /˝C /wt %
PBT HB 347 90.5 396 9.5 516 – – 0.0
PBT V-2 325 88.7 394 11.3 511 – – 0.7
PBT V-1 322 85.9 398 14.1 523 – – 1.9
PBT V-0 312 77.6 396 19.4 529 – – 3.1
PP HB 271 96.4 328 3.6 499 – – 0.0
PP V-2 274 91.8 342 7.5 498 – – 0.7
PP-EP HB 271 95.7 332 3.9 497 – – 0.5
PP-EP V-2 272 93.3 344 5.7 495 – – 1.2
PA 6 HB 368 – – 88.1 449 11.5 529 0.4
PA 6 V-2 323 10.6 334 79.0 443 10.4 540 0.0
PA 6 V-0 318 14.0 332 73.2 441 12.8 553 0.0
around∆T5 wt %= 100˝C for PP V-2 and 130˝C for PP HB. The start of thermo-oxidative decomposition of the polymer is no longer initiated by the radical generator. Above 200 ˝C, oxygen initiates a radical-chain decomposition of PP via hydroperoxidation of C–H bonds [34]. This thermo-oxidative decomposition also produces some carbonaceous residue for PP by oxidative dehydration. Starting at 361 and 382 ˝C, respectively, PP HB and PP V-2 exhibit a subsequent second decomposition step corresponding to the oxidation of the carbonaceous residue. PP V-2 shows an increase in theTmaxof the main decomposition step and an increase in char value. Quite analogously, PP-EP HB and PP-EP V-2 decomposed in two decomposition steps, starting atT5 wt %= 271˝C with a mass loss of 95.7 wt % and
T5 wt % = 272 ˝C with a mass loss of 93.3 wt %, respectively. The reduction of the decomposition temperature (T5 wt %) in synthetic air compared to nitrogen atmosphere is attributed to radical chain decomposition initiated by oxygen. After the subsequent minor decomposition step withTmax= 497˝C and a mass loss of 3.9 wt %, a residue of 0.5 wt % remained for PP-EP HB. The subsequent second decomposition step of PP-EP V-2 is characterised byTmax= 495˝C with a mass loss of 5.7 wt %.
Figure2c shows the two-step decomposition of PA 6 HB, PA 6 V-2 and PA 6 V-0 in synthetic air. The T5 wt % is similar to the value under nitrogen atmosphere, and the effect of the flame retardant is still noticed. The main decomposition step of PA 6 HB, starting at T5 wt % = 368 ˝C, is due to the decomposition of the polymer chains with a mass loss of 88.1 wt %. The subsequent second step with a mass loss of 11.5 wt % is attributed to the oxidation of char residue. PA 6 V-2 and PA 6 V-0 decomposed in a three-step process. PA 6 V-2 and PA 6 V-0 exhibited a preceding first decomposition step due to decomposition of the melamine cyanurate. This step started at T5 wt % = 323 ˝C for PA 6 V-2 and T5 wt %= 318˝C for PA 6 V-0, respectively, with a mass loss representing the flame retardant content in the polymer. The mass loss of >70 wt % in the second (main) step was due to the decomposition of the polymer. The third subsequent decomposition step of PA 6 V-2 and PA 6 V-0 equals the second step of PA 6 HB and corresponds to the oxidation of the char residue of PA 6. The maximum temperature of the third decomposition is noted as Tmax = 553˝C and T
max = 540 ˝C for PA 6 V-2 and PA 6 V-0, respectively. At a temperature of 900˝C, no residue remained.
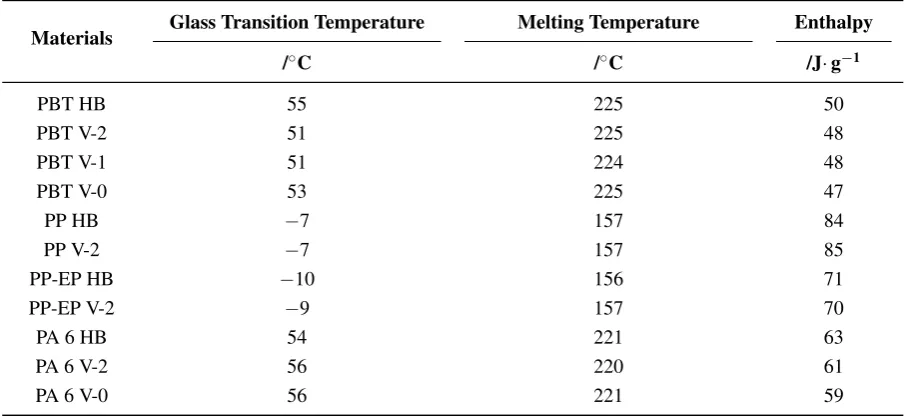
The glass transition and melting temperatures were measured using differential scanning calorimetry (DSC) (Figure S1, Table 3). No noticeable influence of the flame retardants on the glass transition and melting temperature of the respective polymers was observed. PBT HB, PBT V-2, PBT V-1 and PBT V-0 exhibited similar glass transition temperatures and melting temperatures at around 53 and 225 ˝C, respectively. The melt enthalpies of PBT V-2, PBT V-1 and PBT V-0 compared to PBT HB decreased, but not as much as expected due to the flame retardant content. Most probably an increase in PBT crystallinity occurred due to the flame retardant particles working as a nucleating agent for crystallization. The characteristic temperatures of PP HB, PP V-2, PP-EP HB and PP-EP V-2 were glass transition at about ´10˝C and
Materials2015,8 5629
Table 3. Thermal transition (DSC).
Materials Glass Transition Temperature Melting Temperature Enthalpy
/˝C /˝C /J¨g´1
PBT HB 55 225 50
PBT V-2 51 225 48
PBT V-1 51 224 48
PBT V-0 53 225 47
PP HB ´7 157 84
PP V-2 ´7 157 85
PP-EP HB ´10 156 71
PP-EP V-2 ´9 157 70
PA 6 HB 54 221 63
PA 6 V-2 56 220 61
PA 6 V-0 56 221 59
In the investigated systems, there is a limited overall influence of the flame retardants used on the thermal transition (glass transition and melting), thermal decomposition (thermal analysis under nitrogen) and thermo-oxidative decomposition (thermal analysis under air). The only significant change is at the beginning of decomposition, indicating an enhancement of decomposition caused by the flame retardants. Particularly, the thermal decomposition of PP, PP-EP and PA 6 is enhanced at the beginning of decomposition, as is the thermo-oxidative decomposition of PBT and PA 6. Even though the change in mass release is limited to the beginning of the decomposition, one can expect an impact on the viscosity of the pyrolysing melt of PP and PA 6 responsible for enhancing the melt flow and dripping behaviour. In PBT samples, additional residue and char formation occurred, which may also influence the viscosity.
2.2. Melt Dripping
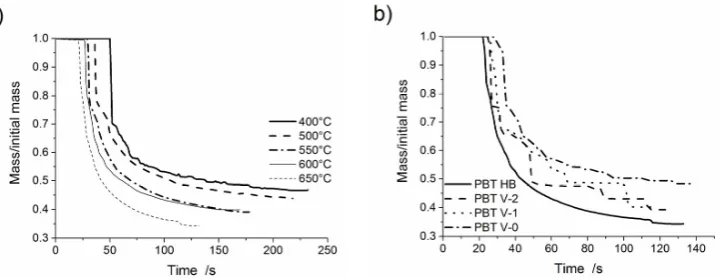
60.2%˘0.2% for PBT HB down to 39.7%˘0.6% for PBT V-0. The mass loss caused by volatilisation increased by 8.5%–13.1% ˘ 0.8% for PBT V-0. The residue over the furnace increased in the order PBT HB < PBT V-2ďPBT V-1 < PBT V-0. The starting time for mass loss was delayed, so melt dripping and, hence, the mass loss rate declined with increasing UL 94 classification. At 400 ˝C, the time until the first drop fell was 50 s for PBT HB, 66 s for PBT V-2, 70 s for PBT V-1 and 88 s for PBT V-0. The delay in dripping was attributed to the PTFE adjuvant working as an anti-dripping agent. The first drop is rather a break-up of the bottom part of the specimen and consisted of molten and non-molten material (Figure4a). After this first break-up, PBT HB showed a constant melt flow (no drops; Figure4b) for furnace temperatures <650˝C and tiny drops (average diameter 0.9 mm; Figure4c) forě650˝C. The average drop diameter of PBT V-2, PBT V-1 and PBT V-0 was 11 mm.
Materials2015, 8 10
PBT HB down to 39.7% ± 0.6% for PBT V-0. The mass loss caused by volatilisation increased by 8.5%–13.1% ± 0.8% for PBT V-0. The residue over the furnace increased in the order PBT HB < PBT V-2 ≤ PBT V-1 < PBT V-0. The starting time for mass loss was delayed, so melt dripping and, hence, the mass loss rate declined with increasing UL 94 classification. At 400 °C, the time until the first drop fell was 50 s for PBT HB, 66 s for PBT V-2, 70 s for PBT V-1 and 88 s for PBT V-0. The delay in dripping was attributed to the PTFE adjuvant working as an anti-dripping agent. The first drop is rather a break-up of the bottom part of the specimen and consisted of molten and non-molten material (Figure 4a). After this first break-up, PBT HB showed a constant melt flow (no drops; Figure 4b) for furnace temperatures <650 °C and tiny drops (average diameter 0.9 mm; Figure 4c) for ≥650 °C. The average drop diameter of PBT V-2, PBT V-1 and PBT V-0 was 11 mm.
Figure 3. Mass loss as a function of time for: (a) PBT HB at various furnace temperatures; and (b) PBT HB, PBT V-2, PBT V-1 and PBT V-0 at 650 °C.
Figure 4. (a) Partly molten piece falling down of PBT V-2 at a furnace temperature of 500 °C; (b) melt flow material of PBT HB at 400 °C; (c) melt flow and dripping of PBT HB at 650 °C.
Table 4. Summary of melt dripping results for PBT HB, PBT V-2, PBT V-1 and PBT V-0 at 650 °C.
Sample No. of Drops
Total Mass Loss Due to Dripping
Total Mass Loss Due to Volatilization
Residual Mass
/% /% /%
PBT HB 63 ± 3 60.2 ± 0.2 4.6 ± 0.7 35.2 ± 1.5 PBT V-2 25 ± 3 50.9 ± 2.8 7.6 ± 3.2 39.5 ± 0.4 PBT V-1 26 ± 2 50.1 ± 0.8 8.3 ± 2.4 41.6 ± 1.6 PBT V-0 25 ± 1 39.7 ± 0.6 13.1 ± 0.8 47.2 ± 0.2
Figure 3. Mass loss as a function of time for: (a) PBT HB at various furnace temperatures; and (b) PBT HB, PBT V-2, PBT V-1 and PBT V-0 at 650˝C.
Materials 2015, 8 10
PBT HB down to 39.7% ± 0.6% for PBT V-0. The mass loss caused by volatilisation increased by 8.5%–13.1% ± 0.8% for PBT V-0. The residue over the furnace increased in the order PBT HB < PBT V-2 ≤ PBT V-1 < PBT V-0. The starting time for mass loss was delayed, so melt dripping and, hence, the mass loss rate declined with increasing UL 94 classification. At 400 °C, the time until the first drop fell was 50 s for PBT HB, 66 s for PBT V-2, 70 s for PBT V-1 and 88 s for PBT V-0. The delay in dripping was attributed to the PTFE adjuvant working as an anti-dripping agent. The first drop is rather a break-up of the bottom part of the specimen and consisted of molten and non-molten material (Figure 4a). After this first break-up, PBT HB showed a constant melt flow (no drops; Figure 4b) for furnace temperatures <650 °C and tiny drops (average diameter 0.9 mm; Figure 4c) for ≥650 °C. The average drop diameter of PBT V-2, PBT V-1 and PBT V-0 was 11 mm.
Figure 3. Mass loss as a function of time for: (a) PBT HB at various furnace temperatures; and (b) PBT HB, PBT V-2, PBT V-1 and PBT V-0 at 650 °C.
Figure 4. (a) Partly molten piece falling down of PBT V-2 at a furnace temperature of 500 °C; (b) melt flow material of PBT HB at 400 °C; (c) melt flow and dripping of PBT HB at 650 °C.
Table 4. Summary of melt dripping results for PBT HB, PBT V-2, PBT V-1 and PBT V-0 at 650 °C.
Sample No. of Drops
Total Mass Loss Due to Dripping
Total Mass Loss Due to Volatilization
Residual Mass
/% /% /%
PBT HB 63 ± 3 60.2 ± 0.2 4.6 ± 0.7 35.2 ± 1.5
PBT V-2 25 ± 3 50.9 ± 2.8 7.6 ± 3.2 39.5 ± 0.4
PBT V-1 26 ± 2 50.1 ± 0.8 8.3 ± 2.4 41.6 ± 1.6
PBT V-0 25 ± 1 39.7 ± 0.6 13.1 ± 0.8 47.2 ± 0.2
Figure 4. (a) Partly molten piece falling down of PBT V-2 at a furnace temperature of 500˝C; (b) melt flow material of PBT HB at 400˝C; (c) melt flow and dripping of PBT HB at 650˝C.
Table 4. Summary of melt dripping results for PBT HB, PBT V-2, PBT V-1 and PBT V-0 at 650˝C.
Sample No. of Drops
Total Mass Loss Due to Dripping
Total Mass Loss
Due to Volatilization Residual Mass
/% /% /%
PBT HB 63˘3 60.2˘0.2 4.6˘0.7 35.2˘1.5
PBT V-2 25˘3 50.9˘2.8 7.6˘3.2 39.5˘0.4
PBT V-1 26˘2 50.1˘0.8 8.3˘2.4 41.6˘1.6
Materials2015,8 5631
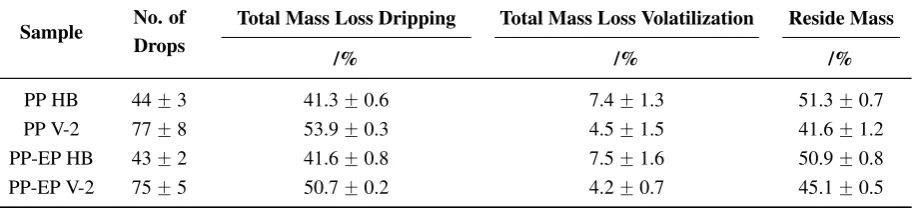
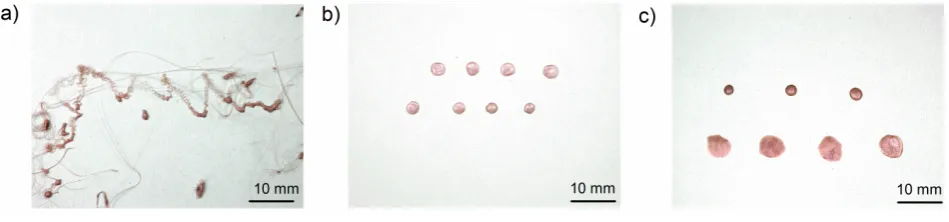
Figure5a presents mass loss curves of PP-EP HB at various furnace temperatures. Figure5b shows the mass loss curves of PP-EP HB, PP-EP V-2, PP HB and PP V-2 at a 500˝C furnace temperature. The dripping characteristics, e.g., number of drops, total mass loss due to dripping, total mass loss due to volatilization and residual mass, are summarised in Table5. PP HB, PP V-2, PP-EP HB and PP-EP V-2 showed an abrupt mass loss due to the first partly molten piece falling down. The subsequent melt dripping behaviours in different samples differ depending on the flame retardant type and concentration. An earlier mass loss and higher total mass loss in PP V-2 compared to PP HB and in PP-EP V-2 compared to PP-EP HB, respectively, go well together with the enhanced decomposition (reduction of T5 wt %) in TGA measurements. Both flame-retarded materials, PP V-2 and PP-EP V-2, showed an increase in the mass loss due to dripping. The mass loss caused by volatilisation decreased from 7.4%˘1.3% and 7.5%˘1.6% for PP HB and PP-EP HB, respectively, down to 4.5% ˘ 1.5% for PP V-2 and 4.2%˘0.7% for PP-EP V-2. PP-EP HB and PP-EP V-2 began dripping after 51 and 40 s, respectively, at a 500˝C furnace temperature; the total mass loss of PP-EP V-2 was reduced. PP V-2 exhibited a similar decrease in the starting time of mass loss and an increase in total mass loss of 10 wt %. PP-EP HB showed a constant melt flow with no drops. In contrast, PP-EP V-2 exhibited tiny drops (average drop diameter: 1.2 mm; PP-EPV-2 drops shown in Figure 6a) in quick succession at lower temperatures. At 500 ˝C, the size and frequency of PP-EP V-2 drops changed to medium-sized (5 mm, presented in Figure 6b), occasional drops. The PP-EP V-2 drop succession (Figure 6c) on the aluminium foil at 600˝C showed a size and shape variation from an initial 10-mm diameter with an irregular shape to circular drops 4 mm in diameter.
Materials2015, 8 11
Figure 5a presents mass loss curves of PP-EP HB at various furnace temperatures. Figure 5b shows the mass loss curves of PP-EP HB, PP-EP V-2, PP HB and PP V-2 at a 500 °C furnace temperature. The dripping characteristics, e.g., number of drops, total mass loss due to dripping, total mass loss due to volatilization and residual mass, are summarised in Table 5. PP HB, PP V-2, PP-EP HB and PP-EP V-2 showed an abrupt mass loss due to the first partly molten piece falling down. The subsequent melt dripping behaviours in different samples differ depending on the flame retardant type and concentration. An earlier mass loss and higher total mass loss in PP V-2 compared to PP HB and in PP-EP V-2 compared to PP-EP HB, respectively, go well together with the enhanced decomposition (reduction of T5 wt %) in TGA measurements. Both flame-retarded materials, PP V-2 and PP-EP V-2,
showed an increase in the mass loss due to dripping. The mass loss caused by volatilisation decreased from 7.4% ± 1.3% and 7.5% ± 1.6% for PP HB and PP-EP HB, respectively, down to 4.5% ± 1.5% for PP V-2 and 4.2% ± 0.7% for PP-EP V-2. PP-EP HB and PP-EP V-2 began dripping after 51 and 40 s, respectively, at a 500 °C furnace temperature; the total mass loss of PP-EP V-2 was reduced. PP V-2 exhibited a similar decrease in the starting time of mass loss and an increase in total mass loss of 10 wt %. PP-EP HB showed a constant melt flow with no drops. In contrast, PP-EP V-2 exhibited tiny drops (average drop diameter: 1.2 mm; PP-EPV-2 drops shown in Figure 6a) in quick succession at lower temperatures. At 500 °C, the size and frequency of PP-EP V-2 drops changed to medium-sized (5 mm, presented in Figure 6b), occasional drops. The PP-EP V-2 drop succession (Figure 6c) on the aluminium foil at 600 °C showed a size and shape variation from an initial 10-mm diameter with an irregular shape to circular drops 4 mm in diameter.
Figure 5. Mass loss as a function of time of: (a) PP-EP HB at various furnace temperatures; and (b) PP HB, PP V-2, PP-EP HB and PP-EP V-2 at 500 °C.
Table 5. Summary of melt dripping results for PP HB, PP V-2, PP-EP HB and PP-EP V-2 at 500 °C.
Sample No. of Drops
Total Mass Loss Dripping Total Mass Loss Volatilization Reside Mass
/% /% /%
PP HB 44 ± 3 41.3 ± 0.6 7.4 ± 1.3 51.3 ± 0.7
PP V-2 77 ± 8 53.9 ± 0.3 4.5 ± 1.5 41.6 ± 1.2
PP-EP HB 43 ± 2 41.6 ± 0.8 7.5 ± 1.6 50.9 ± 0.8
PP-EP V-2 75 ± 5 50.7 ± 0.2 4.2 ± 0.7 45.1 ± 0.5
Figure 5. Mass loss as a function of time of: (a) PP-EP HB at various furnace temperatures; and (b) PP HB, PP V-2, PP-EP HB and PP-EP V-2 at 500˝C.
Table 5. Summary of melt dripping results for PP HB, PP V-2, PP-EP HB and PP-EP V-2 at 500˝C.
Sample No. of Drops
Total Mass Loss Dripping Total Mass Loss Volatilization Reside Mass
/% /% /%
PP HB 44˘3 41.3˘0.6 7.4˘1.3 51.3˘0.7
PP V-2 77˘8 53.9˘0.3 4.5˘1.5 41.6˘1.2
PP-EP HB 43˘2 41.6˘0.8 7.5˘1.6 50.9˘0.8
Materials2015, 8 12
Figure 6. (a) Melt flow and dripping of PP-EP HB at a furnace temperature of 450 °C; (b) drops of PP-EP V-2 at 500 C; and (c) drops of PP-EP V-2 at 600 °C.
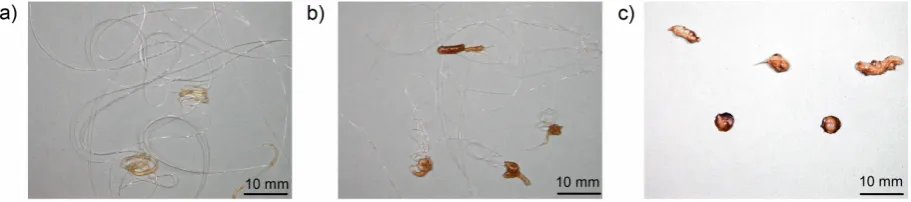
Mass loss curves of PA 6 V-2 at various furnace temperatures are shown in Figure 7a. Figure 7b presents mass loss curves for PA 6 HB, PA 6 V-2 and PA 6 V-0 at a furnace temperature of 600 °C. The main results are summarised in Table 6. PA 6 HB, PA 6 V-2 and PA 6 V-0 exhibited an abrupt mass loss due to the first partly molten piece falling down followed by melt dripping. PA 6 V-2 and PA 6 V-0 showed a very similar mass loss. The total mass loss and starting time of the mass loss were affected by the flame retardant. The total mass of PA 6 V-0 to PA 6 HB varied by 15 wt %. Mass loss due to dripping was nearly doubled to 45.3% ± 1.3% for PA 6 V-2 and 47.4% ± 1.6% for PA 6 V-0. The mass loss caused by volatilisation halved from 22.1% ± 2.5% for PA 6 HB to a value of 12.1% ± 1.8% and 11.9% ± 2.4% for PA 6 V-2 and PA 6 V-0, respectively. At a 600 °C furnace temperature, PA 6 HB and PA 6 V-0 began dripping after 41 and 28 s of exposure, respectively. The reduced starting time, in combination with higher total mass loss, is attributed to a decrease in the viscosity of PA 6 due to melamine cyanurate enhancing the decomposition, as was observed in the TGA experiments. PA 6 HB exhibited a constant, but low melt flow at low temperatures (Figure 8a). At 550 °C, the material developed medium-sized drops (average diameter 6 mm; Figure 8b) concurrent with a low melt flow. The shapes of the drops of PA 6 V-2 and PA 6 V-0, shown in Figure 8c, varied from irregular to circular at 550 °C. The colours of the drops varied from white to light to dark brown. This suggests partial decomposition of the molten drop residues.
Figure 7. Mass loss as a function of time for: (a) PA 6 V-2 at various furnace temperatures; and (b) PA 6 HB, PA 6 V-2 and PA 6 V-0 at 600 °C.
Figure 6. (a) Melt flow and dripping of PP-EP HB at a furnace temperature of 450 ˝C; (b) drops of PP-EP V-2 at 500 C; and (c) drops of PP-EP V-2 at 600˝C.
Mass loss curves of PA 6 V-2 at various furnace temperatures are shown in Figure 7a. Figure 7b presents mass loss curves for PA 6 HB, PA 6 V-2 and PA 6 V-0 at a furnace temperature of 600˝C. The main results are summarised in Table 6. PA 6 HB, PA 6 V-2 and PA 6 V-0 exhibited an abrupt mass loss due to the first partly molten piece falling down followed by melt dripping. PA 6 V-2 and PA 6 V-0 showed a very similar mass loss. The total mass loss and starting time of the mass loss were affected by the flame retardant. The total mass of PA 6 V-0 to PA 6 HB varied by 15 wt %. Mass loss due to dripping was nearly doubled to 45.3%˘1.3% for PA 6 V-2 and 47.4%˘1.6% for PA 6 V-0. The mass loss caused by volatilisation halved from 22.1%˘2.5% for PA 6 HB to a value of 12.1%˘1.8% and 11.9%˘2.4% for PA 6 V-2 and PA 6 V-0, respectively. At a 600˝C furnace temperature, PA 6 HB and PA 6 V-0 began dripping after 41 and 28 s of exposure, respectively. The reduced starting time, in combination with higher total mass loss, is attributed to a decrease in the viscosity of PA 6 due to melamine cyanurate enhancing the decomposition, as was observed in the TGA experiments. PA 6 HB exhibited a constant, but low melt flow at low temperatures (Figure 8a). At 550 ˝C, the material developed medium-sized drops (average diameter 6 mm; Figure 8b) concurrent with a low melt flow. The shapes of the drops of PA 6 V-2 and PA 6 V-0, shown in Figure8c, varied from irregular to circular at 550 ˝C. The colours of the drops varied from white to light to dark brown. This suggests partial decomposition of the molten drop residues.
Materials2015, 8 12
Figure 6. (a) Melt flow and dripping of PP-EP HB at a furnace temperature of 450 °C; (b) drops of PP-EP V-2 at 500 C; and (c) drops of PP-EP V-2 at 600 °C.
Mass loss curves of PA 6 V-2 at various furnace temperatures are shown in Figure 7a. Figure 7b presents mass loss curves for PA 6 HB, PA 6 V-2 and PA 6 V-0 at a furnace temperature of 600 °C. The main results are summarised in Table 6. PA 6 HB, PA 6 V-2 and PA 6 V-0 exhibited an abrupt mass loss due to the first partly molten piece falling down followed by melt dripping. PA 6 V-2 and PA 6 V-0 showed a very similar mass loss. The total mass loss and starting time of the mass loss were affected by the flame retardant. The total mass of PA 6 V-0 to PA 6 HB varied by 15 wt %. Mass loss due to dripping was nearly doubled to 45.3% ± 1.3% for PA 6 V-2 and 47.4% ± 1.6% for PA 6 V-0. The mass loss caused by volatilisation halved from 22.1% ± 2.5% for PA 6 HB to a value of 12.1% ± 1.8% and 11.9% ± 2.4% for PA 6 V-2 and PA 6 V-0, respectively. At a 600 °C furnace temperature, PA 6 HB and PA 6 V-0 began dripping after 41 and 28 s of exposure, respectively. The reduced starting time, in combination with higher total mass loss, is attributed to a decrease in the viscosity of PA 6 due to melamine cyanurate enhancing the decomposition, as was observed in the TGA experiments. PA 6 HB exhibited a constant, but low melt flow at low temperatures (Figure 8a). At 550 °C, the material developed medium-sized drops (average diameter 6 mm; Figure 8b) concurrent with a low melt flow. The shapes of the drops of PA 6 V-2 and PA 6 V-0, shown in Figure 8c, varied from irregular to circular at 550 °C. The colours of the drops varied from white to light to dark brown. This suggests partial decomposition of the molten drop residues.
Figure 7. Mass loss as a function of time for: (a) PA 6 V-2 at various furnace temperatures; and (b) PA 6 HB, PA 6 V-2 and PA 6 V-0 at 600 °C.
Materials2015,8 5633
Materials2015, 8 13
Figure 8. (a) Melt flow of PA 6 HB at a furnace temperature of 400 °C; (b) melt flow and drops of PA 6 HB at 550 °C; and (c) drop pathway of PA 6 V-2 at 550 °C.
Table 6. Summary of melt dripping results for PA 6 HB, PA 6 V-2 and PA 6 V-0 at 600 °C.
Sample No. of Drops Total Mass Loss Dripping Total Mass Loss Volatilization Reside Mass
/% /% /%
PA 6 HB 32 ± 4 23.9 ± 1.3 22.1 ± 2.5 54.0 ± 1.2
PA 6 V-2 40 ± 2 45.3 ± 0.5 12.1 ± 1.8 42.6 ± 1.3
PA 6 V-0 47 ± 1 47.5 ± 1.6 11.9 ± 2.4 40.7 ± 0.8
2.3. Temperatures of Melting Drops
To measure the temperatures of the drops, the experimental setup is similar to that used for melt dripping, i.e., the test bars are fixed, and the pre-heated furnace is raised in position. Similar to the phenomenon in fire tests, such as vertical UL 94, the material escapes from further heating in the furnace by dripping. This study was undertaken to relate the temperatures of the molten drops to the decomposition temperatures (T5 wt % from TGA) of the respective polymers in order to get an indication
of the degree of decomposition. The drop temperatures are average temperatures recorded by drops falling directly on and through circularly-arranged thermocouples immediately beneath the furnace. The setup delivered quite accurate results with an uncertainty of only ±2 °C. The drop temperatures of PBT, PP, PP-EP and PA 6 with various UL 94 classifications as a result of different furnace temperatures are plotted in Figure 9. The drop temperatures were much lower than the set furnace temperatures. Thus, the main response of the test bar to an external heating source was melting and dripping; the thermal decomposition of the material is a minor effect that became more important at higher temperatures. The temperature of the first only partly molten piece falling down was about 50 °C for PP, PP-EP and PBT and 100 °C for PA 6 at all furnace temperature settings, which is much lower than the temperatures recorded for the subsequent drops given in Figure 9, and this was disregarded for the calculation of the average drop temperature at a particular furnace setting. The melting temperatures, as well as the beginning of decomposition measured by DSC and TGA (Table 3) are also presented as horizontal lines and bars, respectively, in Figure 9.
Dripping below the melt temperature is mainly a result of local softening of the specimen. All polymers independent of the exposed temperature showed this behaviour at the first partly molten piece falling down. Above the melting temperature, ordered crystalline lattice domains melt into an unordered liquid. This transition from a thermoelastic to a thermoplastic state is associated with a loss in mechanical properties. Between melting temperature and decomposition temperature, the viscosity of
Figure 8. (a) Melt flow of PA 6 HB at a furnace temperature of 400˝C; (b) melt flow and drops of PA 6 HB at 550˝C; and (c) drop pathway of PA 6 V-2 at 550˝C.
Table 6. Summary of melt dripping results for PA 6 HB, PA 6 V-2 and PA 6 V-0 at 600˝C.
Sample No. of Drops Total Mass Loss Dripping Total Mass Loss Volatilization Reside Mass
/% /% /%
PA 6 HB 32˘4 23.9˘1.3 22.1˘2.5 54.0˘1.2
PA 6 V-2 40˘2 45.3˘0.5 12.1˘1.8 42.6˘1.3
PA 6 V-0 47˘1 47.5˘1.6 11.9˘2.4 40.7˘0.8
2.3. Temperatures of Melting Drops
To measure the temperatures of the drops, the experimental setup is similar to that used for melt dripping, i.e., the test bars are fixed, and the pre-heated furnace is raised in position. Similar to the phenomenon in fire tests, such as vertical UL 94, the material escapes from further heating in the furnace by dripping. This study was undertaken to relate the temperatures of the molten drops to the decomposition temperatures (T5 wt %from TGA) of the respective polymers in order to get an indication of the degree of decomposition. The drop temperatures are average temperatures recorded by drops falling directly on and through circularly-arranged thermocouples immediately beneath the furnace. The setup delivered quite accurate results with an uncertainty of only˘2˝C. The drop temperatures of PBT, PP, PP-EP and PA 6 with various UL 94 classifications as a result of different furnace temperatures are plotted in Figure 9. The drop temperatures were much lower than the set furnace temperatures. Thus, the main response of the test bar to an external heating source was melting and dripping; the thermal decomposition of the material is a minor effect that became more important at higher temperatures. The temperature of the first only partly molten piece falling down was about 50 ˝C for PP, PP-EP and PBT and 100 ˝C for PA 6 at all furnace temperature settings, which is much lower than the temperatures recorded for the subsequent drops given in Figure 9, and this was disregarded for the calculation of the average drop temperature at a particular furnace setting. The melting temperatures, as well as the beginning of decomposition measured by DSC and TGA (Table3) are also presented as horizontal lines and bars, respectively, in Figure9.
in mechanical properties. Between melting temperature and decomposition temperature, the viscosity of the material decreases, and the polymer starts melt flowing and dripping. Beyond the decomposition temperature (T5 wt %), polymers start to decompose. At this stage, the drops consisted of both molten and decomposed polymer.
Materials2015, 8 14
the material decreases, and the polymer starts melt flowing and dripping. Beyond the decomposition temperature (T5 wt %), polymers start to decompose. At this stage, the drops consisted of both molten and
decomposed polymer.
Figure 9. Temperature of drops as a function of furnace temperature with various UL 94 classifications for: (a) PBT HB, PBT V-2, PBT V-1, PBT V-0; (b) PP HB, PP V-2, PP-EP HB, PP-EP V-2; and (c) PA 6 HB, PA 6 V-2, PA 6 V-0.
Figure 9 presents the drop temperatures of PBT HB, PBT V-2, PBT V-1 and PBT V-0 as a function of the furnace temperature. The average drop temperature of all PBT compounds increased linearly between 200 °C and the starting temperature of decomposition. The drop temperature of PBT HB at the lowest furnace temperature of 450 °C was very low and far below the measured melting temperature in the DSC. The break-up of only partly molten materials was concluded to be similar to that for the first drops. PBT V-2, PBT V-1 and PBT V-0 exhibited similar drop temperatures much closer to the expected melting temperature at a furnace setting of 450 °C. For all of the investigated furnace temperatures, the drop temperatures were observed in the order PBT HB << PBT V-2 < PBT V-1 < PBT V-0. At a furnace temperature of 650 °C, the observed drop temperatures of PBT HB were about 274 and 312 °C for PBT V-2, 324 °C for PBT V-1 and 344 °C for PBT V-0, respectively. The drop temperatures of PBT V-2 are always 30–50 °C higher than the drop temperatures of PBT HB. The drop temperatures of PBT V-2 < PBT V-1 < PBT V-0 were observed in margins of 20–30 °C. The drop temperatures agree very well with the mass loss results (Figure 3b). With higher UL 94 classification, a delay in mass loss occurred, associated with higher drop temperatures.
Figure 9. Temperature of drops as a function of furnace temperature with various UL 94 classifications for: (a) PBT HB, PBT V-2, PBT V-1, PBT V-0; (b) PP HB, PP V-2, PP-EP HB, PP-EP V-2; and (c) PA 6 HB, PA 6 V-2, PA 6 V-0.
Materials2015,8 5635
PP HB, PP V-2, PP-EP HB and PP-EP V-2 exhibited drop temperatures below the melting temperature at the lowest furnace setting at 350 ˝C. Both an insufficient material quantity due to a low melt flow and the distance between furnace and thermocouples might be the cause of these drop temperatures. The average drop temperature of PP HB, PP V-2, PP-EP HB and PP-EP V-2 increased linearly with increasing furnace temperature up to the temperature at the beginning of decomposition (T5 wt %). Above this temperature, the drop temperatures showed a clear kink and approximated a plateau at about 310˝C, shown in Figure9b. The kink in the dependence of drop temperature on furnace temperature indicates decomposition of the polymer. The flame retardant in PP V-2 and PP-EP V-2 caused a reproducible reduction of the drop temperature in comparison to the drop temperature of PP HB and PP-EP HB, respectively. The drop temperatures of PP V-2 and PP-EP V-2 to PP HB and PP-EP V-2 differed by 17˘3˝C at higher furnace temperatures. The drop temperatures correspond very well to the starting time of mass loss in the dripping experiment (Figure 5b), as well as to decomposition temperature (T5 wt %). The earlier mass loss in the dripping experiment goes along with the reduction of the drop temperature. The decomposition temperature and the associated shift of the decomposition product balance towards low molecular chain fragments limit the maximum drop temperature. The dramatic reduction of the complex viscosity supports the drop temperature results.
Figure9c shows the drop temperature of PA 6 HB, PA 6 V-2 and PA 6 V-0. The drop temperatures of PA 6 HB increase rather linearly with increasing furnace temperatures until the decomposition temperatures (T5 wt %) are reached. The drop temperature levelled off at the decomposition temperature at a furnace temperature of 600 ˝C. The drop temperatures were observed in the order PA 6 HB > PA 6 V-2 > PA 6 V-0. At furnace temperatures of 500 and 550 ˝C, the drop temperature of PA 6 V-2 is around 30˝C lower than the drop temperature of PA 6 HB. The drop temperatures of PA 6 V-0 levelled off at around 233˝C, a temperature far below the onset of the decomposition temperature. Thus, with increasing furnace temperature, the drop temperature of PA 6 V-0 exhibited drop temperatures far below PA 6 HB and PA 6 V-2. The decrease in drop temperature for PA 6 V-2 and PA 6 V-0 is proposed to be directly linked to the earlier dripping and to be caused by the enhanced decomposition compared to PA 6 HB.
2.4. Rheological Measurement
Of course, the dripping experiments indicated that the viscosity, of the melt and the pyrolysing melt, is one of the most important factors controlling the dripping behaviour. Thus, rheological experiments on the polymers, as well as the collected drops were performed under well-defined conditions.
MaterialsMaterials20152015,, 88 563717
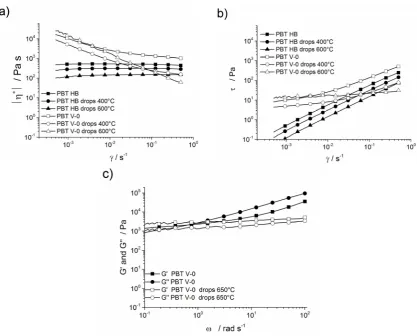
Figure 10. (a) Complex viscosity of PBT HB, PBT V-0 and their drops as a function of shear rate; (b) shear stress versus shear rate for PBT HB, PBT V-0 and its drops; and (c) storage modulus and loss modulus of PBT V-0 and its molten drops at 650 °C.
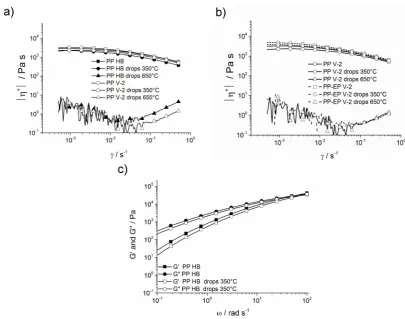
The rheological behaviour of PP HB and PP V-2 and its drops is presented in Figure 11a. The complex viscosity showed a plateau value at low shear rates and is consistent with the zero-shear viscosity. With increasing shear rates, all materials, except drops, exposed to a 650 °C furnace temperature showed a decrease in complex viscosity due to a reduction of lost deformation energy. No significant variation in the curve shape between PP V-2, PP HB and their respective drops exposed to a 350 °C furnace temperature was noted. PP V-2 and its drops at 350 °C had slightly higher viscosity than PP HB. For both PP HB and PP V-2, a tiny decrease in complex viscosity was ascertained for the drops at just a 350 °C furnace temperature, caused by partial decomposition of the polymer chains. The complex viscosity decreased dramatically and actually could no longer be properly determined (the data appear to be noisy, indicating the loss of reliability) for PP HB and PP V-2 drops at a furnace temperature of 650 °C. The viscosity in combination with drop temperatures above the decomposition temperature (T5 wt %) indicated fairly complete damage of the polymer chain structure due to random chain
scissions [38]. PP-EP displayed a behaviour similar to PP, shown in Figure 11b. The decreased complex viscosity of PP-EP V-2 drops exposed to a 350 °C furnace temperature indicates the initial decomposition. The PP-EP V-2 drops at a 650 °C furnace temperature showed a very similar viscosity behaviour, indicating intensive decomposition as PP V-2 drops exposed to a 650 °C furnace temperature. Figure 11c shows the storage and loss moduli of PP HB and its drops exposed to 350 °C. PP HB and its
Figure 10.(a) Complex viscosity of PBT HB, PBT V-0 and their drops as a function of shear rate; (b) shear stress versusshear rate for PBT HB, PBT V-0 and its drops; and (c) storage modulus and loss modulus of PBT V-0 and its molten drops at 650˝C.
a G1 <G11 behaviour. The cross-over frequency of PP HB is noted at 53.4 rad
¨s´1, with a value of 61.4 rad¨s´1for its drops.
Materials2015, 8 18
drops displayed a G′ < G′′ behaviour. The cross-over frequency of PP HB is noted at 53.4 rad·s−1, with
a value of 61.4 rad·s−1 for its drops.
Figure 11. (a) Complex viscosity of PP HB, PP V-2 and their molten drops as a function of shear rate; (b) complex viscosity of PP V-2, PP-EP V-2 and their molten drops as a function of shear rate; and (c) storage modulus and loss modulus of PP HB and its molten drops at 350 °C.
The complex viscosities for PA 6 HB, PA 6 V-2, PA 6 V-0 and their drops at 400 and 600 °C are shown in Figure 12a. The rheology was measured on samples stored at 23 °C and 50% humidity, so that all samples show an increase in viscosity and resistance towards flow (Figure 12b) at low shear rates due to their water content and corresponding H-bonding. The increased complex viscosity at low shear rates is caused by an increase in the storage modulus, shown in Figure 12c. The PA 6 HB, PA 6 V-0 and its drops, except for PA 6 V-0, exposed to a 600 °C furnace temperature, exhibited a constant complex viscosity at higher shear rates. The cross-over frequency of PA 6 V-0 is noted at 0.1 rad·s−1. The drop
material of PA 6 V-0 exposed to 400 and 600 °C had a cross-over frequency at 0.7 and 2.3 rad·s−1,
respectively. The material therefore has a dominant elastic behaviour at low shear rates. The shear stress decreased with increasing shear rate, approximated a limit and increased at higher shear rates. This phenomenon is dependent on the shear rate and the time, i.e., the drying effect [39] of the sample during the measurement. The viscosity values at low shear rates may not reflect the actual dripping behaviour of the materials. The complex plateau viscosity is defined as Newtonian viscosity and is discussed to compare the viscosity during melt flow and dripping. PA 6 V-0 had a slightly higher viscosity than PA 6 HB due to melamine cyanurate particles. The plateau viscosity value of PA 6 V-0 was about
Figure 11.(a) Complex viscosity of PP HB, PP V-2 and their molten drops as a function of shear rate; (b) complex viscosity of PP V-2, PP-EP V-2 and their molten drops as a function of shear rate; and (c) storage modulus and loss modulus of PP HB and its molten drops at 350˝C.
Materials2015,8 5639
500 Pa¨s, with 400 Pa¨s for PA 6 HB and 300 and 300 Pa¨s for their drops obtained on exposure of the polymers to a 400 ˝C furnace temperature. This reduction in complex viscosity is attributed to the initiated decomposition of the polymer chains. The complex viscosity of PA 6 V-0 drops exposed to a furnace temperature of 400 ˝C exhibited a higher complex viscosity than did PA 6 HB drops. The products of the self-condensation of melamine help the polymer to remain in the condensed phase, to undergo charring [22] and to build up a solid phase. Increasing char residue formation is also noted in the TGA. Under synthetic air, the mass loss of the last decomposition step increased along with flame-retarding content (PA 6 HB 11.5 wt %, PA 6 V-0 14.1 wt %). The drops of PA 6 HB and PA 6 V-0 exposed to 600˝C showed a viscosity reduction at higher shear rates due to advanced polymer decomposition. In comparison to the viscosity of PA 6 HB drops at 600 ˝C, the decreased and more sloped complex viscosity of PA 6 V-0 drops at a 600 ˝C furnace temperature indicates an increased decomposition towards smaller chain fragments due to melamine cyanurate.
Materials2015, 8 19
500 Pa·s, with 400 Pa·s for PA 6 HB and 300 and 300 Pa·s for their drops obtained on exposure of the polymers to a 400 °C furnace temperature. This reduction in complex viscosity is attributed to the initiated decomposition of the polymer chains. The complex viscosity of PA 6 V-0 drops exposed to a furnace temperature of 400 °C exhibited a higher complex viscosity than did PA 6 HB drops. The products of the self-condensation of melamine help the polymer to remain in the condensed phase, to undergo charring [22] and to build up a solid phase. Increasing char residue formation is also noted in the TGA. Under synthetic air, the mass loss of the last decomposition step increased along with flame-retarding content (PA 6 HB 11.5 wt %, PA 6 V-0 14.1 wt %). The drops of PA 6 HB and PA 6 V-0 exposed to 600 °C showed a viscosity reduction at higher shear rates due to advanced polymer decomposition. In comparison to the viscosity of PA 6 HB drops at 600 °C, the decreased and more sloped complex viscosity of PA 6 V-0 drops at a 600 °C furnace temperature indicates an increased decomposition towards smaller chain fragments due to melamine cyanurate.
Figure 12. (a) Complex viscosity of PA 6 HB, PA 6 V-0 and their drops as a function of shear rate; (b) shear stress versus shear rate for PA 6 HB, PA 6 V-0 and its drops at a 600 °C furnace temperature; and (c) storage modulus and loss modulus of PA 6 V-0 and its drops at a 600 °C furnace temperature.
2.5. Mode of Actions of the Flame Retardant in the UL 94 Test
The halogen-free flame retardant in combination with PTFE in PBT increased the viscosity at low shear rates by an induced flow limit for shear rates below a yield point. The certain resistance to stresses at low shear rates hinders melt flow and dripping. The drop temperature, drop size and starting time of
Figure 12. (a) Complex viscosity of PA 6 HB, PA 6 V-0 and their drops as a function of shear rate; (b) shear stressversusshear rate for PA 6 HB, PA 6 V-0 and its drops at a 600˝C furnace temperature; and (c) storage modulus and loss modulus of PA 6 V-0 and its drops at a 600˝C furnace temperature.
2.5. Mode of Actions of the Flame Retardant in the UL 94 Test
mass loss increased, whereas the total mass loss decreased. The V-0 classified material PBT V-0 was non-dripping in the UL 94 test.
Tetrabromobisphenol A bis(2,3-dibromopropyl ether) in PP-EP V-2 decreased the T5 wt % decomposition temperature, the starting time of mass loss in the dripping experiment, the drop temperature, the drop size and the viscosity of the PP-EP V-2 drops. The total mass loss in the dripping experiment increased. All of these factors correspond to each other consistently and indicate an enhanced decomposition of the polymer chains by the halogenated flame retardant and, thus, promoted dripping. PP-EP V-2 achieved a V-2 classification in the UL 94 test due to enhanced dripping of the polymer and removal of fuel and heat from the flame zone. The flame retardant in PP V-2 functioned similarly and enhanced the dripping of the polymer by shifting the balance of the decomposition product to a lower molecular mass.
In the dripping experiment, melamine cyanurate decreased the starting time of mass loss, theT5 wt % decomposition temperature and the drop temperature in PA 6 V-2 and PA 6 V-0. These reductions suggest an enhanced decomposition to low molecular decomposition chain fragments associated with the promotion of dripping. The complex viscosity of drops of PA 6 V-0 at a 600˝C furnace temperature decreased. This relationship confirms the interference of melamine cyanurate in the decomposition of PA 6. PA 6 V-2 and PA 6 V-0 achieved a V-2 and V-0 classification in the UL 94 test due to enhanced dripping of the polymer and removal of fuel and heat from the flame zone, respectively.
3. Experimental Section 3.1. Materials
The commercial flame retardant PBT V-0 (Celanex XFR 4840, Celanese, Frankfurt, Germany) contains organic phosphinate and had a UL 94 classification of V-0. PBT with UL 94 Classifications V-2 (PBT V-0) and V-1 (PBT V-1) was compounded from HB-classified PBT (PBT HB, Celanex 2002-2, Celanese, Frankfurt, Germany) with 5% and 10% aluminium diethyl phosphinate (Exolit OP1240, Clariant, Sulzbach, Germany), respectively. PBT V-2, PBT V-1 and PBT V-0 contained a small amount of PTFE.
The flame retardant PP V-2 (Polyflam RPP 2000, A. Schulmann, Kerpen, Germany) contains a halogen-free, radical-generating flame retardant and has a UL 94 classification of V-2. Non-flame-retarded PP with UL 94 classification of HB was provided by LyondellBasell (PP HB, Moplen HP501H, A. LyondellBasell, Frankfurt, Germany). PP-EP V-2 (Hostacom PPR 7342 FL, LyondellBasell, Frankfurt, Germany) contained a halogen-containing flame retardant, BDDP and Sb2O3. The UL 94 classification was V-2. PP-EP with the same impact modification as PP-EP V-2 (PP-EP HB, Moplen EP 300K, LyondellBasell, Frankfurt, Germany) was used non-flame-retarded with UL 94 Classification HB.
Materials2015,8 5641
Table 7. Material.
Materials UL 94 Classification (1.6 mm) Flame Retardant
PBT HB HB –
PBT V-2 V-2 Aluminium diethylenphoshinate
PBT V-1 V-1 Aluminium diethylenphoshinate
PBT V-0 V-0 Organic phosphinate
PP HB HB –
PP V-2 V-2 Radical generator
PP-EP HB HB –
PP-EP V-2 V-2 Tetrabromobisphenol A bis(2,3-dibromopropyl ether)
PA 6 HB HB –
PA 6 V-2 V-2 Melamine cyanurate
PA 6 V-0 V-0 Melamine cyanurate
From polymer pellets, polymer sheets 100 mm ˆ 100 mm ˆ 3 mm in size were prepared by a melt pressing process (pressure of 20 bar for 20 min, 30 min cooling time). PBT was dried for 4 h at 120 ˝C and immediately pressed at a temperature of 250 ˝C. To minimise moisture content, PA 6 was dried in a vacuum oven at 80 ˝C. The pressing temperature used for all PA 6 materials was 240 ˝C. PP was pressed at a temperature of 190 ˝C. After drying overnight, PP-EP specimens were injection-moulded using an industrial-scale injection moulding machine K 65/180/55 CX V by Krauss Maffei (Munich, Germany,Tmax210˝C,Tmould30˝C). The polymer sheets were then cut into specimens of 100 mmˆ6 mmˆ3 mm.
3.2. Characterisation Methods
The thermal and thermo-oxidative stability of the materials was investigated by TGA under 30 mL¨min´1 nitrogen flow or 30 mL¨min´1synthetic air flow, respectively. Then, 5˘0.1 mg samples (PBT) and 10˘0.1 mg samples for PP and PA 6 were heated from 30–900˝C in a Netzsch-TG 209 ASC F1 Iris (Netzsch, Selb, Germany) at a heating rate of 10˝C¨min´1. For the beginning of decomposition, the temperature at 5 wt % mass loss (T5 wt %) was used. DSC was carried out using a Netzsch DSC 204F1 (Netzsch, Selb, Germany) under nitrogen atmosphere (50 mL¨min´1). The samples (approximately 8.0˘0.1 mg) were heated from´40–250˝C at a heating rate of 10˝C¨min´1for three successive runs (heating, cooling and heating).
Materials2015, 8 22
Figure 13. Scheme of the experimental setup for: (a) mass loss measurement; and (b) temperature measurement.
Rheological analyses of polymers and their molten drops were conducted using a plate-plate rheometer (Rheometer MCR 501, Anton Paar, Ostfildern, Germany) in oscillation mode at 230 °C for PBT and PA 6 and 190 °C for PP, respectively. The angular frequency was 100–0.1 rad·s−1 with a
deformation amplitude of 0.5%.
4. Conclusions
The melt dripping behaviour of different polymers and the effect of flame retardants has been investigated. The work was carried out using three commercial polymers (PBT, PP, PP-EP and PA 6) with conventional flame retardants. The melt flow and dripping behaviour were highly dependent on the polymer, flame retardant, flame retardancy mode of action and additive.
The decreased total mass loss and higher drop temperature of the PBT V-2, PBT V-1 and PBT V-0 investigated are due to induced yield points at low shear rates. PTFE was used as an anti-dripping agent, crucially reducing melt flow and dripping. PP and impact-modified PP-EP featured similar dripping behaviours. Extensive decomposition resulted in extremely low viscosities due to the loss of the polymeric chain structure at higher furnace temperatures. The decomposition is enhanced by the flame retardants used, particularly at the beginning of decomposition, to achieve V-2 classification in PP V2 and PP-EP V2. PA 6 V-2 and PA 6 V-0 exposed to an external heating exhibited drops with decreased complex viscosity. The promotion of dripping of flame-retarded PA 6 by melamine cyanurate was apparent by a greater total mass loss, an earlier starting time of the mass loss and higher drop temperatures.
Supplementary Materials
Supplementary materials can be accessed at: http://www.mdpi.com/1996-1944/8/9/xxxx/s1.
Acknowledgments
The authors would like to thank European COST Action “Sustainable flame retardancy for textiles and related materials based on nanoparticles substituting conventional chemicals”, —FLARETEX MP1105, for funding a short-term scientific mission of one of the authors, Melissa Matzen. The
Figure 13. Scheme of the experimental setup for: (a) mass loss measurement; and (b) temperature measurement.
Rheological analyses of polymers and their molten drops were conducted using a plate-plate rheometer (Rheometer MCR 501, Anton Paar, Ostfildern, Germany) in oscillation mode at 230 ˝C for PBT and PA 6 and 190 ˝C for PP, respectively. The angular frequency was 100–0.1 rad
¨s´1 with a deformation amplitude of 0.5%.
4. Conclusions
The melt dripping behaviour of different polymers and the effect of flame retardants has been investigated. The work was carried out using three commercial polymers (PBT, PP, PP-EP and PA 6) with conventional flame retardants. The melt flow and dripping behaviour were highly dependent on the polymer, flame retardant, flame retardancy mode of action and additive.
The decreased total mass loss and higher drop temperature of the PBT V-2, PBT V-1 and PBT V-0 investigated are due to induced yield points at low shear rates. PTFE was used as an anti-dripping agent, crucially reducing melt flow and dripping. PP and impact-modified PP-EP featured similar dripping behaviours. Extensive decomposition resulted in extremely low viscosities due to the loss of the polymeric chain structure at higher furnace temperatures. The decomposition is enhanced by the flame retardants used, particularly at the beginning of decomposition, to achieve V-2 classification in PP V2 and PP-EP V2. PA 6 V-2 and PA 6 V-0 exposed to an external heating exhibited drops with decreased complex viscosity. The promotion of dripping of flame-retarded PA 6 by melamine cyanurate was apparent by a greater total mass loss, an earlier starting time of the mass loss and higher drop temperatures.
Supplementary Materials
Materials2015,8 5643
Acknowledgments
The authors would like to thank European COST Action “Sustainable flame retardancy for textiles and related materials based on nanoparticles substituting conventional chemicals”, —FLARETEX MP1105, for funding a short-term scientific mission of one of the authors, Melissa Matzen. The assistance of John Miles from the Institute for Materials Research and Innovation at the University of Bolton with certain experimental measurements is gratefully acknowledged. The material provision by Celanese GmbH, Clariant Produkte (Deutschland) GmbH, A. Schulman Inc. and Rhodia A.S. is acknowledged.
Author Contributions
Melissa Matzen contributed to the acquisition of the project, conceived the scientific work and the working packages. Melissa Matzen carried out the specimen preparation, the experiments, and the data evaluation. Melissa Matzen performed scientific discussion and conclusions, and wrote the paper. Baljinder Kandola contributed to the concept and performing of dripping experiments, writing the paper and supervision of the work. Christian Huth preformed the rheological experiments and contributed to their scientific interpretation. Bernhard Schartel made the acquisition of the project and designed the project. Bernhard Schartel conceived the scientific work, and collaborated on the data interpretation, scientific discussion and conclusions. Bernhard Schartel supervised the work and contributed to the paper writing.
Conflicts of Interest
The authors declare no conflict of interest.
References
1. Dittrich, B.; Wartig, K.-A.; Hofmann, D.; Mülhaupt, R.; Schartel, B. Carbon black, multiwall carbon nanotubes, expanded graphite and functionalized graphene flame retarded polypropylene nanocomposites. Polym. Adv. Technol. 2013,24, 916–926. [CrossRef]
2. Dittrich, B.; Wartig, K.-A.; Hofmann, D.; Mülhaupt, R.; Schartel, B. Flame retardancy through carbon nanomaterials: Carbon black, multiwall nanotubes, expanded graphite, multi-layer graphene and graphene in polypropylene. Polym. Degrad. Stab. 2013,98, 1495–1505. [CrossRef] 3. Schartel, B.; Beck, U.; Bahr, H.; Hertwig, A.; Knoll, U.; Weise, M. Sub-micrometre coatings as an
infrared mirror: A new route to flame retardancy. Fire Mater.2012,36, 671–677. [CrossRef] 4. Wu, G.M.; Schartel, B.; Bahr, H.; Kleemeier, M.; Yu, D.; Hartwig, A. Experimental and quantitative
assessment of flame retardancy by the shielding effect in layered silicate epoxy nanocomposites. Combust. Flame2012,159, 3616–3623. [CrossRef]
5. Schartel, B.; Weiß, A. Temperature inside burning polymer specimens: Pyrolysis zone and shielding. Fire Mater. 2010,34, 217–235. [CrossRef]
7. Ohlemiller, T.; Butler, K. Influence of polymer melt behavior on flammability. UJNR 2000, 1, 81–88.
8. Wang, Y.; Zhang, F.; Chen, X.; Jin, Y.; Zhang, J. Burning and dripping behaviors of polymers under the UL 94 vertical burning test conditions. Fire Mater.2010,34, 203–215.
9. Karlsson, L.; Lundgren, A.; Jungqvist, J.; Hjertberg, T. Influence of melt behaviour on the flame retardant properties of ethylene copolymers modified with calcium carbonate and silicone elastomer. Polym. Degrad. Stab. 2009,94, 527–532. [CrossRef]
10. Kempel, F.; Schartel, B.; Marti, J.M.; Butler, K.M.; Rossi, R.; Idelsohn, S.R.; Oñate, E.; Hofmann, A. Modelling the vertical UL 94 test: Competition and collaboration between melt dripping, gasification and combustion. Fire Mater. 2014. [CrossRef]
11. Zhang, J.; Lewin, M.; Pearce, E.; Zammarano, M.; Gilman, J.W. Flame retarding polyamide 6 with melamine cyanurate and layered silicates. Polym. Adv. Technol. 2008,19, 928–936. [CrossRef] 12. Kandola, B.K.; Price, D.; Milnes, G.J.; da Silva, A. Development of a novel experimental technique
for quantitative study of melt dripping of themoplastic polymers. Polym. Degrad. Stab. 2013,98, 52–63. [CrossRef]
13. Kandola, B.K.; Ndiaye, M.; Price, D. Quantification of polymer degradation during melt dripping of thermoplastic polymers. Polym. Degrad. Stab.2014,106, 16–25. [CrossRef]
14. Wang, Y.; Jow, J.; Su, K.; Zhang, J. Dripping behavior of burning polymers under UL 94 vertical test conditions. J. Fire Sci.2012,30, 477–501. [CrossRef]
15. Wang, Y.; Chen, X.; Tang, X.; Du, X. A new approach for the simultaneous improvement of fire retardancy, tensile strength and melt dripping of poly(ethylene terephthalate). J. Mater. Chem. 2003,13, 1248–1249. [CrossRef]
16. Zhang, J.; Shields, T.J.; Silcock, G.W.H. Effect of melting behaviour on upward flame spread of thermoplastics. Fire Mater. 1997,21, 1–6. [CrossRef]
17. Casu, A.; Camino, G.; de Giorgi, M.; Flath, D.; Morone, V.; Zenoni, R. Fire-retardant mechanistic aspects of melamine cyanurate in polyamide copolymer.Polym. Degrad. Stab. 1997,58, 297–302. [CrossRef]
18. Pawlowski, K.H.; Schartel, B. Flame retardancy mechanisms of triphenyl phosphate, resorcinol bis(diphenyl phosphate) and bisphenol bis(diphenyl phosphate) in polycarbonate/acrylonitrile-butadiene-styrene blends. Polym. Int. 2007, 56, 1404–1414. [CrossRef]
19. Dittrich, B.; Wartig, K.-A.; Hofmann, D.; Mülhaupt, R.; Schartel, B. The influence of layered, spherical, and tubular carbon nanomaterials’ concentration on the flame retardancy of polypropylene. Polym. Compos.2014,36. [CrossRef]
20. Schartel, B.; Braun, U.; Knoll, U.; Bartholmai, M.; Goering, H.; Neubert, D.; Pötschke, P. Mechanical, thermal, and fire behavior of bisphenol a polycarbonate/multiwall carbon nanotube nanocomposites. Polym. Eng. Sci. 2008,48, 149–158. [CrossRef]