SPEED RELATED DEFECT DETECTION IN A SETA 4-BALL LIFE
TESTING MACHINE
by
C. C. OSUAGWU
Department of Electronic Engineering, University of Nigeria Nsukka (Manuscript received June 1987)
ABSTRACT
Many rotating machines operate over a range of speeds. It is therefore of practical interest in machine condition monitoring to see if there is a relationship between the speed at which diagnostic inspection is carried out and the early detection of incipient defect in the machine. In this paper, the effect of operating speed in the early detection of incipient defect in a Seta mechanism is investigated using a number of techniques. It is shown that for-an analysis bandwidth optimum for incipient defect detection, the detection sensitivity is improved if the diagnostic inspection of the mechanism is carried out at lower rather than higher speeds.
1. INTRODUCTION
The problem of reliably discriminating between good and defective waveforms is central to the diagnosis of a mechanism's condition. The solution lies in extracting from the vibrational signature parameters which are easy to obtain yet highly effective in discriminating between the two states. In the diagnosis of incipient rolling contact fatigue failure it was found that the parameter values were a function of the detailed structure of the waveform, the bandwidth of analysis, the operating conditions and the signal degradation.
In this paper, the variation of parameter values with speed is investigated with a view to establishing a relationship between the test speed and the early detection of incipient defect. The following parameters were used in the analysis:
1. The normalized Average Magnitude
of the Difference Signal, AMDS. 2. The Crest Factor, CF.
3. The Kurtosis, K.
1.1 GENERAL PROBLEM OF SELECTING AN ANALYSIS BANDWIDTH
In selecting an analysis band-width for rolling element defect detection, consideration should be given to
i. the machine specific nature of the excited resonances ii. the dependence of the
excited resonances on defect severity
1.2 MACHINE SPECIFIC NATURE OF THE EXCITED RESONANCES
The impacts due to the collision of parts, example, ball on race defect, can act as impulsive loading which excites the bearing elements and housing into resonance Published results of several researchers in the field of bearing monitoring, a sample of which is given in table
Table 1: Table of reported optimum Analysis Bandwidth for bearing defect detection
Author Technique Frequency band
Martin Power spectrum 8-20KHZ
Weichbrodt (2) Crest factor Above 10 KHZ
Dyer (3) Kurtosis 2 KHZ -50 KHZ in
5 bands
Boto (4) Number of peaks in envelope 30 KHZ -40 KHZ
that an examination of the defect data in the frequency ranges encompassing the system or component resonances is very sensitive for the detection of defect using a variety of techniques. A close study of the results of table 1 reveals that the impact excited resonances sensitive for defect resonances sensitive for defect detection are machine (test rig) dependent.
The problem with defect detection using the resonant frequencies is that since there are no analytical techniques for reliably computing the bearing housing and structural resonances, the rig under test has to be vibrated. In practice it may not be possible or permissible to do this.
The approach used in the work reported in this paper to select the frequency band most sensitive to incipient Seta defect was to investigate the variation of Kurtosis in six frequency bands, (5-500) Hz, (500 Hz - 1kHz), (1-2) KHz, (2-3) KHz, (3-5) KHz and (5-10) KHz. It was found that the most sensitive frequency range for detecting incipient seta defect was the (5-500) Hz followed by the (1-2) KHz band. Beyond 2 KHz, the defect was not detectable in its incipient state. In this paper, the analysis of the Seta data is confined to the optimum frequency band (5-500) Hz.
1.3 DEPENDENCE OF THE EXCITED RESONANCES ON DEFECT SEVERITY Although only the incipient stage of defect is dealt with in this paper, it is important to note that the excited system resonances vary with defect severity. In severe malfunctions,
the defect 1s of such a size that it is almost continuously under load resulting in a stream of impacts. This combination of high impact repetition rate and increased impact duration causes the defect information to be translated to higher frequencies as the defect becomes severe. Dyer (3) has shown that kurtosis will fail to detect severe defect unless the frequency band is changed to detect a higher frequency resonance.
2. SETA FOUR BALL LIFE TESTING MACHINE
The seta four ball life testing machine is generally used to study lubricant properties which may affect bearing life and to evaluate the life of rolling elements (5). In this study its ability to produce the same type of failure as ball bearings
quickly and relatively
inexpensively is utilized to obtain data on fatigue failure under rolling contact conditions.
The Seta four ball machine consists of four balls, a thin tufnol cage used to separate the three lower balls and a ball cup which holds the three lower balls (6). The shaft holding the upper ball is driven by an electric motor and tests can be conducted up to a speed of 3000 rpm. The rolling elements are loaded through a thrust bearing by hanging static weights an appropriate distance from the fulcrum of a lever machanism. A high loading of 600 Kg was used in the test in order to accelerate the time to produce the first fatigue spall.
CONDITIONS
The vibrational data was produced by a B & K accelerometer, type 4367 stud mounted on the ball cup of a seta four ball machine. The useable
frequency range of the
accelerometer extends up to 10 KHz. After amplification the output of the accelerometer was recorded on magnetic tape for each recording using a Nagra IV S.L. tape reorder and this recorder was used as the input device for the subsequent analysis. Most of the data was acquired for a constant 10dd of 600 Kg and three test speeds of 1000 rpm, 1920 rpm and 3000 rpm were used. The average time for defect initiation on the upper ball was three hours and for all tests defect had occured within five hours. The lubricant used was liquid parafin maintained at a constant temperature of 90 0C.
Table 2 shows the data name used to describe the different Seta operating conditions in the rest of the paper, as well as the impact period of an upper ball defect.
4. DETERMINATION OF THERESONANT EQUENCIES OF THE SETA MECHANISM USING HOMOMORPHIC DECONVOLUTION In Section 1.2, it was stated that the frequency range most sensitive to incipient Seta defect was the (5-500) Hz band followed by the (1-2) KHz band. Table 1 show that the excited resonances sensitive for defect detection are machine specific. Since the frequency ranges (5-500) Hz and (1-2) KHz are low compared to that used by other researchers (see table 1), it became necessary to find out if these low frequency bands correspond to the, excited resonances of the seta mechanism. Since the rig could not be vibrated, homomorphic filtering (7) was used to deconvolve the impact excitation due to defect from the system response in order to study the resonant structure of the Seta mechanism from the filtered out system response.
4.1 BASIC THEORY OF HOMOMORPHIC FILTERING
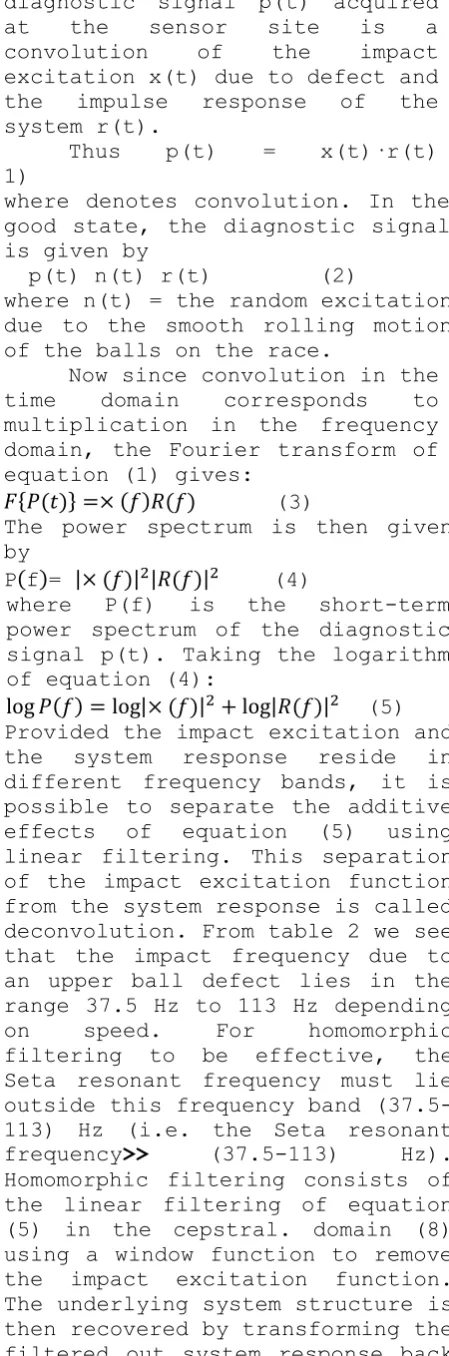
In the time domain, the diagnostic signal p(t) acquired at the sensor site is a convolution of the impact excitation x(t) due to defect and the impulse response of the system r(t).
Thus p(t) = x(t)·r(t) 1)
where denotes convolution. In the good state, the diagnostic signal is given by
p(t) n(t) r(t) (2)
where n(t) = the random excitation due to the smooth rolling motion of the balls on the race.
Now since convolution in the time domain corresponds to multiplication in the frequency domain, the Fourier transform of equation (1) gives:
{ } (3)
The power spectrum is then given by
| | | | (4)
where P(f) is the short-term power spectrum of the diagnostic signal p(t). Taking the logarithm of equation (4):
to the spectral domain. The resulting power spectrum is called the homomorphed log power spectrum. the system resonant frequencies correspond to the locations of significant peaks in
the homomorphed log power spectrum
4.2 RESULTS
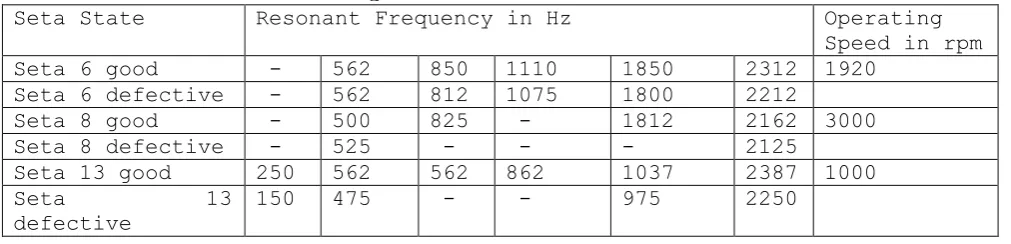
Table 3 shows the frequency location of the most significant peaks
Table 2,: Data Nmaes
DATA NAME SPEED IN RPM IMPACT PERIOD OF
UPPER BALL DEPECT IN msec.
SETA 13 1000 26.67
SETA 6 1920 13.88
SETA 8 3000 8.88
Table 3: RESONATNT FREQUENCISE OF SETA MECHANISM
Seta State Resonant Frequency in Hz Operating
Speed in rpm
Seta 6 good - 562 850 1110 1850 2312 1920
Seta 6 defective - 562 812 1075 1800 2212
Seta 8 good - 500 825 - 1812 2162 3000
Seta 8 defective - 525 - - - 2125
Seta 13 good 250 562 562 862 1037 2387 1000
Seta 13
defective
150 475 - - 975 2250
from the homomorphed log power spectra of the Seta signal. Three important factors emerge from the results of table 3:
1. A Seta resonant frequency occurs in the range 400 Hz - 600 Hz. This resonance is excited at all operating speeds and in all states (good or defective). Thus the analysis band (5-500) Hz found to be sensitive to incipient defect detection
encompasses a system
resonance. Also system resonant frequencies occur in the (1-2) KHz band.
2. The exact resonant frequencies excited appear to be speed dependent. Notice the lower resonances excited only at 1000 rpm.
3. Since these rig resonances are also excited in the good state, the analysis bandwidth sensitive to incipient defect detection can be selected in the good state.
It should be pointed out that the
rig resonances carry no
diagnostic information. They are valuable because examination of the defect data in the frequency ranges encompassing the system resonances is very sensitive for the detection of incipient defect using a variety of techniques.
Having shown that the analysis bandwidth (5-500) Hz which encompasses a seta resonant frequency is optimum for defect detection, in the rest of the paper we investigate the effect of operating speed on the detection sensitivity of the following three parameters: AMDS, Kurtosis and Crest factor.
5. ANALYSIS TECHNIQUES
2.1 THE NORMALIZED AVERAGE MAGNITUDE OF THE DIFFERENCE SIGNAL
relation ∑| | ∑| | (6) where x(i) is the discret
Seta signal and N is the number of samples in the data length analysed. This parameter gives a measure of the frequency behaviour of the signal with onset of defect in the seta mechanism. If the difference signal is denoted by y(i), then
(7) Taking the z-transform of equation 7 gives
(8)
The frequency response is then
[ ]
( )
| | | | (9) Where T is the sampling interval.
Hence the output is a function of the frequency of the signal and the value of the AMDS will as a consequence decrease with the onset of defect as the signal becomes pseudo periodic and impulsive. The multiplying factor of two in the denominator of equation (6) is needed to limit the maximum value of the AMDS to unity. If the AMDS value varies consistently between the good and defect data, then it can be used to detect the state of the seta mechanism.
In order to obtain reliable results, it is essential to analyse a number of signatures. In the analysis carried out, the time history was divided into 9 to 12 groups, where each group contained fifty segments. The statistics of the AMDS in each group was then computed and used for discriminating between the good and defect Seta states.
5.2 CREST FACTOR AND KURTOSIS Let xi,, 1,……N ,denote a
sequence of N samples of a data section with Pmax as the maximum
value and pmin as the minimum
value. If the mean, m, and the
standard deviation, of the data are given by
∑ (10)
√ ∑
then the Crest Factor, CF, and Kurtosis, K, of the signal are given by the relations.
CF = ∑ … (11) For a zero mean data, RMS - the standard deviation).
Crest factor and Kurtosis are parameters which measure respectively the peakiness of the data and the peakiness of the
underlying statistical
distribution of the data. The variability in Kurtosis due to the analysis of a finite length of samples is computed from the relation (Kenney, 1947) (9): standard deviation error for Kurtosis,
√
In our case N =8000 samples, so that e 0.55. Hence the standard
deviation error is small since the data length analysed is sufficiently long to ensure good statistical accuracy. Therefore any variability in the measured Kurtosis values cannot be attributed to the standard deviation error.
6. SIGNAL CHARACTERISTICS
can be identified. This is
expected as the primary
excitation in the good state is the smooth rolling motion of the balls. On the other hand, the incipient defect waveforms are characterized by quasi-periodic high amplitude impacts of very short duration superimposed on a low level background noise. These quasiperiodic impacts are produced when the defect on the upper ball hits the lower balls. In general, individual impacts show about eight to ten percent deviation from the averaged impact repetition rate. This quasi-periodicity may be due to slip of the rolling e1ements at the contacts or to a slow oscillation of the shaft speed over it; nominal value. The
alternation of the high
amplitude impacts and the low back- ground noise gives the defect waveforms a discrete appearance. It can also be seen that the random background activity on which the impacts are superimposed as well as the· impact repetition 'rate increase with speed. Thus the clearest visual discrimination between the good and the incipient defect waveforms can be made at low speeds in this case 1000 rpm.
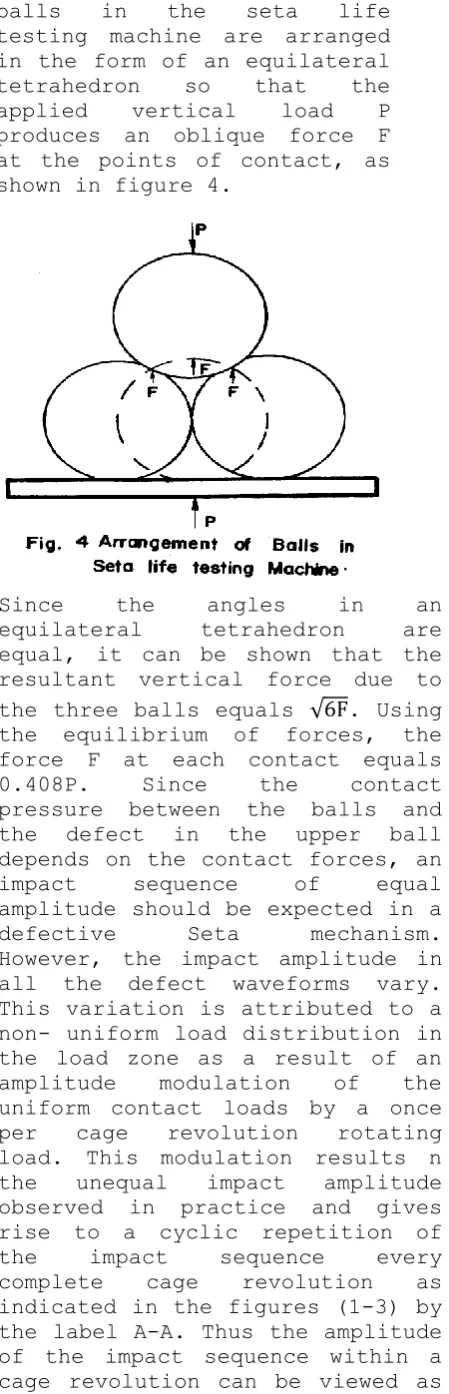
Theoretically the impact amplitude in each defective wave- from should be equal as a result of the uniform loading between the top ball and each of the lower balls. This follows from the fact that the
balls in the seta life testing machine are arranged in the form of an equilateral tetrahedron so that the applied vertical load P produces an oblique force F at the points of contact, as shown in figure 4.
Since the angles in an
equilateral tetrahedron are equal, it can be shown that the resultant vertical force due to the three balls equals √ . Using the equilibrium of forces, the force F at each contact equals 0.408P. Since the contact pressure between the balls and the defect in the upper ball depends on the contact forces, an impact sequence of equal amplitude should be expected in a defective Seta mechanism. However, the impact amplitude in all the defect waveforms vary. This variation is attributed to a non- uniform load distribution in the load zone as a result of an amplitude modulation of the uniform contact loads by a once per cage revolution rotating load. This modulation results n the unequal impact amplitude observed in practice and gives rise to a cyclic repetition of the impact sequence every complete cage revolution as indicated in the figures (1-3) by the label A-A. Thus the amplitude of the impact sequence within a cage revolution can be viewed as
carrying a low frequency envelope structure corresponding to the cage defect frequency.
Thus the good waveform can be characterized as being impact independent and the defective waveform as being impact dependent.
7. AMDS RESULTS
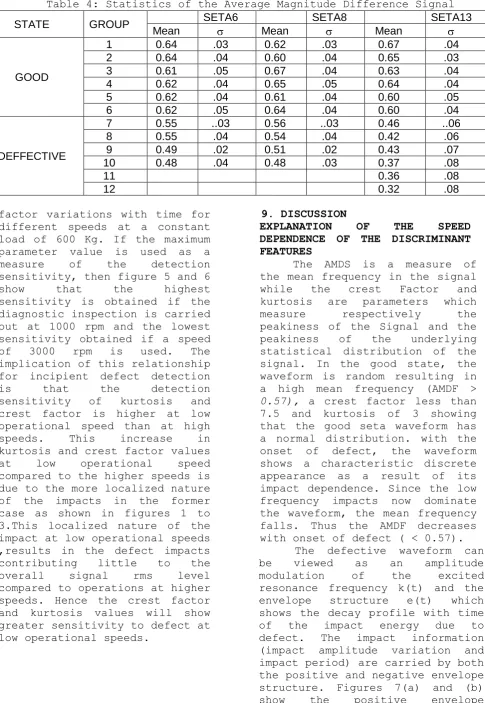
Table 4 gives the statistics of the AMDS over all the operating conditions of interest. It can be seen that AMDS for the good data is greater than that for the defective data confirming that the frequency of the Seta decreases with the onset
of defect, see section 5.1. A clear distinction exists between the average AMDS values in the two states, the greatest separability occuring in the seta 13 data, obtained using the lowest test speed. The AMDS threshold for the seta was set at 0.57. Hence a seta mechanism whose signatures have an average AMDS> 0.57 is good otherwise it is defective.
However, if defect detection is based on the unaveraged AMDS values, then two thresholds will be required to effect partial discrimination between the good and defect waveforms in the Seta 6 and 8 data. This is because a region of overlap will occur, as can be seen by examining the standard deviation. It is only for the seta 13 AMDS values that perfect discrimination can be made between the good and defect waveforms based on the unaveraged AMDS values. Hence a greater separability between the good and defect waveforms can be effected at the lower operating speed using the AMDS technique.
8. KURTOSIS RESULTS
Table 4: Statistics of the Average Magnitude Difference Signal
STATE GROUP SETA6 SETA8 SETA13
Mean Mean Mean
GOOD
1 0.64 .03 0.62 .03 0.67 .04
2 0.64 .04 0.60 .04 0.65 .03
3 0.61 .05 0.67 .04 0.63 .04
4 0.62 .04 0.65 .05 0.64 .04
5 0.62 .04 0.61 .04 0.60 .05
6 0.62 .05 0.64 .04 0.60 .04
DEFFECTIVE
7 0.55 ..03 0.56 ..03 0.46 ..06
8 0.55 .04 0.54 .04 0.42 .06
9 0.49 .02 0.51 .02 0.43 .07
10 0.48 .04 0.48 .03 0.37 .08
11 0.36 .08
12 0.32 .08
factor variations with time for different speeds at a constant load of 600 Kg. If the maximum parameter value is used as a measure of the detection sensitivity, then figure 5 and 6
show that the highest
sensitivity is obtained if the diagnostic inspection is carried out at 1000 rpm and the lowest sensitivity obtained if a speed of 3000 rpm is used. The implication of this relationship for incipient defect detection
is that the detection
sensitivity of kurtosis and crest factor is higher at low operational speed than at high speeds. This increase in kurtosis and crest factor values at low operational speed compared to the higher speeds is due to the more localized nature of the impacts in the former case as shown in figures 1 to 3.This localized nature of the impact at low operational speeds ,results in the defect impacts contributing little to the overall signal rms level compared to operations at higher speeds. Hence the crest factor and kurtosis values will show greater sensitivity to defect at low operational speeds.
9. DISCUSSION
EXPLANATION OF THE SPEED DEPENDENCE OF THE DISCRIMINANT FEATURES
The AMDS is a measure of the mean frequency in the signal while the crest Factor and kurtosis are parameters which
measure respectively the
peakiness of the Signal and the peakiness of the underlying statistical distribution of the signal. In the good state, the waveform is random resulting in a high mean frequency (AMDF >
0.57), a crest factor less than
7.5 and kurtosis of 3 showing that the good seta waveform has a normal distribution. with the onset of defect, the waveform shows a characteristic discrete appearance as a result of its impact dependence. Since the low frequency impacts now dominate the waveform, the mean frequency falls. Thus the AMDF decreases with onset of defect ( < 0.57).
structure for the seta signal at
3000 rpm and 1000 rpm
respectively. As can be seen from these figures, at the impact
instant the impact Signal level A is maximum and this decays to the residual
signal level A1 at the begining of
the next impact. At the lower operational speed of 1000 rpm the excited resonance ring down has time to die down before the next impact. This results in very low residual impact signal level A1 and
the consequent characteristic discrete appearance of figure 2. The crest factor and kurtosis rise dramatically since the impact contribution to the overall rms level is very low. The AMDS falls in response to the low mean frequency of the signal.
At the higher operational speed of 3000 rpm, the ring down has not had time to decay sufficiently before the next impact arrives. The result is that 'the residual impact signal level A1 is
high and so the quiet period fills up considerably. The waveform begins to resemble the good waveform as shown in figure 3.
Because the impact contribution to
the overall rms level is now high, the crest factor and kurtosis fall. The AMDS rises to detect a higher mean frequency. As the operating speed is increasing more and more, the defect waveform appears random as the residual signal completely fills up the quiet zones. The kurtosis and crest factor will fall to the good state values and the AMDS will rise to the good state value. These discriminant features will fail to detect the defect at the higher operational speeds unless the data is examined at a higher frequency resonance where the discrete nature of the signal is restored. Examination of the data at higher frequencies implies a higher sampling rate and a bigger memory capacity to store the sampled data.
The rate at which the excited resonance ring down decays can be calculated by defining a resonance
ring down index (RDI).
For the seta data
(13)
As can be seen from equations (12)
and (13) the excited resonance
ring down is a function of the damping d which is a constant for the mechanism under study and the impact period. T. Since the impact period depends on the operating speed at the incipient stage of defect, the excited resonance ring down is a function of operating speed.
The results of sections 7 and 8 show that from the viewpoint of diagnosis, Kurtosis and crest factor are more sensitive parameters for incipient defect
detection than the AMDS
descripitor. This is because for the Seta data, the amplitude change with onset of defect measured by kurtosis and crest factor is much higher than the frequency change with defect measured by the AMDS.
CONCLUSION
The results of this study on incipient rolling contact fatigue failure have shown that for a mechanism whose incipient stage of defect is characterised by the presence of impacts and whose good state is impact independent, detection sensitivity is enhanced if the diagnostic inspection is carried out at lower rather than higher speeds. It has also been shown that the optimum analysis bandwidth can be selected in the good state using homomorphic filtering if it is not possible or permissible to vibrate the mechanism. It has also been shown that from the viewpoint of diagnosis, Kurtosis and crest factor are more sensitive
parameters for detecting
incipient defect than the AMDS descriptor.
REFERENCES
1. Martin, R.L. "Detection of Ball Bearing Malfunction". Instruments and Control Systems, Dec. 1970.
2. Weichbrodt, B., smith, K.A. "Signature Ana1ysis Non- instrusive Technique for
Incipient Failure
Identification, Applications to Bearings and Gears". ASTM, Sept. 1970.
3. Dyer, D. "Bearing Condition Monitoring: Interim Report
No.2" Southampton
University, Dept. of
Mech.Eng. 1974.
4. Boto, P.A. "Detection of Bearing Damage by Shock Pulse Measurements". SKF BBI 710/01, Reprint of Ball Brg. Jn. l67, 1971
5. Scott, D., Mills, G.H. "Spherical Particles - Its Occurrence Formation and Significance in· Rolling Contact Fatigue. Wear Vol. 24, p235-242, 1973.
6. Osuagwu, C.C., Thomas, D.w. "Effect of Inter-Modulation
and Quasi-Periodic
Instability in the Diagnosis of Rol1ing Element Incipient Defect" Trans ASME, Vol. 104, p.296-302, 1982
7. Oppenheim, A.V., Schafer,
R.M. Digital Signal
Processing. Prentice-Hall Inc., New Jersey, 1975
Determination" J.A.S.A. Vol. 41, p.293-309, 1967.
9. Kenney, J.F.
Mathematics of
Statistics, Van
Nostrand, New York, 1947.