CommuNICABle dISeASeS rePort, mAy ANd JuNe 2005
For updated information, including data and facts on specific diseases, visit www.health.nsw.gov.au and click on Infectious Diseases.
treNdS
Tables 2 and 3 and figure 4 show reports of communicable diseases received through to the end of May and June 2005 in NSW by area health service.
meNINGoCoCCAl dISeASe Cluster 1
In late May, the Sydney office of the South Eastern Sydney Illawarra Public Health Unit reported a cluster of two cases of meningococcal disease in students residing on the same floor of a university residential college.
Case 1 was a university student who was admitted to hospital in late May with a three-day history of an influenza-like illness and vomiting. On presentation the student was found to have a petechial rash and the clinical diagnosis of meningococcal septicaemia was confirmed by a positive polymerase chain reaction blood test for meningococcus serogroup B. Following treatment for a relatively mild illness, the patient was discharged.
Case 2 presented to hospital the day after case 1, also with a three-day history of an influenza-like illness, which progressed to rigors, headache and nausea. A day later, case 2 developed a purpuric rash on the forearms and this spread to the legs. The patient’s condition rapidly deteriorated and the patient required admission to an intensive care unit. The clinical diagnosis of meningococcal septicaemia was confirmed by blood culture to be meningococcus serogroup B. The patient recovered and was discharged.
Case 2 attended the same university faculty as case 1 but did not share any university classes or tutorials with case 1. However, both cases resided on the same floor of a four-floor college. There were approximately 70 other students on that floor. The cases reported no direct contact with each other, although both had attended the same entertainment venue at one point during the previous week.
On the advice of a rapidly convened advisory panel (that included expertise in microbiology, public health, and the university health service) the public health unit provided information to all the college’s residents via email and noticeboards in common areas. In collaboration with the university’s health service, the public health unit established a clinic at the college that offered antibiotic prophylaxis (ciprofloxacin) to all other residents of the same college floor. No further cases were identified.
Cluster 2
Northern Sydney/Central Coast Public Health Unit reported
meningococci in June. Case 1, a teenager, was admitted to the local hospital and the diagnosis was confirmed on polymerase chain reaction of spinal fluid. A second student, case 2, developed symptoms consistent with bacterial meningitis two days after case 1, and the diagnosis of serogroup B was subsequently confirmed by polymerase chain reaction of spinal fluid. Public health unit staff arranged for counselling and antibiotic prophylaxis for close contacts of both cases, letters to be sent home to parents of other children at the school, and advised local emergency departments to be alert for further cases. Cases 1 and 2 were in different years at the school. Although initially no obvious links between the students could be found (such as common classes or sporting teams) it emerged that they travelled on the same school bus across several suburbs each day. The public health unit arranged for clinics to be held at the cases’ school and at one of the other schools involved to provide antibiotic prophylaxis to other children and the drivers who had travelled with the cases on the bus.
The public health unit subsequently received a report from a laboratory that a third student from the cases’ school had a positive serological test (IgM) for meningococci. This student had onset of fever, headache, drowsiness, vomiting, sore throat and erythematous rash seven days after onset of case 2 and was treated with antibiotics as a precaution. The student had travelled on the same bus as cases 1 and 2, but had not attended the clinic for prophylaxis because of illness. Although blood cultures and polymerase chain reaction testing were negative for meningococcal disease, counselling and antibiotic prophylaxis was arranged for close contacts. However, subsequent testing of convalescent sera showed a decline in IgM antibody levels, which was not supportive of the diagnosis of meningococcal disease, and the diagnosis remains unclear.
This investigation is important for several reasons. First, it serves as a reminder that while household contacts of a case are at highest risk of disease, transmission in other settings can occur on rare occasions. Transmission of meningococcal disease has previously been reported among children who shared a school bus in the United States1 and in two adults
who crossed the Pacific by aeroplane to Sydney.2 Second,
where clusters are identified, a thorough search for common links is vital for a better understanding of the group of contacts who are at increased risk of disease. In this case, the link was not apparent until the cases were asked directly if they knew each other. Secondary informants (even parents) may not be able to reliably identify all the relevant contacts of cases. Third, communication to those at higher risk of the disease can help with early identification and treatment of related cases.
contacts; however, occasionally clusters can occur in institutional settings such as residential colleges. Specific recommendations for the control of clusters can be found
in: Guidelines for the early clinical and public health
management of meningococcal disease in Australia (see:
www.health.gov.au/internet/wcms/Publishing.nsf/Content/ cda-pubs-other-mening.htm).
References
Harrison LH, Armstrong CW, Jenkins SR, et al. A cluster of meningococcal disease on a school bus following epidemic influenza. Arch Int Med 1991; 151: 1005–9.
Communicable diseases report, NSW, for May 2003. NSW Public Health Bull 2003; 14: 151–8. Available from: www. health.nsw.gov.au/public- health/phb/HTML2003/july03html/ cdrp151.html.
PertuSSIS rePortS oN INCreASe
Case reports of pertussis have begun to increase in recent months. By date of onset of illness, case notifications last peaked in September 2004 (553 cases), and subsequently declined to a low of 300 cases in March 2005. The resurgence in cases appears to have begun in May 2005 and at the time of writing 388 cases reporting onset in June were notified (although because of delays in patients seeing their doctor and a diagnosis being made, the number of these notifications is likely to increase substantially).
In 2005, of 2158 pertussis cases notified to 29 June, 6% were in preschool-aged children, 9% in school-aged children and 85% in people over 18 years of age. The proportion of cases among primary-school-aged children has declined gradually in the past few years from 24% in 2000 to 16% in 2003 and 4% so far in 2005. This trend is probably related to a cohort effect following the introduction of pre-school age booster dose of diphtheria-tetanus-pertussis (DTP) vaccine in 1994. The proportion of cases among high-school-aged children declined more sharply from 18% in 2000 and 19% in 2003 to 5% in 2005 so far. This trend is probably related to NSW Health’s high-school immunisation program, which vaccinated over 330,000 NSW students between May 2004 and June 2005.
Pertussis is an unpleasant disease to experience at any age, but especially dangerous for babies. Babies are particularly prone to infection until they have received two or three doses of pertussis-containing vaccine (DTPa at two, four and six months). They are also at risk of developing severe disease because of their small airways. To protect them, parents should keep their babies away from people with coughing illnesses and ensure that their baby—and everyone else in the household (including older siblings, grandparents, and the parents themselves)—is fully vaccinated. An adult formulation of the pertussis vaccine is available (as dTpa) and is recommended for new parents and grandparents, as well as anyone who deals with small children, such as health care and child care workers.
1.
2.
eNterIC dISeASe
The number of notifications of patients with cryptosporidiosis increased further in May (105 cases), with the majority of patients residing in metropolitan areas of NSW (69%). A large proportion of patients were residents of southeastern Sydney (24 cases) and northern Sydney (23 cases). Public health unit staff routinely interview cases where a cluster is identified and, in addition, have been asked to interview all cases reported in NSW since 1 May. Interviews with patients identified no common sources; however, 30% reported contact with another person with diarrhoea and 52% reported swimming at a pool during the previous two weeks. Seven different pools in the metropolitan area were mentioned as common swimming spots by clusters involving at least two cases. While this information does not prove that these pools were the source of infection, as a precaution they were reviewed for compliance with NSW Health’s guidelines Minimising the risk of cryptosporidium contamination in public swimming pools and spa pools
(see: www.health.nsw.gov.au/public-health/ehb/general/ pools/cryptopools.pdf).
Forty-one cases of salmonellosis caused by infection with
Salmonella Typhimurium phage type 9 were reported to the NSW Department of Health in May and June. Of these, 18 reported eating pork or chicken rolls or other food from a bakery in the Sydney West area in the three days before onset of illness. Another five cases of gastroenteritis (cause not confirmed, but who ate with some of the confirmed cases) were linked to this bakery. Of the 18 cases, 14 reported consuming these products between May 10 and 13. Another case of S. Typhimurium phage type 9 reported consuming a pork roll from a different bakery in the Sydney South West area during the incubation period. In addition, five other confirmed cases reported consuming food on a single day in late May at a club in the Sydney West area in the three days before onset of their illness. The NSW Food Authority evaluated these three facilities and found that they shared a common egg supplier. The egg supplier’s farm was also evaluated and S. Typhimurium phage type 9 was isolated from a rinse from a soiled egg collected at the farm.
A multi-state investigation of S. Hvittingfoss infections began in June following an increase in notifications from eastern Australia, including 10 from NSW (six in May and four in June). Hypothesis-generating interviews were conducted with eight NSW cases. No likely cause has been identified, and the number of notifications has since declined.
CommuNICABle eNterIC dISeASeS: 2004 IN reVIew
NSW recently reviewed notifiable enteric diseases reported in 2004, using data derived from routine surveillance and outbreak investigations undertaken by public health unit staff in area health services and the Communicable Diseases Branch. The collection of these data is facilitated by Australian Department of Health and Ageing resources provided through the OzFoodNet surveillance program. Notifiable enteric disease highlights in NSW in 2004 included:
a 16% increase in notifications of all conditions (including salmonellosis, listeriosis, shigellosis, haemolytic uraemic syndrome, verotoxigenic Escherichia coli
infections, typhoid and paratyphoid)—2346 compared with 2014 notifications in 2003. Salmonellosis was the most frequently notified, accounting for 91% of these conditions
a 14% increase in notifications of salmonellosis (2127 cases, a rate of 31.5 per 100,000 population, compared to 1864 cases in 2003, a rate of 27.9 per 100,000). The reason for this increase is unclear
a higher crude rate of Salmonella notifications in rural areas (39.8 per 100,000) compared with urban areas (28.9 per 100,000)
the most commonly identified Salmonella serovar was S Typhimurium, which accounted for 54% of all
Salmonella notifications in 2004. The most common
Salmonella infection was S Typhimurium phage type
170/108, which accounted for 29% of all S Typhimurium notifications and for 16% of all Salmonella notifications in NSW in 2004
a 29% increase in typhoid notifications, largely related to travel to countries where typhoid is endemic a 70% increase in shigellosis notifications. No links were identified among cases, and the reason for the increase remains unclear
reports from public health units of 496 enteric disease outbreaks. Of these:
44 (9%) were reported to be foodborne in origin, but the causative agent could not be identified for 70% of outbreaks.
452 were reported to be non-foodborne in origin: more than six times the number reported in 2003 (71). While for 77% the causative agent was not identified, most were probably caused by norovirus infections that spread rapidly through residential facilities. The increase may have been related to the emergence of a new strain of norovirus to which much of the community had little immunity. 1
These data indicate that communicable enteric diseases continue to cause widespread illness in the community. Improved surveillance and investigation of outbreaks •
•
•
•
•
•
•
–
–
in recent years may have contributed to more complete reporting of cases of specific diseases. However, the true incidence of various conditions can be expected to fluctuate from year to year, depending on a range of factors, including the emergence of new strains of pathogens and changing food manufacturing, distribution and handling practices. To help improve the detection, investigation and control of food borne diseases in the State, NSW Health, in collaboration with OzFoodNet and NSW Food Authority, conducted a two-day training workshop on food borne disease investigations for public health unit staff.
Reference
Bull R, Hansman G, Clancy L, Tanaka M, Rawlinson W, White P. Norovirus recombination in ORF1/ORF2 overlap.
Emerg Infect Dis (serial on the Internet). July 2005. Available from: www.cdc.gov/ncidod/EID/vol11no07/04-1273.htm. Accessed 15 November 2005.
GAStroeNterItIS outBreAk At A reSIdeNtIAl ColleGe lINked to A Self-SerVe food BAr
Bradley Forssman, Leena Gupta and Sharon Salmon
Sydney South West (Eastern Zone) Public Health Unit
In May 2005, Sydney South West (Eastern Zone) Public Health Unit was notified by the staff of a local hospital that five people who lived in a university residential college had presented to the emergency department with symptoms of gastroenteritis. The public health unit was also informed by hospital staffthat other college residents were unwell with similar symptoms. Here we detail the investigations and actions undertaken to limit the outbreak following the notification.
The residential college is located in an inner west suburb of Sydney and is home to 173 residents, the majority of whom study at the adjacent university campus. All meals are provided in a common dining area and are prepared by staff employed by a large commercial catering company. There is a common self-serve salad bar used by all students at every meal.
Initial response
Public health unit staff, with the cooperation of the college administration, initially conducted interviews with those residents known to be unwell with gastroenteritis using a standardised hypothesis-generating questionnaire. This did not reveal any specific foods or meals shared by all cases, but did demonstrate onset times that were spread over a period of three days. Catering staff and management were interviewed by the public health unit regarding any recent gastrointestinal illness. All staff denied having any current or recent symptoms suggestive of gastroenteritis, and stool samples were not requested from them. NSW Food Authority staff inspected the college’s food preparation and serving areas and interviewed catering staff about food handling practices. Food samples were collected and
analysed for bacterial pathogens. Environmental health officers assessed the hygienic state of the bathroom and toilet facilities.
The pattern was initially suggestive of person-to-person transmission rather than a food-borne outbreak. Infection control and personal hygiene education, in the form of fact-sheets, were given to college residents and staff and the public health unit gave short talks to the students on two occasions about minimising person-to-person transmission. Despite these initial infection control measures, the outbreak of gastroenteritis continued over the next week and we decided to undertake a case-control study among all residents of the college.
Cohort study
We developed a standardised written questionnaire that collected information on residents’ demographic characteristics, onset and nature of symptoms, and which meals they had eaten in college over the week commencing three days prior to the first case of illness.
A case was defined as a resident of the college who developed vomiting or diarrhoea between 1 and 14 May 2005. Questionnaires were distributed to college residents during meals in the dining hall as well as through personally addressed envelopes. To improve response the questionnaires were sent electronically one week later to those college residents who had not yet returned a questionnaire (personal details were provided by college
administration). Data were entered onto and analysed using Epi Info for Windows version 3.3. Frequencies of responses were tabulated and strengths of associations between variables were analysed using the χ2 statistic.
Stool samples collected from patients presenting to the emergency department were sent to the Area’s laboratory service for microscopy, culture and sensitivity tests, and viral studies.
Results
Ninety-two of the 173 residents returned completed questionnaires (response rate 53%). Of these, 37 (40%) met the case definition and 53 were well. The remaining two residents complained of diarrhoea and vomiting but their dates of onset were 22 and 26 April 2005, respectively. The epidemic curve is shown in Figure 1.
Among the cases there was a wide variation in the time and date of symptom onset, with the first resident becoming unwell on 22 April 2005 and the last on 12 May 2005. There was a cluster of cases on and around 5 May 2005. The most common symptom was vomiting (85%), followed by fever (82%), nausea (82%), abdominal cramps (82%), headache (79%) and diarrhoea (64%). The majority of cases’ illnesses lasted approximately 24–48 hours. There were no significant differences in the age or sex of cases and other residents. No statistically significant associations were found between the meals that were eaten and the development of symptoms (Table 1).
0 2 4 6 8 10 12 14 16 18 20
Date of onset
Number of cases
22 24 26 28 30
April
2 4 6 8 10 12 14
May fIGure 1
Laboratory results from stool specimens on four patients were negative for bacterial pathogens on microscopy and culture, and negative for norovirus on enzyme immunoassay. The laboratory did not refer the specimens for polymerase chain reaction because the enzyme immunoassay was negative, as per their internal protocol.
Food samples from the self-serve food bar were positive for
E. coli spp but negative for any other bacterial pathogen.
The remainder of food samples were negative for all bacterial pathogens. As there were no clinical specimens positive for norovirus, the food samples were not tested for norovirus.
Implications and further action
It is possible that this gastroenteritis outbreak was of viral origin resulting from person-to-person spread coupled with contamination of food occurring at the self-serve bar. Viral gastroenteritis is known to be associated with vomiting, nausea, abdominal pain, headaches and diarrhoea1, and the
presence of coliforms in food handled directly by college residents implies faecal contamination.2 It is possible that
residents unwell with or recently recovering from viral gastroenteritis (and continuing to shed infectious particles in their stool) inappropriately handled food on the self-serve bar. This, combined with poor personal hygiene practices, may have resulted in food contamination and spread of illness to other residents.
Self-serve food bars have been implicated in a number of previous outbreaks of gastroenteritis.3, 4, 5, 6 These outbreaks,
as well as this most recent one, highlight the need for greater vigilance of self-serve bars to reduce inappropriate handling and resultant contamination of food. In addition, those living in institutional settings, such as residential colleges, should be given regular education regarding personal hygiene and infection control measures. Used together, it is hoped these actions will prevent, or at least lessen the impact of, further outbreaks of gastroenteritis
In light of our concerns about the self-serve food bar being a possible nidus for transmission, arrangements were made with college administration for residents who were unwell to receive their meals in their rooms, rather than attending the dining hall. We also recommended that there be increased supervision by catering staff of the self-serve food bar, in particular ensuring the hygienic use of utensils by residents.
Acknowledgements
We would like to acknowledge the assistance of Brett Campbell, Food Safety Officer, NSW Food Authority, and Geoff Tan, Environmental Health Officer, Sydney South West (Eastern Zone) Public Health Unit in conducting food and environmental inspections, and the administration, staff and residents of the college for their cooperation and assistance in this investigation.
References
Heymann DL, editor. Control of communicable diseases manual. 18th ed. Washington DC: American Public Health Association; 2004: 224–7.
Allwood PB, Malik YS, Maherchandani S, Vought K, Johnson LA, Braymen C, Hedberg CW, Goyal SM. Occurrence of Escherichia coli, noroviruses, and F-specific coliphages in fresh market-ready produce. J Food Protection 2004; 67: 2387–90.
Moe CL, Christmas WA, Echols LJ, Miller SE. Outbreaks of acute gastroenteritis associated with Norwalk-like viruses in campus settings. JAm College Health 2001; 50: 57–66. Kapperud G, Rorvik LM, Hasseltvedt V et al. Outbreak of
Shigella sonnei infection traced to imported iceberg lettuce.
J Clin Microbiol 1995; 33: 609–14.
Fone DL, Lane W, Salmon RL. Investigation of an outbreak of gastroenteritis at a hospital for patients with learning difficulties. Commun Dis Public Health 1999; 2: 35–8. Kilgore PE, Belay ED, Hamlin DM, et al. A university outbreak of gastroenteritis due to a small round-structured virus: Application of molecular diagnostics to identify the etiologic agent and patterns of transmission. J Infect Dis
1.
2.
3.
4.
5.
6.
tABle 1
CHArACterIStICS ANd rePorted exPoSureS AmoNG reSIdeNtS wItH GAStroeNterItIS ANd well reSIdeNtS At A uNIVerSIty ColleGe IN NSw, APrIl–mAy 2005 (N=92)
Characteristic or exposure Cases well residents relative risk
(n=39) % (n=53) % 95% CI* p
Mean age (years) 19.46 19.49 t-test, t = -0.057 0.95
Sex Male 21 54 36 68 1.4 0.9–2.2 0.17
Female 18 46 17 32
Drank from water fountain 31 80 33 63 1.5 0.8–2.8 0.16
Ate any meals in college Breakfast 32 82 41 74 1.2 0.6–2.3 0.58
Lunch 35 90 47 89 1.1 0.5–2.4 0.87
Dinner 35 90 47 89 1.1 0.5–2.4 0.87
Ate all meals in college 3 8 6 11 0.8 0.3–2.0 0.56
Ate no meals in college 0 1 2 Undefined 0.58
deClINe IN SeroGrouP C meNINGoCoCCAl dISeASe IN CHIldreN AGed 0–18 yeArS Lindy Fritsche, Katie Irvine, Melanie Boomer
Centre for Health Protection
Meningococcal disease is a serious illness that usually manifests as meningitis and/or septicaemia. In previous years in NSW, about half of the cases of meningococcal disease were caused by infection with serogroup B meningococcus and about a third by serogroup C. In 1999, the United Kingdom introduced meningococcal serogroup C conjugate (MCC) vaccine1 for children aged up to 18 years. An evaluation of this program showed that vaccine effectiveness was high (>83%) in all children who received MCC vaccines in the catch-up campaign at age 5 months to 18 years.2
In October 2002 the Australian Government announced funding over a four-year period for a national meningo-coccal C vaccination program, commencing in early 2003, for all people 1–19 years of age.3 In NSW a school-based immunisation program commenced in August 2003 and was completed in December 2004. During this time, a total of 349,758 high school students and 401,363 primary school students received the meningococcal C vaccination through the school-based clinics (a coverage rate of 76% for high school students and 76% for primary school students). In addition, data from the Australian Childhood Immunisation Register showed that on 31 May 2005, 76% of NSW children aged 3 years and under, and 61% of NSW children aged four to seven years had received a vaccination through their routine vaccination providers.4
There were concerns that serogroup B infection would
increase to fill the ecological niche previously occupied
by serogroup C infection prior to the vaccination program.
Here we compare the age-specific rates of meningococcal disease notifications in NSW after the completion of the
vaccination program with rates preceding and during the program.
Methods
In NSW, hospitals and laboratories are required to notify their local public health unit of the diagnosis of
meningococcal disease. Case notifications are recorded onto the Notifiable Diseases Database (NDD). Meningococcal
disease notifications (excluding conjunctivitis) were
analysed by age group and period of notification. Period of notification was categorised as pre-vaccination program
(May 1998 to April 2003) or mid-program (May 2003 to April 2004) and compared to the most recent 12 months of
notification data (May 2004 to April 2005). Age-specific
incidence rates were calculated using population estimates
as at 30 December. Populations from December 2000 were
used for pre-vaccination program rates, and from December 2003 and 2004 for the subsequent rates.
Rates of meningococcal serogroup C and B notifications were fitted using poisson regression models. The covariates were notification period (pre-vaccination program,
mid-program and post-mid-program) and a binary variable for the target age group (0–18 years). An interaction term was used to assess evidence for a differential change in rates for the age group targeted by the vaccination program. Analysis was conducted using STATA /SE 8.2.
Results
Serogroup C disease
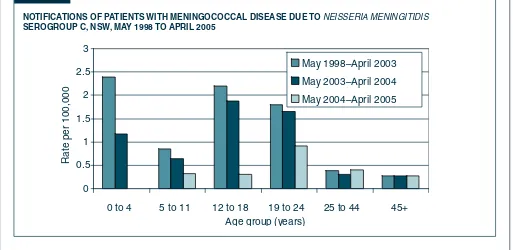
Age-specific rates of serogroup C meningococcal disease notifications are shown in Figure 2. Rates in the target age
fIGure 2
NotIfICAtIoNS of PAtIeNtS wItH meNINGoCoCCAl dISeASe due to NeISSerIa MeNINgITIDIS SeroGrouP C, NSw, mAy 1998 to APrIl 2005
0 0.5
1 1.5
2 2.5
3
0 to 4 5 to 11 12 to 18 19 to 24 25 to 44 45+ Age group (years)
Rate per 100,000
groups for the period May 2004 – April 2005 were 0 cases per 100,000 for 0–4 year olds and 0.3 per 100,000 for 5–11
and 12–18 year olds. Prior to the vaccination program rates of serogroup C notifications in these age groups were 2.4
cases per 100,000 for 0–4 year olds, 0.9 per 100,000 for 5–11 year olds and 2.2 for 12–18 year olds. There was a
significant decrease in the notification rate for the target age
group 0–18 years (p<0.001) but little evidence of a change in rates for people aged 19 years and over.
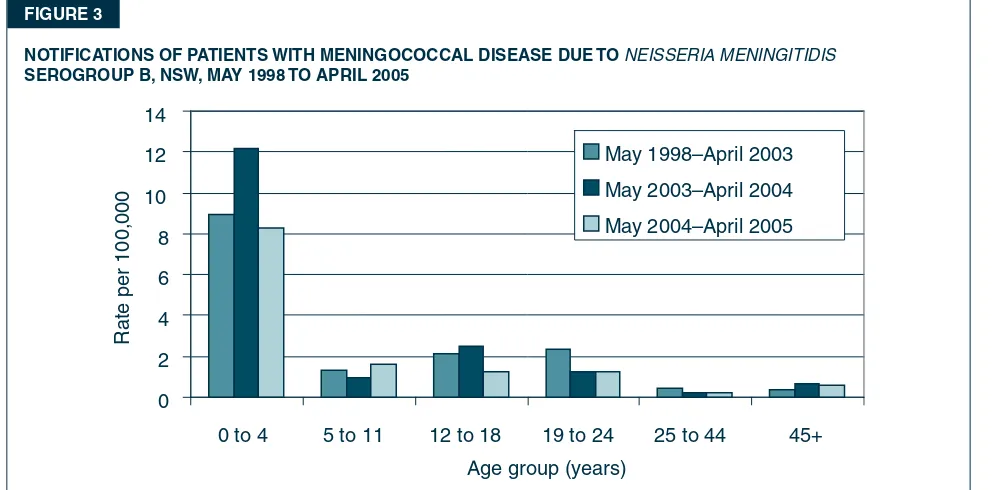
Serogroup B disease
Rates of serogroup B meningococcal disease notifications are shown in Figure 3. There is little evidence that rates in
the most recent period (April 2004 to May 2005) differ from the pre-program rate (May 1998–April 2003). There is also little evidence of a differential change in rate among the target age group, which was observed for serogroup C. Discussion
Rates of meningococcal disease notifications typically
have a bimodal distribution, with peak incidence in young children (0–4 years) and adolescents.2,5 Following the
Meningococcal C Vaccination Program in NSW, rates of serogroup C notifications have decreased sharply among
0–18 year olds. International studies of MCC vaccine campaigns have also reported dramatic reductions in this age group.1,2 To date, there is little evidence that decreases in serogroup C meningococcal disease in NSW
have coincided with increased notifications of serogroup
B disease.
In the UK, vaccine coverage was quite high in all age groups that were targeted (coverage rates generally exceeded 80%) and up to the end of 2001 there were 25
confirmed and one probable vaccine failure. 1 The impact of MCC vaccines on the incidence of meningococcal disease
fIGure 3
NotIfICAtIoNS of PAtIeNtS wItH meNINGoCoCCAl dISeASe due to NeISSerIa MeNINgITIDIS SeroGrouP B, NSw, mAy 1998 to APrIl 2005
0 2 4 6 8 10 12 14
0 to 4 5 to 11 12 to 18 19 to 24 25 to 44 45+ Age group (years)
Rate per 100,00
0
May 1998–April 2003 May 2003–April 2004 May 2004–April 2005
serogroup C in the UK has been substantial: a comparison
of laboratory-confirmed reports of meningococcal disease,
serogroup C in 1999 and 2001 shows a reduction for the targeted age groups of 86.7%.1 Meanwhile there was no change in the incidence of serogroup B disease in the target age group prior to 2002. 1
Rates of meningococcal disease serogroup C have decreased in NSW since the introduction of the vaccination program. Continued surveillance of the epidemiology of the disease and long term evaluation studies measuring the effectiveness of the meningococcal C vaccination program are required to adequately monitor the outcomes of the program and to monitor any effects of the vaccination program on infection with serogroup B.
References
Balmer P, Borrow R. and Miller E. Impact of meningococcal
C conjugate vaccine in the UK, Journal of Medical Microbiology. 2002 ; 51: 717–22.
Trotter C, Andrews N, Kaczmarski E, Miller E. Ramsey M. 2004, Effectiveness of meningococcal serogroup C conjugate vaccine 4 years after introduction, The Lancet 2004; 364, July 24: 365–7.
Patterson K, Minister for Health and Ageing. Media Release:
One million children to get meningococcal C vaccine sooner. November 24, 2002. Available online at: www.health.gov. au/internet/wcms/publishing.nsf/ Content/health-mediarel-yr2002-kp-kp02128.htm.
Health Insurance Commission, Australian Childhood Immunisation Register—Report NIC10. Men C Reporting as at 31 May 05.
Miller E, Salisbury D, Ramsay M, 2001, Planning, registration,
and implementation of an immunisation campaign against meningococcal serogroup C disease in the UK: a success story, Vaccine 2001; Oct 15; 20 Suppl 1:S58–67.
1.
2.
3.
4.
cases cases
Invasive Pneumococcal disease Shigellosis
fIGure 4
rePortS of SeleCted CommuNICABle dISeASeS, NSw, JAN 1999 to JuNe 2005, By moNtH of oNSet
NSW population
Male 50%
<5 7%
5–24 28%
25–64 52%
65+ 13%
Rural* 42%
Apr 05–Jun 05
Male 50%
<5 1%
5–24 8%
25–64 80%
65+ 11%
Rural 96%
Apr 05–Jun 05
Male 52%
<5 50%
5–24 23%
25–64 26%
65+ 1%
Rural 20%
Apr 05–Jun 05
Male 88%
<5 0%
5–24 28%
25–64 72%
65+ 0%
Rural 18%
Apr 05–Jun 05
Male 71%
<5 7%
5–24 36%
25–64 57%
65+ 8%
Rural 14%
Apr 05–Jun 05
All outbreaks 8
Nursing homes 4
Hospitals 1
Child care 3
Schools 0
Other 0
Apr 05–Jun 05
Male 57%
<5 0%
5–24 0%
25–64 43%
65+ 57%
Rural 29%
Apr 05–Jun 05 Male 100%
<5 0%
5–24 50%
25–64 50%
65+ 0%
Rural 0%
Apr 05–Jun 05
Male 46%
<5 24%
5–24 46%
25–64 24%
65+ 6%
Rural 21%
Apr 05–Jun 05
Male 51%
<5 24%
5–24 27%
25–64 41%
65+ 8%
Rural 33%
Apr 05–Jun 05
Male 40%
<5 6%
5–24 17%
25–64 68%
65+ 9%
Rural 32%
Preliminary data: case counts in recent months may increase because of reporting delays. Laboratory-confirmed cases only, except for mea-sles, meningococcal disease and pertussis BFV = Barmah Forest virus infections, RRV = Ross River virus infections lab conf = laboratory confirmed
Men Gp C and Gp B = meningococcal disease due to serogroup C and serogroup B infection, other/unk = other or unknown serogroups. NB: multiple series in graphs are stacked, except gastroenteritis outbreaks.
NB: Outbreaks are more likely to be reported by nursing homes and hospitals than from other institutions
Arbovirus Legionellosis
Cryptosporidiosis Measles
Gonorrhoea Meningococcal disease
Hepatitis A Pertussis
Jan 99
Jan 00
Jan 01
Jan 02
Jan 03
Jan 04
Jan 05
Jan 99
Jan 00
Jan 01
Jan 02
Jan 03
Jan 04
Jan 05
0 80 160 240 320
400 RRV BFV
0 4 8 12
16 L. longbeachae
L. pneumophila
0 20 40 60 80 100 120 140
0 4 8
12 Measles lab conf
Measles other
0 40 80 120 160 200
0 10 20 30 40
Men Gp B Men Gp C
Men other/unk
0 20 40 60 80
0 200 400 600 800
0 500 1000 1500 2000 2500 3000 3500
0 20 40 60 80 100 120 140 outbreaks
cases
cases outbreaks
0 50 100 150 200 250
R
e
POR
TS OF NO
TIFIA ble CONDITIONS R e C e IV e
D IN M
A y 2005 by AR e A H e A lTH S e R VIC e S
Area Health Ser
vice (2005)
Greater Southern
Greater
W
estern
Hunter / Ne
w e ngland Nor th Coast Nor
thern Syd /
Central Coast
South
e
astern
Syd / Illa
warra Sydne y South W est Sydne y W est Total GMA SA FW A MA C MW A HUN N e A MNC NRA CCA NSA Ill S e S CSA SWS W e N WSA JHS for Ma y+ To date+ xuall y transmitted -42 28 8 14 39 93 31 45 50 37 77 45 114 94 69 22 75 1 999 4662 2 -1 -3 4 2 2 1 3 6 29 32 7 -93 590 al* -5 5 1 3 1 11 -4 1 4 32 5 24 49 64 4 52 4 270 1547 al* -15 18 5 4 27 32 7 36 43 36 24 25 43 49 83 10 53 14 526 2617 -1 -1 -2 5 -1 3 1 2 4 2 2 4 3 6 4 15 17 18 1 6 1 90 417 us* 3 -4 1 46 20 -1 -1 -76 247 4 2 1 -17 7 37 14 2 -1 -1 -86 295 1 -1 -1 -3 18 -1 -1 -1 -1 3 -2 1 -10 140 -1 -1 -2 23 -1 1 1 1 -1 1 -2 5 2 -15 59 -1 1 2 -1 2 4 1 -1 -13 54 -2 2 -1 -1 -2 3 1 -12 74 -1 -2 2 6 1 30 2 2 -14 -60 451 ection* 1 1 -1 -3 -3 -2 5 1 4 2 3 2 3 -31 185 inf ection* -2 -2 7 inf ection* 1 -1 -2 1 -5 33 -1 -1 ection (in vasiv e)* -1 -4 1 2 1 1 -10 55 -1 5 -2 -1 -3 -2 11 -25 152 le unisation** 3 -1 -4 -8 43 ection (in vasiv e)* -3 -6 1 -1 1 7 -1 2 -1 -15 54 10 7 3 13 2 23 3 20 14 9 52 16 87 48 29 15 63 -414 1665 -1 -1 7 -2 3 1 -4 4 2 3 6 23 2 24 5 10 5 11 -105 317 5 5 1 9 1 8 4 3 -4 23 4 1 9 8 2 15 -102 619 -3 -1 -1 -1 -3 33 -1 -1 5 -1 -1 -1 -1 -4 14 3 3 1 4 4 5 5 16 16 4 24 8 29 19 19 9 47 -217 1156 -1 3 2 -1 -1 -1 -9 63 atyphoid* -19 E. coli * -1 -1 4 -1
-+ includes cases with unkno
wn postcode
** HIV and AIDS data are repor
ted separ
ately in the Pub
lic Health Bulletin quar
ter
ly
y the school v
accination teams dur
ing the National Meningococcal C Prog
ram are not included in these figures
. These notifications are re
vie
w
ed regular
ly b
y a panel of e
xper
ts and the results will be pub
lished quar
ter
ly in the Pub
lic
N.B:
F
rom 1st J
an 2005, Hunter/Ne
w England AHS also compr
ises Great Lak
es
, Gloucester & Greater
Taree LGAs;
Sydne
y
W
est also compr
ises Greater Lithgo
w LGA
ay Area
MA
C = Macquar
ie Area
MW
A = Mid
W
ester
n Area
HUN = Hunter Area
NEA = Ne
w England Area
MNC = Nor
th Coast Area
NRA = Nor
ther
n Riv
ers Area
CCA = Centr
al Coast Area
NSA = Nor
ther
n Sydne
y Area
ILL = Illa
w
arr
a Area
SES = South Easter
n Sydne
y Area
CSA = Centr
al Sydne
y Area
SWS = South
W ester n Sydne y Area WEN = W entw or th Area WSA = W ester n Sydne y Area
JHS = J
ustice Health Ser
R
e
POR
TS OF NO
TIFIA ble CONDITIONS R e C e IV e
D IN J
UN e 2005 by AR e A H e A lTH S e R VIC e S
Area Health Ser
vice (2005)
Greater Southern
Greater
W
estern
Hunter / Ne
w e ngland Nor th Coast Nor
thern Syd /
Central Coast
South
e
astern
Syd / Illa
warra Sydne y South W est Sydne y W est Total GMA SA FW A MA C MW A HUN N e A MNC NRA CCA NSA Ill S e S CSA SWS W e N WSA JHS for J une+ To date+ xuall y transmitted -40 14 7 13 29 96 19 46 37 42 99 39 170 105 53 21 59 1 908 5720 1 -1 -7 2 1 2 1 7 2 54 25 7 1 5 -119 744 al* -3 2 1 -3 3 3 4 3 7 50 3 29 57 110 6 36 1 322 1936 al* -12 9 2 9 12 29 14 25 21 29 36 35 56 70 81 22 32 2 499 3208 -5 1 -1 4 1 4 -1 2 1 10 1 27 15 23 3 15 -110 530 orest vir us* -1 -1 1 13 12 -2 1 -1 1 -33 280 us* 1 -2 -2 7 -11 5 2 -1 1 -32 329 ection (other)* -1 -2 -2 -5 23 -1 -1 -1 -1 -1 4 -9 148 -23 -3 -1 -2 -2 -8 67 1 1 -2 4 1 -3 -1 1 -1 -15 69
y and other vel*
-2 2 -6 2 -1 1 7 2 -23 117 -1 -1 -3 1 2 1 -6 -13 4 2 -9 -43 498 ection* 5 5 1 1 1 7 1 6 3 7 8 3 5 5 9 7 9 -83 273 longbeachae inf ection* -1 1 -2 9 pneumophila inf ection* -1 -1 34 -1 -1 ection (in vasiv e)* -1 -4 -3 -2 -10 65 -3 -2 1 -6 3 -15 178 ventab le
vent after imm
unisation** -2 -1 -1 -4 50 b inf ection (in vasiv e)* -1 -1 4 -6 -1 -1 -2 -2 -2 -8 65 11 7 -24 7 42 10 24 18 12 57 22 99 43 65 26 88 -555 2242 -1 -1 8 -idiosis* 5 -2 1 14 2 -1 5 30 1 22 14 13 17 21 -149 475 2 3 -4 4 10 3 4 -6 29 1 19 9 16 15 32 -157 791 aemic syndrome -3 -2 -2 1 -1 -6 40 -5 -14 3 3 -12 5 1 13 4 16 1 11 11 16 9 22 -127 1296 -1 -1 1 2 -5 70 atyphoid* -1 1 -2 21 E. coli * -4 ak ob disease -1 -1 2 -1 -1 1
med cases only
+ includes cases with unkno
wn postcode
** HIV and AIDS data are repor
ted separ
ately in the Pub
lic Health Bulletin quar
ter
ly
y the school v
accination teams dur
ing the National Meningococcal C Prog
ram are not included in these figures
. These notifications are re
vie
w
ed regular
ly b
y a panel of e
xper
ts and the results will be pub
lished quar
ter
ly in the Pub
lic
N.B:
F
rom 1st J
an 2005, Hunter/Ne
w England AHS also compr
ises Great Lak
es
, Gloucester & Greater
Taree LGAs;
Sydne
y
W
est also compr
ises Greater Lithgo
w LGA ay Area n Area W est Area MA
C = M
ac qu ar ie A re a MW
A = M
id W es te rn A re a
HUN = H
un
te
r A
re
a
NEA = Ne
w England Area
MNC = Nor
th Coast Area
NRA = Nor
ther
n Riv
ers Area
CCA = Centr
al Coast Area
NSA = Nor
ther
n Sydne
y Area
ILL = Illa
w
arr
a Area
SES = South Easter
n Sydne
y Area
CSA = Centr
al Sydne
y Area
SWS = South
W ester n Sydne y Area WEN = W entw or th Area WSA = W ester n Sydne y Area
JHS = J
ustice Health Ser