The Effectiveness of Computer-Assisted
Instruction in Critical Thinking
DAVID HITCHCOCK
McMaster University
Abstract: 278 non-freshman university students taking a l2-week critical thinking course in a large single-section class, with computer-assisted guided practice as a replacement for small-group discussion, and all testing in machine-scored multiple-choice format, improved their critical thinking skills, as measured by the California Critical Thinking Skills Test (Forms A and B), by half a standard deviation, a moderate improvement. The improvement was more than that reported with a traditional format without computer-assisted instruction, but less than that reported with a format using both computer-assisted instruction and essay-type assignments. Further studies are needed to test hypotheses suggested by these results.
Resume: Deux cent soixante dix-huit universitaires ont suivi un cours de pen see critique de douze semaines dans lequel les pratiques par ordinateur remplafi:aient les discussions en petits groupes, et toutes les epreuves consistaient en questions
a
choix multiple evaluees par ordinateur. Selon les resultats du California Critical Thinking Skills Test (Formes A et B), leurs habiletes se sont ameliorees de la moitie de d'une deviation standard: Une amelioration modeste. Toutefois celle-ci surpassait celie des universitaires qui avaient refi:u un enseignement traditionnel sans I' aide d' ordinateur. Mais elle etait inferieurea
I'amelioration des universitaires qui avaient refi:u un enseignement facilite par des ordinateurs et qui avaient ete evalues par des devoirs d' essais. D' autres etudes seront necessaires pour verifier les hypotheses suggerees par ces resultats. Keywords: critical thinking, skills, instruction, computer-assisted instruction, multiple-choice testing, CCTST, effectiveness, education1. Introduction
Undergraduate critical thinking courses are supposed to improve skills in critical thinking and to foster the dispositions (i.e. behavioural tendencies) of an ideal critical thinker. Students taking such courses already have these skills and dispositions to some extent, and their manifestation does not require specialized technical knowledge. Hence it is not obvious that a critical thinking course actually does what it is supposed to do. In this respect, critical thinking courses differ from courses with a specialized subject-matter not previously known to the students, e.g. organic chemistry or ancient Greek philosophy or eastern European politics. In those courses, performance on a final examination can be taken as a good measure of how much a student has learned in the course. In a critical thinking course, on the other hand, a good final exam will not be a test of such specialized subject-matter as the construction of a Venn diagram for a categorical
I
..
184 David Hitchcock
syllogism or the difference between a reportive and a stipulative definition, but will ask students to analyze and evaluate, in a way that the uninitiated will understand, arguments and other presentations of the sort they will encounter in everyday life and in academic or professional contexts. Performance on such a final examination may thus reflect the student's skills at the start of the course rather than anything learned in the course. If there is improvement, it may be due generally to a semester of engagement in undergraduate courses rather than specifically to instruction in the critical thinking course. There may even be a deterioration in performance from what the student would have shown at the beginning of the course.
We therefore need well-designed studies of the effectiveness of undergraduate instruction in critical thinking, whether in stand-alone courses or infused into disciplinary courses (or both). There is a particular need to compare the effectiveness of different forms of instruction in critical thinking. With the widespread diffusion ofthe personal computer, and financial pressures on institutions of higher education, instructors are relying more and more on drill-and-practice software, some of which have built-in tutorial helps. This software can reduce the labour required to instruct the students; at the same time, it provides immediate feedback and necessary correction in the context of quality practice, which some writers (e.g., van Gelder 2000,2001) identify as the key to getting substantial improvement in critical thinking skills. Does the use of such software result in greater skill development, less, or about the same? Can such software completely replace the traditional labour-intensive format of working through examples in small groups and getting feedback from an expert group discussion leader? Or is it better to combine the two approaches? Can machine-scored multiple-choice testing completely or partially replace human grading of written answers to open-ended questions? Answers to such questions can help instructors and academic administrators make wise decisions about formats and resources for undergraduate critical thinking instruction. We do not have those answers now.
The Effectiveness of Computer-Assisted Instruction in Critical Thinking 185
meaningful; with large groups, even slight differences will be statistically significant, but they will not reflect much difference in educational outcome. Judgement is required to determine how much of a difference is educationally meaningful or important. A useful rule of thumb is that a medium effect size is a difference of 0.5 of a standard deviation in the population (Cohen 1998: 24-27); Norman et al. (2003) report that minimally detectable differences in health studies using a variety of measurement instruments average half a standard deviation (mean = 0.495SD, standard deviation = 0.155), a figure which can be explained by the fact, established in psychological research, that over a wide range of tasks the limit of people's ability to discriminate is about I part in 7, which is very close to half a SO.
Practical constraints make such ideal designs impossible. Students register in the courses they choose, and cannot reasonably be forced by random allocation either to take a critical thinking course or to take some placebo. The only practically obtainable control group is a group of students who have a roughly similar educational experience except for the absence of critical thinking instruction; practically speaking, one cannot put together a group taking exactly the same courses other than the critical thinking course. Further, there are disputes about the validity of even standardized tests of critical thinking skills. And, although there is one standardized test of critical thinking dispositions (the California Critical Thinking Disposition Inventory), questions can be raised about how accurately students would answer questions asking them to report their attitudes; self-deception, lack of awareness of one's actual tendencies and a desire to make oneself look good can all produce inaccurate answers.
A standard design therefore administers to a group of students receiving critical thinking instruction a pre-test and a post-test using a validated instrument for testing critical thinking skills. Examples of such designs are studies by Facione (1990a), Hatcher (1999), van Gelder (2000,200 I) and Twardy (2004). All four of these studies used the California Critical Thinking Skills Test (CCTST) developed by Facione (Facione et al. 1998), thus facilitating comparison. Facione's study included a control group of 90 students in an Introduction to Philosophy course, whose mean gain in CCTST score can thus be used as a basis of comparison. Since no study of the effect of critical thinking instruction has used a randomized experimental design, with subjects randomly allocated to an intervention group and a control group otherwise treated equally, there is no true control group. The gains reported for different course designs offer a relative comparison, rather than an absolute measure of effect size. Any such reported gains should be reduced by the best available estimate of the gains that the students would have made if they had taken some other course instead, gains due to such factors as full-time university study, maturation and familiarity with the test. I
186 David Hitchcock
built-in tutorial helps, and whose grade depended entirely on multiple-choice testing. Such a course design is remarkably efficient, but how effective is it? That is what this study tried to determine, at least for critical thinking skills.
2.
Method402 undergraduate students at McMaster University in Hamilton, Canada completed a 13 week course in critical thinking between January and early April of 2001, meeting in one group for two 50-minute classes a week. At the first meeting the course outline was reviewed and a pre-test announced, to be administered in the second class; students were told not to do any preparation for this test. Those students who attended the second class wrote as a pre-test either Form A or Form B ofthe California Critical Thinking Skills Test (CCTST). The following 11 weeks were devoted to lectures about critical thinking, except that two classes were used for in-class term tests and one class was cancelled. Thus the students had the opportunity to attend 19 lectures of 50 minutes each, i.e., to receive a total of 15.8 hours of critical thinking instruction. In the 13th week, those students who attended the second-last class of the course wrote as a post-test either Form A or Form B of the CCTST. The last class was devoted to a review of the course and an explanation of the format of the final examination.
There were no tutorials. Two graduate teaching assistants and the instructor were available for consultation bye-mail (monitored daily) or during office hours, but these opportunities were used very little, except just before term tests; the course could have been (and subsequently was) run just as effectively with one assistant. Review sessions before the mid-term and final examination were attended by about 10% of the students. Two assignments, the mid-term test and the final examination were all in machine-scored multiple-choice format; in other words, there was no written graded work.
Students used as their textbook Jill LeBlanc's Critical Thinking (Norton 1998),
The Effectiveness of Computer-Assisted Instruction in Critical Thinking 187
The software includes pre-structured diagrams into which students can drag component sentences of an argumentative text to note its structure, but does not allow the construction of original diagrams; in this respect it is less sophisticated than Athenasoft (available at www.athenasoft.org), Araucaria (available at http:// www.computing.dundee.ac.uk/staff/creed/araucaria/download.html), and Reason!Able (available at http://www.goreason.com/download.htm).There was a Website for the course, on which answers to the textbook exercises were posted, as well as past multiple-choice assignments, tests and exams with answers, along with other helps. There was no monitoring of the extent to which a given student used the software or the Web site.
To encourage students to do their best on both the pre-test and the post-test, 5% of the final grade was given for the better of the two marks received; if one of the two tests was not written the score on the other test was used, and if neither test was written the final exam counted for an additional 5%. In accordance with the test manual, students were not told anything in advance about the test, except that it was a multiple-choice test. A few students who asked what they should do to study for the post-test were told simply to review the material for the entire course. Students had about 55 minutes on each administration to answer the items, slightly more than the 45 minutes recommended in the manual.
The original intention was to use a simple crossover design, with half the students writing Form A as the pre-test and Form B as the post-test, and the other half writing Form B as the pre-test and Form A as the post-test. This design automatically corrects for any differences in difficulty between the two forms. As it turned out, far more students wrote Form A as the pre-test than wrote Form B, and there were not enough copies of Form B to administer it as a post-test to those who wrote Form A as the pre-test. Hence the Form A pre-test group was divided into two for the post-test, with roughly half of them writing Form B and the rest writing Form A again. This design made it possible to determine whether it makes any difference to administer the same form of the test as pre-test and post-test, as opposed to administering a different form.
3. Results
3.1 Mean gain overall
Of the 402 students who completed the course, 278 wrote both the pre-test and the post-test. Their mean score on the pre-test was 17.033 out of 34, with a
188 David Hitchcock
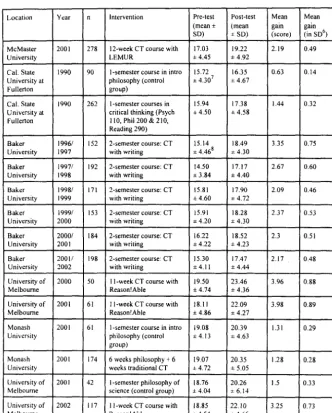
than the difference of .63 points out of 34, or .14 standard deviations, reported for a control group of 90 students taking an introductory philosophy course (Facione 1990a: 18). Results for the 278 McMaster students, for the control group, and for groups taking critical thinking courses elsewhere are recorded in Table 1.
Location Year n Intervention Pre-test Post-test Mean Mean (mean ± (mean gain gain SO) ± SO) (score) (in S06)
McMaster 2001 278 12-week CT course with 17.03 19.22 2.19 0.49
University LEMUR ± 4.45 ± 4.92
Cal. State 1990 90 I-semester course in intro 15.72 16.35 0.63 0.14 University at philosophy (control ± 4.307 ± 4.67
Fullerton group)
Cal. State 1990 262 I-semester courses in 15.94 17.38 1.44 0.32 University at critical thinking (Psych ± 4.50 ± 4.58
Fullerton 110, Phil 200 & 210, Reading 290)
Baker 19961 152 2-semester course: CT 15.14 18.49 3.35 0.75 University 1997 with writing ± 4.468 ~ 4.30
Baker 19971 192 2-semester course: CT 14.50 17.17 2.67 0.60
University 1998 with writing ± 3.84 ± 4.40
Baker 19981 171 2-semester course: CT 15.81 17.90 2.09 0.46 University 1999 with writing ± 4.60 I 4.72
Baker 19991 153 2-semester course: CT 15.91 18.28 2.37 0.53
University 2000 with writing ± 4.20 ± 4.30
Baker 20001 184 2-semester course: CT 16.22 18.52 2.3 0.51
University 2001 with writing ±4.22 ± 4.23
Baker 200J/ 198 2-semester course: CT 15.30 17.47 2.17 0.48
University 2002 with writing ± 4.11 ± 4.44
University of 2000 50 II-week CT course with 19.50 23.46 3.96 0.88
Melbourne Reason!Able ± 4.74 ± 4.36
University of 2001 61 II-week CT course with 18.11 22.09 3.98 0.89
Melbourne Reason!Able ± 4.86 ± 4.27
Monash 2001 61 I-semester course in intro 19.08 20.39 1.31 0.29
University philosophy (control ± 4.13 ± 4.63
group)
Monash 2001 174 6 weeks philosophy + 6 19.07 20.35 1.28 0.28 University weeks traditional CT ± 4.72 ± 5.05
University of 2001 42 I-semester philosophy of 18.76 20.26 1.5 0.33 Melbourne science (control group) ± 4.04 ± 6.14
University of 2002 117 II-week CT course with 18.85 22.10 3.25 0.73
Melbourne Reason!Able ± 4.54 ± 4.66
Table 1: CCTST scores at pre-test and post-test
,...-The Effectiveness of Computer-Assisted Instruction in Critical Thinking 189
2002), and intermediate between those in several one-semester courses in critical thinking at California State Fullerton (Facione 1990a) and those in a one-semester course at the University of Melbourne which combined computer-assisted instruction with written graded assignments and tests (Donohue et al. 2002). I The gains at Baker University (Hatcher 1999, 2001: 180, e-mail communication) are not strictly comparable, because they were measured over two semesters, during which one would expect full-time university students to show more improvement than the control group, independently of taking a critical thinking course. All groups studied were first-year students, except for the group in the present study (who were in their second, third and fourth years) and the group in the critical thinking courses at California State University at Fullerton (who were in first, second, third and fourth years). Since other studies (reported in Pascarella and Terenzini 2005) have found much greater gains in critical thinking skills in the first year than in subsequent years, independently of taking a course in critical thinking, the net effect of the course is correspondingly greater for the Fullerton and McMaster critical thinking students than for the other critical thinking groups. For details of the educational interventions, consult the sources mentioned.
3.2 Mean gain by form type
The 278 students fell into four groups, according to which form of the test they wrote on the pre-test and post-test. I designate these groups "AB", "AA","BA"and "BB", with the first letter indicating the form written as a pre-test and the second the form written as a post-test. The mean score of the 90 students in group AB increased from 17.34 out of 34, with a standard deviation of 4.59, to 19.22, with a standard deviation of 4. 75; the AB group's average gain was thus 1.88 points out of34, or .42 of the estimated standard deviation in the population. The mean score of the 79 students in group AA increased from 16.45 out of 34, with a standard deviation of 4.30, to 18.56, with a standard deviation of 4.94; the AA group's average gain was thus 2.11 points out of 34, or .47 of the estimated standard deviation in the population. The mean score of the 108 students in group BA increased from 17.20 out of34, with a standard deviation of 4.45, to 19.73, with a standard deviation of 5.04; the BA group's average gain was thus 2.53, or .56 of the estimated standard deviation in the population. There was only one student in group BB; his score was 17 out of 34 on both the pre-test and the post-test. The results are consistent with form B being slightly more difficult than form A, since there was more improvement in going from form B to form A than vice versa, and an intermediate degree of improvement in those writing form A twice.6 But the
190 David Hitchcock
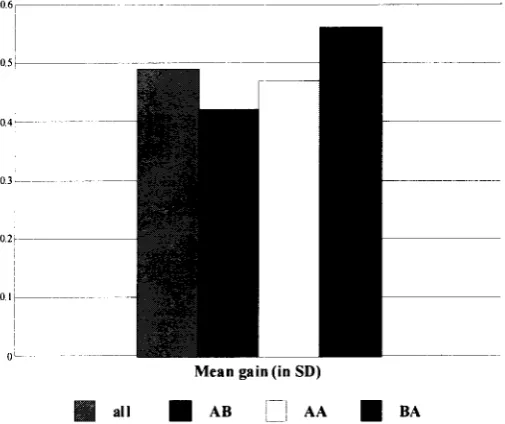
not do better on the test simply because they have taken it before." (Facione et al. 1998: 14) Table 2 shows the results for the 278 students as a whole and for each sub-group by form type. Figure 1 displays the mean gain, expressed as a percentage of the estimated standard deviation in the population, for the whole group and for each of the three sub-groups by form type.
As explained in note 5, allocation of students at pre-test was not random. As it turned out, the group writing form B at pre-test did better on average than the group writing Form A. Even though Form B is more difficult than Form A (as indicated in the previous paragraph, cf. Jacobs 1995, 1999), the mean score at pre-test on Form B (17.38 ± 4.54) was slightly higher than that on Form A (16.96 ± 4.47) , as indicated in Table 2. The difference was not statistically significant.8
Group n Pre-test (mean Post-test (mean Mean gain Mean !fain
± SO) ± SO) (score) (in SO 3)
entire pre- 278 17.03 19.22 2.19 0.49
post ± 4.45 ±4.92
AS 90 17.34 19.22 1.88 0.42
± 4.59 ±4.75
AA 79 16.45 18.56 2.11 0.47
± 4.30 ±4.94
SA 108 17.20 19.73 2.53 0.56
± 4.45 ± 5.04
SS 1 17 17 0 0
all preA 240 16.96 n.a n.a. n.a.
± 4.47
all preS 134 17.38 n.a n.a n.a
± 4.54
Table 2: CCTST scores at McMaster by form type
The Effectiveness of Computer-Assisted Instruction in Critical Thinking 191
Further, among those who wrote the post-test, the BA group appears to have improved slightly more than the AB and AA groups, if one corrects for the extra difficulty of form B. Allowing for the extra difficulty of form B, this group started off with slightly hetter critical thinking skills (as measured by the CCTST) than each of the other two groups, and it improved slightly more than they did.
0.6,
-I 0.5,'
-
0.4---
0.30 . 2 ,
-0.1 f
-I !
• all
Mean gain (in SD)
• AD AA • DA
Figure 1: Mean Gain (in SD) by group
The AB students (second column) who wrote form A on the pre-test an~ form B on the post-test had a slightly smaller mean gain than the AA students (third column) who wrote form A twice, and they in tum had a slightly smaller mean gain than the BA students who wrote form B on the pre-test and form A on the post-test. The differences were not statistically significant: F(2,274) = 0.78 (p=.45).
192 David Hitchcock
3.3 Mean gain by Faculty of registration
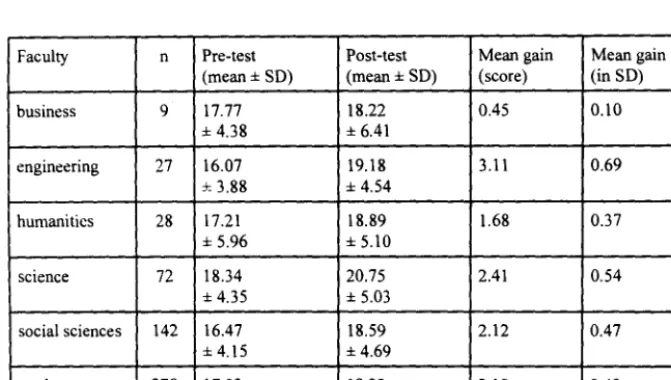
Students registered in the course came from programs in five different Faculties of the university: business, engineering, humanities, science, social sciences.lo Among the 278 students who wrote both the pre-test and the post-test, there were slight but statistically significant differences (p=.02) in the mean pre-test score by Faculty, which ranged from a low of 16.07 for the engineering students to a high of 18.34 for the science students. I I But each of the five groups showed an improvement in the post-test, and the differences in mean gain were not statistically significant (p=.34), partly because there were very few students from some Faculties.12
For details, see Table 3.
Faculty n Pre-test Post-test Mean gain Mean gain (mean± SO) (mean ± SO) (score) (in SO)
business 9 17.77 18.22 0.45 0.10
± 4.38 ± 6.41
engineering 27 16.07 19.18 3.11 0.69
:l: 3.88 ± 4.54
humanities 28 17.21 18.89 1.68 0.37
± 5.96 ± 5.10
science 72 18.34 20.75 2.41 0.54
± 4.35 ± 5.03
social sciences 142 16.47 18.59 2.12 0.47
±4.15 ±4.69
total 278 17.03 19.22 2.19 0.49
± 4.45 ±4.92
Table 3: CCTST scores at McMaster by students' Faculty
There were statistically significant differences by Faculty in the students' pre-test scores; F(4,273) = 2.79 (p=.02). But the differences in mean gains by Faculty were not statistically significant; the interaction of student's Faculty by time yields an F value of F(4,273) = 1.13 (p=.34). The numbers enrolled in business, engineering and humanities are too small to make generalizations meaningful for those Faculties.
-The Effectiveness of Computer-Assisted Instruction in Critical Thinking 193
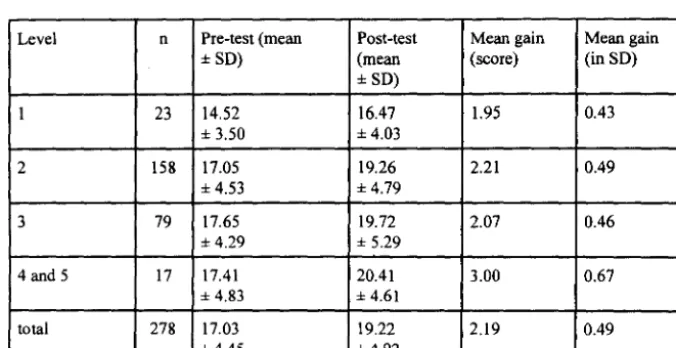
3.4 Mean gain by level of registration
194 David Hitchcock
Level n Pre-test (mean Post-test Mean gain Mean gain
± SD) (mean (score) (in SD)
±SD)
I 23 14.52 16.47 1.95 0.43
± 3.50 ±4.03
2 158 17.05 19.26 2.21 0.49
± 4.53 ± 4.79
3 79 17.65 19.72 2.07 0.46
± 4.29 ± 5.29
4 and 5 17 17.41 20.41 3.00 0.67
± 4.83 ±4.61
total 278 17.03 19.22 2.19 0.49
± 4.45 ± 4.92
Table 4: CCTST scores at McMaster by students' Level
The lower mean pre-test score of the Level 1 students reflects the fact that they were academically weak students: almost all of them (14 of 17) had completed at least a year of university studies but had not earned enough credits to advance to Level 2. In the other academic levels, mean pre-test scores tended to increase slightly as the Level increased. This pattern is consistent with findings in other studies that critical thinking skills improve slightly after the first year of undergraduate education as students take more university courses, even if they do not take a stand-alone critical thinking course. The differences in pre-test score by Level were statistically significant [F(3,273) = 3.57 (p=.Ol)], but were not statistically significant once the Levell students were excluded [F(2,252) = 0.60 (p=.54)]. The differences in mean gain by Level were not statistically significant; F(3,273) = 0.33 (p=.80). The greater mean gain by the Level 4 and 5 students may be a matter of chance, given the small number of such students. (Enrolments by students' Level add up to 277 rather than 278, because one student taking the course for credit at another university was not classified by Level.)
3. 5 Mean gain by type of item
The Effectiveness of Computer-Assisted Instruction in Critical Thinking 195
which it is based (American Philosophjcal Association 1990). An example of non-overlap is a set of items on the CCTST which require evaluation of inferences in categorical syllogisms; the course taken by students in the present study skipped the textbook's chapter on categorical syllogisms. In order to determine which
196 David Hitchcock
Type of item n Pre-test (mean Post-test (mean Mean gain Mean gain (% of
± SO) ± SO) (score) perfect score)
Definitely taught 25 11.93 13.54 1.61 6.44%
± 3.63 ± 3.92
Possibly taught 7 3.53 4.00 0.47 6.71%
± 1.26 ± 1.47
Definitely not 2 1.56 1.68 0.12 6.00%
taught ± 0.55 ± 0.50
All 34 17.Q3 19.23 2.20 6.47%
± 4.45 ±4.93
Table 5: CCTST scores at McMaster by type of item
Mean gains by item type, expressed as a percentage of the total possible score on items of the given type, did not differ according to whether the item tested a skill judged to be definitely taught in the course, possibly taught in the course, or definitely not taught in the course. All data are for 277 students who wrote both the test and the post-test, excluding the student who wrote form B at both pre-test and post-pre-test.
4. Discussion
In one semester, the 278 students in this study improved their score on the California Critical Thinking Skills Test (Forms A and B) by an average of 2.19 points out of 34, a gain of 6.44 percentage points from 17.03 (50.08%) to 19.22 (56.52%). The mean gain was substantially greater than the gain by a control group of90 students who took an introductory philosophy course at a California state university in early 1990; in one semester, that group of 90 students improved their score on the CCTST by an average of only 0.63 points out of 34, a gain of only 1.85 percentage points from 15.72 (46.23%) to 16.35 (48.08%). The difference of 1.56 points out of 34 (4.59 percentage points) is undoubtedly statistically significant (though no direct calculation of its level of significance was made), and is educationally meaningful. But it is not very impressive, especially when measured against the room for improvement which the McMaster students manifested on the pre-test.
It is considerably less than gains ranging from 3.25 to 3.98 points out of 34 (9.55 to 11.70 percentage points) reported for three groups of students at the University of Melbourne after a one-semester course in critical thinking which combined computer-assisted instruction with graded written assignments and tests. On the other hand, the gain by the McMaster students is somewhat more than the mean gain of 1.44 points out of 34 (4.23 percentage points) reported for a group of 262 students at a California state university after a one-semester course in critical
I
I
I
l
The Effectiveness of Computer-Assisted Instruction in Critical Thinking 197
thinking which did not use computer-assisted instruction.17 For details and further comparisons with other studies, see Table 1.
To facilitate comparison with results of studies using other tests with different scoring systems, a standard measure of effect size is Cohen's d, i.e., the mean gain divided by the standard deviation. From this figure must be subtracted the mean gain in pre-test standard deviations which would have been expected without the critical thinking course. To arrive at this expected mean gain, we need to look at a synthesis of recent studies.
198 David Hitchcock
the seniors were .05 of a standard deviation behind the juniors and only .08 of a standard deviation above the sophomores (Table 4). As mentioned previously, the small number of Level I students in the present study (23) were mostly not freshmen, but sophomores who had not managed to complete their Level 1 program in their first year of study; hence their scores cannot be taken as any indication of scores on the CCTST that one would expect from McMaster freshmen. Further, the expected gain in critical thinking skills for such students after one semester offull-time undergraduate study without a critical thinking course should be about .05 of a standard deviation, since they are mostly not freshmen.
Subtracting this very rough estimate of .05 of a standard deviation from the gains shown by the students in the present study indicates that the course raised the critical thinking skills ofthe Levell students by about .38 of a standard deviation, of the Level 2 students by about.44 ofa standard deviation, of the Level 3 students by about .41 of a standard deviation, and of the Level 4 students by about .62 of a standard deviation. In terms of effect sizes reported generally in education and the social sciences, the effect at each of the four levels of registration is between small and medium-sized (Cohen 1988: 24-27). In terms of what one can reasonably expect from a one-semester course in critical thinking instruction, it seems intermediate; students in the one-semester stand-alone critical thinking courses tested by Facione (1990a) showed a gain of only .33 of a standard deviation, indicating that the critical thinking instruction caused a gain of about .16 of a standard deviation among the freshmen and about .28 of a standard deviation among the non-freshmen,18 a small effect. On the other hand, Donohue et al. (2002) report mean gains ranging from. 73 to .89 of a standard deviation among groups of freshmen in a one-semester course, for a net effect size ranging from .56 to .72 of a standard deviation, which is medium-sized to moderately large. In the present study, the mean gain for the sophomores, juniors and seniors was in each case greater than they would be expected to show for the rest of their academic career without a course in critical thinking instruction. Since this course was offered in the second semester, the sophomores would be expected without a critical thinking course to gain .25 of c: standard deviation in the rest of their university career (vs . .49 actually gained after this one-semester course), the juniors .15 (vs . .46 actually gained) and the seniors .05 (vs .. 67 actually gained). If these gains are retained until the end of their university education, these students will graduate with better critical thinking skills than they would have had without such a stand-alone critical thinking course. Paradoxically enough, the greatest benefit from taking this course seems to have accrued to the students in Levels 4 and 5 who were in the last semester of their undergraduate education; their numbers, however, are too small to permit meaningful generalizations.
r
The Effectiveness of Computer-Assisted Instruction in Critical Thinking 199
instruction will improve them a little. A one-semester critical thinking course relying solely on computer-assisted instruction and machine-scored multiple-choice tests will improve them a little bit more. But a one-semester critical thinking course which combines computer-assisted instruction with graded written assignments and tests will improve them the most. 19 In no case, however, will the improvement
be very great; the maximum improvement that can be expected after a one-semester course is an average increase of a little less than one standard deviation of the student's performance on a pre-test.
The results point to these generalizations, but of course they do not prove them. Many other explanations of the results are possible, and will be considered below. In order to test the proposed generalizations, many more studies of a similar kind need to be done, with a standard form of reporting that facilitates comparisons and makes it possible for instructors to adopt course designs that prove to be especially effective and efficient.
The following alternative explanations of the differences reported in these studies occur to me. (1) Scores on the CCTST might be a poor measure of the critical thinking skills that critical thinking courses are designed to improve. (2) Groups may differ with respect to the incentives they had to perform well on the pre-test, or with respect to the incentives they had to perform well on the post-test. (3) Groups may differ with respect to the amount of work done in the course at the time they took the post-test. (4) Groups may differ in composition in ways that affect the degree to which they can improve their critical thinking skills in a single semester. (5) The formats and manner of instruction ofthe critical thinking courses may differ in other causally relevant respects than whether they had computer-assisted instruction and whether they had written graded assignments and tests. (6) The greater improvement in courses using computer-assisted instruction might have been due to improvements in general ability to answer multiple-choice items, because ofthe extensive practice in answering such items which those in traditional courses did not get.
These alternative explanations are of course not mutually exclusive. The differences in mean gains in the different studies may be due to a combination of such factors, or to a combination of them with the differences in course format. Before considering each alternative possible explanation in detail, however, we should note that at least one explanation can be ruled out: the differences are not due to whether students wrote the same form of the CCTST on the post-test as on the pre-test; the present study has shown that it makes no difference to one's gain on this test whether one writes the same form or a different form.
Let us now consider the six alternative possible explanations in detail.
200 David Hitchcock
1990). The statement, endorsed by a panel of 46 persons active in critical thinking education, research and assessment (including the present author) after a two-year-long, multi-stage Delphi process, grouped critical thinking skills20 into six
groups, as follows:
- interpretation: categorization, decoding significance, clarifying meaning; - analysis: examining ideas, detecting arguments, analyzing arguments
into their component elements;
- evaluation: assessing claims, assessing arguments;
- inference: querying evidence, conjecturing alternatives, drawing conclusions;
- explanation: stating results, justifying procedures, presenting arguments - self-regulation: self-examination, self-correction.
i
l
The Effectiveness of Computer-Assisted Instruction in Critical Thinking 201 explanation group (25-34), nine items (26-34) test in various ways the skill of identifying the fallacy in a piece of reasoning and the remaining one (25) tests the skill of figuring out how to disconfirm a hypothesis; while this latter item can be construed as testing the skill of justifying procedures, it is hard to see how the others test any of the component skills of explanation identified by the Delphi panel: stating results, justifying procedures, presenting arguments. The omission ofitems specifically testing the sixth group of self-regulation skills (self-examination and self-correction) is not a flaw, because these skills are required for answering all the items; self-regulation is definitive of critical thinking generallyY
It is possible, of course, that the skills not tested by any items in the CCTST correlate so well with the other skills that are tested that a person's score on the CCTST is a good measure of all their critical thinking skills. But such correlations would have to be demonstrated. It is also possible that the Delphi panel's list of skills requires additions, subtractions or modifications of items in the light of its general conception of critical thinking or some refinement of that conception. One would get a somewhat different test, for example, if one worked from the list of skills developed over several decades of research by Robert Ennis (Ennis 1985, 1991) or from the proposal of Alec Fisher and Michael Scriven to define critical thinking as the "skilled, active interpretation and evaluation of observations, communications, information and argumentation" (Fisher and Scriven 1997: 20). There are also legitimate questions about the soundness of six of the 34 items (18%) on Forms A and B of the CCTST. In addition, four of the 34 items (12%) relate to an emotionally charged passage which may break the needed concentration of some test-takers.23
The technical report on the content validity and experimental validation of Form A of the CCTST (Facione 1990a) points out the grounding of the test in the theoretical construct developed under the auspices of the American Philosophical Association (1990), and notes that this theoretical construct is compatible with the conceptualization of critical thinking promulgated by the California State University system. It also reports statistically significant gains in test scores for various groups of students after a one-semester critical thinking course, and no significant gains after a semester for various groups of students not enrolled in a critical thinking course. This method of experimental validation assumes that a semester of university education which includes a critical thinking course does more to improve critical thinking skills than a semester of university education that does not. Thus there is some circularity in using improvement on the CCTST to measure the effectiveness ofa course in critical thinking in improving critical thinking skills.
A second report on Form A of the CCTST (Facione 1990b) found moderately strong correlations between CCTST scores and Scholastic Aptitude Test (SAT) verbal scores (.55 to .62) and SAT math scores (.44 to .48), and weak correlations with college grade-point average (GPA) (.20 to .29) and the number of semesters of high school preparatory English (.13 to .19). These correlations, which were
202 David Hitchcock
statistically significant in groups ranging in size from 184 to 473 students, provide some indication that CCTST scores measure cognitive skills of some kind. But the overall evidence for the validity of the CCTST is not strong.
(2) Differential incentives? Students in the present study had an equal incentive
to do well on the pre-test and the post-test, since the better of the two marks counted for 5% of their final grade in the course. Since the pre-test mark would count even if the student did not write the post-test, however, there was little reason for those students who believed that they would do no better or who were happy enough with their pre-test mark to write the post-test.2
Such students would fall into four groups: a small number who did very well on the pre-test and could not do much better, a larger number with consistently low marks throughout, a perhaps moderate-sized group who did well enough on the pre-test in terms of the grade they were looking for in the course, and a small remainder who thought that a small improvement in their final mark was not worth the time it would take to write the post-test. The failure of such students to write the post-test might introduce a bias, although it is impossible to estimate its direction. The fact that the pre-test mean score of students who also wrote the post-test was almost exactly the same as that of students who did not (17.03 compared to 17.35) suggests that any bias that occurred because not all registered students wrote the post-test is slight.
Facione (1 990a) administered the CCTST to students who had no incentive to do well on either the pre-test or the post-test; in neither case did their score on the test count towards their grade in the course in which it was administered. Facione personally administered a November post-test and a February pre-test to more than 80% of the sections in this large study of 1,169 college students. He reports that the pre-test students seemed more cooperative and appeared to put forth a stronger effort, whereas the post-test students, "pressed at the end of the semester with a variety of deadlines and knowing that the CCTST would not influence their final course grade, although willing to participate, seemed to do hastier work and put forth less effort..." (Facione 1990a: 13). Although he does not say so, one presumes that students writing the May post-test displayed similar behaviour. These observations suggest that the post-test scores in Facione's study are low and that his students improved more than his numbers show in the skills measured by the CCTST.
The students studied by Hatcher (1999, 2001) had no incentive to do well on the pre-test, except for being urged to do their best for the sake of the validity of the study; the pre-test mark did not count towards the grade in their course. The posHest, on the other hand, counted for 10% of the final examination grade, which in turn counted for 25% of the grade for the course; thus the post-test mark counted for 2.5% of the total grade in the course. The difference in incentives might mean that the pre-test scores in Hatcher's on-going study are an under-estimate, but any such bias is likely to be small, given the tendency of students, noted by Facione, to make a good effort at the beginning ofterm; in fact, Hatcher's
The Effectiveness of Computer-Assisted Instruction in Critical Thinking 203
subjects were entering freshmen at the very beginning of their first year of university study. Further, the incentive of Hatcher's subjects to do well on the post-test was somewhat mitigated by the fact that the mark out of 34 on the CCTST was treated
as
a mark out of 20, with any score of 20 or more getting 100% for this part of the final exam; thus there was no grade incentive to do better than 20 (e-mail communication, 3 September 2002).Van Gelder's studies (Donohue et al. 2002) used the same incentives as the present study; students got 5% of their final grade for the better of the two marks on the pre-test and the post-test. Thus his results are comparable in this respect to those of the present study.
(3) Different timing of the post-test? It might make a difference to the mean gains whether one administered the post-test in the last week of classes or after the students had studied for the final examination. The present study, like those by Facione (1990a) and van Gelder (Donohue et al. 2002), administered the post-test in the last week of classes, before students had begun studying for the final examination. So did the students in Hatcher's studies (e-mail communication, 16 April 2003). If studying for the final examination in a critical thinking course improves critical thinking skills, the post-test scores in the present study and in those by Facione, van Gelder and Hatcher underestimate the students' critical thinking skills at the end of the courses they were taking. There are, however, no data available on whether and how much critical thinking skills improve between the last week of a critical thinking course and the writing of a final examination.
204 David Hitchcock
example, Facione reports that the mean-post-test score of the 462 students who wrote the CCTST in November 1989 after a critical thinking course was 16.83 with a standard deviation of 4.67, whereas the mean post-test score of262 students who wrote the CCTST in May 1990 after a critical thinking course was 17.38 with a standard deviation of 4.58. The difference of .55 (or. I 2 of the standard deviation on the pre-test) is a substantial difference for such large groups, and indicates that the 91 non-native speakers writing the November post-test could well have been a weaker group of students than the 80 non-native speakers writing the February 1990 pre-test. Nevertheless, Facione's data give some indication that native speakers of English tend to improve their critical thinking skills (as measured by the CCTST) more than non-native speakers. If so, a group with a substantial percentage of non-native speakers would be expected to improve less than a group composed almost exclusively of native speakers of English. The 278 students in the present study included a substantial percentage of non-native speakers, although quantitative data are not available; several students asked the instructor for permission to use inter-language dictionaries on the tests and examination, several students spoke English with some difficulty and with a pronounced accent in conversation with the instructor, and several messages sent to the course e-mail account were in a type of broken English characteristic of a non-native speaker. Facione (1990b: 9) reports that 19% of both his November post-test group and his February pre-test group were non-native speakers of English, a substantial percentage that is likely to have reduced the main gain from what would otherwise be expected. Information is not publ icly available about the percentage of non-native speakers among the students studied by van Gelder (Donohue et al. 2002) and Hatcher (1999,2001).
Facione (1990b) provides some evidence that age and the number of college units previously completed are irrelevant to how much students' critical thinking skills will improve during a critical thinking course. A stepwise multiple regression analysis of factors correlated with post-test score, including the pre-test score, eliminated both age and number of college units previously completed as predictors of post-test performance, given the other factors. The present study confirms this indication for non-freshman students, in that the differences in mean gain by Level (Table 4) were not statistically significant; although the students' ages are not known, they would be strongly correlated with their Level of registration. On the other hand, Facione (1990c: 3-5) did find that sex (male or female) made a difference; although men and women did more or less equally well on his February 1990 pre-test, men did better than women on the May 1990 post-test.26 This
r
iThe Effectiveness a/Computer-Assisted Instruction in Critical Thinking 205
slightly more women students than men. Facione's subjects (1990a, 1990b, 1990c) were divided almost equally by sex in the second semester of 1989-90 (February to May 1990), but there was a substantial majority of women (55.2%, compared to 44.8% men) in his November 1990 post-test group of 449 students.
Some of Facione 's data suggest that ethnicity might make a difference to how much a person's CCTST score improves after taking a critical thinking course. Among native speakers of English, two ethnic groups ("Blacks" and "foreigners"27) made significantly greater gains (2.1 and 2.0 points respectively) than Whites, who gained on average only 1.3 points (Facione 1990c: 6-7). But the Blacks and foreigners in question were very small groups (n=13 and n=7 respectively), so they may well be untypical. Further, the gain scores are confounded by the fact that post-test scores were included by ethnicity for those who wrote the November post-test but no pre-test; hence it is not the same group of students whose mean pre-test score and mean post-test score are being compared. Further, when a mUltiple regression analysis was performed, controlling for SAT verbal score, SAT math score and college GPA, the correlation disappeared. The evidence from Facione's study thus suggests that, among native speakers of English, ethnicity makes little if any difference to a student's change in CCTST score after taking a course in critical thinking. The students in the present study were ethnically mixed, though predominantly (from their visual appearance) of European origin. Although no individual data on these students' ethnic background is available, there were substantial "visible minorities" of students of East Asian (predominantly Chinese), Southeast Asian (predominantly Vietnamese), South Asian (predominantly Indian and Pakistani) and Middle Eastern origin, with a small sprinkling of Blacks of recent African origin (e.g., from Ghana). If ethnicity makes a difference, the students in this study are sufficiently varied that any such difference is unlikely to affect the results. No information is reported on the ethnicity of students in the studies by Hatcher (1999, 2001) and van Gelder (Donohue et al. 2002).
206 David Hitchcock
"letters, languages, English, liberal studies, history, humanities" cluster (1.32 points, or .29 SO) and among the "social sciences, psychology, human services, teaching" cluster (1.11 points, or .24 SO), and relatively low intermediate gains among the "business, administration, management, government, military science" cluster (.63, or .14 SO) and the "performance studies, drama, art, music, physical education" cluster (.62, or .13 SO).
Although Facione's groupings do not exactly correspond to the Faculties in the present study, they are close enough to indicate that the rankings of his academic groupings with respect to mean gain reported are quite different than those in the present study. Engineering is at the top in both, but natural science at the bottom in his and second offive in the present study. Business is at the bottom in the present study, but second highest in Facione's study (with the largest number of students, 39% of the total). Humanities is second lowest in the present study, but its two equivalents in Facione's study are second highest and second lowest. Social sciences ranks third in both studies. The mix of rankings makes it impossible to draw any general conclusions about correlation of academic major with gains from taking a critical thinking course. Further, Facione's reported results are confounded by the fact that his post-test mean is for a different group of students than his pre-test mean.28 Further, there were statistically significant correlations between the academic majors of students in Facione's study and their SAT verbal score, SAT math score and whether they were native speakers of English, differences which could easily explain the differences in mean gain in CCTST scores by academic major. These differences, however, were not always in the direction one would expect; the academic majors with the highest mean gain (those with a major in the cluster: engineering, computer science, mathematics, statistics) also had by far the smallest percentage of native speakers of English (58%, compared to anywhere from 75% to 94% in the other clusters). While Facione's students were concentrated in the business (39%), social sciences (20%) and letters (18%) clusters, students in the present study were concentrated in the social sciences (51 %) and the natural sciences (26%). There is no information on the distribution by academic major of students in the studies by Hatcher (1999, 2001) and van Gelder (Donohue et al. , 2002).
The Effectiveness of Computer-Assisted Instruction in Critical Thinking 207
were taken into account, and differences in mean gain by ethnicity also became statistically insignificant once verbal and mathematical aptitude, college CPA and native language were taken into account (Facione 1990c: 3-8; see previous comments). Thus, not only are CCTST pre-test scores correlated with verbal and mathematical aptitude,29 but so are the gains from pre-test to post -test. This indicates that one would expect higher gains from students with higher pre-test scores, since they would tend to have better verbal and mathematical aptitude. If one looks at Table 1, it is quite striking that mean gains in one-semester courses are ranked exactly the same as the mean pre-test scores; the students in Facione's study have the lowest mean gain and also the lowest mean pre-test score, the students in van Gelder's study are highest in both respects, and the students in the present study are intermediate. Hatcher's results, although they are not strictly comparable because the students had two semesters of instruction including the writing of five argumentative essays, are all the more impressive because the students started with lower CCTST scores, and thus probably with less verbal and mathematical l\Ptitude, than students in the other studies.
Of all the differences among the groups of students in these various studies which might explain their differential gains in critical thinking skills, verbal and mathematical aptitude have the strongest claim. The raw data, however, do not permit quantitative estimations of the explanatory role of these variables through stepwise multiple regression analysis.
208 David Hitchcock
with mean gains, at least for the first 12 years of teaching, is supported qualitatively by the decline in mean gains at Baker University over the period from 1996/97 to 2001102; Table 1 shows a decline from a mean gain of 3.35 points to one of only 2.17 (.75 SO to .48 SO). Students in these studies take critical thinking instruction in sections of 20 taught by different instructors; Hatcher reports (e-mail communication) that Baker University has relied increasingly in recent years on adjunct instructors and new professors rather than on experienced professors. The instructor of students in the present study had, at the time of the study, 32 years of experience as a full-time university professor: If one can extrapolate from Facione's results, it is a miracle that the students improved at all.
Class sizes differed in these various studies, from 20 per section in Hatcher (1999, 2001), to 25 to 30 in Facione (1990a: 11), to 42 to 117 in van Gelder's study (Donohue et al. 2002), to 402 in the present study. Whatever correlation there might be between class size and mean gain in critical thinking skills, once other explanatory factors are controlled for, it is not substantial enough to have produced any clear pattern in the present group of studies. The trend, in fact, is for larger classes to show greater mean gains. The data in these studies do not support an argument that small classes are necessary for truly effective instruction in critical thinking.
(6) Differential training in answering multiple-choice questions? Since the
The Effectiveness o/Computer-Assisted Instruction in Critical Thinking 209
general ability to answer multiple-choice items, and thus unlikely that this factor accounts for any of the observed gains in CCTST scores.
Thus, four factors other than course format and content very possibly account for some or all of the apparent differences in mean gains in critical thinking skills in the various studies which used the CCTST. First, there are serious questions about the "construct validity" of the CCTST (Forms A and B) as an instrument for measuring critical thinking skills, both because it does not test for all components of the conceptualization of critical thinking from which it is derived and because six of the 34 items do not have exactly one correct answer among the options provided; these questions in tum imply caution about taking improvements in CCTST scores as a measure of how much critical thinking skills have improved. Second, students in Facione's studies (1990a, 1990b, I 990c) appeared to put more of an effort into the pre-test than into the post-test, whereas students in Hatcher's studies (Hatcher 1999, 2001) had incentives to do well on the post-test which were lacking on the pre-test; these imbalances in incentives could partly explain the relatively low mean gain by the students studied by Facione, and the relatively high mean gains by the various cohorts of students studied by Hatcher. Third, differences in pre-test mean among the groups probably indicate differences in mean verbal and mathematical aptitude, factors which are strongly correlated with extent of improvement after instruction in critical thinking; such differences could partly explain the fact that the mean gain after a one-semester critical thinking course exactly correlates with the mean pre-test score, with the lowest numbers on both measures in Facione's study (Facione 1990a), the intermediate numbers in the present study, and the highest numbers in van Gelder's studies (Donohue et al. 2002); see Table 1. Fourth, the number of years of teaching experience of the instructors in these various courses might account for some of the differences in mean gain. Of the six possible factors considered, only two seem unlikely as even a partial explanation for the observed differences in mean gain in these students: differences in timing ofthe post-test and differential training in answering multiple-choice questions.
To say that it is quite likely that the four factors collectively account for at least some of the differences in mean gains in the different groups is not to say that they actually do account for some of that difference. Further, if they do account for some of the difference, we do not know how much. To answer such questions, more research is needed. In particular, there is an urgent need to investigate further the validity of the California Critical Thinking Skills Test, for example by administering it along with some other test of critical thinking skills.31 The Ennis-Weir Critical
Thinking Essay Test (henceforth "the Ennis-Weir") might be a good candidate for such a comparison, since it closely replicates the actual practice of critical thinking: test-takers read a letter to the editor divided into paragraphs, and write a critique of the letter paragraph by paragraph, followed by a paragraph in which they summarize and justify their evaluation. For a description of the test, see Norris and Ennis
r
210 David Hitchcock
(1989: 80-84). IfCCTSTscores prove not to correlate well with Ennis-Weir scores, then researchers should either use the Ennis-Weir itself, which has strong construct validity, or develop an easily scored multiple-choice test with a good correlation with the Ennis-Weir. The disadvantage of using the Ennis-Weir is that it requires manual grading of the essay-type answers by carefully trained graders, with more than one person grading each answer so as to control for inter-grader reliability. At
10 minutes per test per grader, grading is expensive.
There is also a need, once a well-validated instrument for measuring critical thinking skills has been found, to replicate the present study with different groups of students taking critical thinking courses with different course content from different instructors using different methods. Any such replication should use a non-randomized control group that permits a co-variance analysis to control for differences at pre-test with the experimental group. In such studies it would be desirable to measure and report on the following factors: the topics covered in the course, the textbook used, the types of work used to determine the students' grade in the course (in particular the balance between essay-type questions, short-answer questions, and multiple-choice items), class size, the number of years of teaching experience ofthe instructor(s), the Level of registration of the students, the verbal and mathematical aptitude of the students, the percentage of students whose mother tongue is not English, the instrument used at pre-test and post-test, any incentives students had to do well on the pre-test or the post-test, and the stage of the course at which the post-test was given.
5. Conclusions and summary
The Effectiveness of Computer-Assisted Instruction in Critical Thinking 211
essay-type assignments. But this conclusion can only be entertained as a tentative explanatory hypothesis. More work needs to be done to check the validity of the CCTST as a measure of critical thinking skills. And an improved version of the present design needs to be replicated in other settings in order to quantify the extent to which these observed differences in improvement in different types of courses can be explained by differences in verbal and mathematical aptitude among the different groups of students, differences in years of teaching experience of the different instructors, differences in quality practice with argument mapping, and differences in study design with respect to the incentives to do well at pre-test and post-test and the stage of the course at which the post-test was administered. The required improvement over the present design is use of a non-randomized control group, with covariance analysis to control statistically for its initial differences from the experimental group.
Acknowledgements
I would like to express my thanks to Mary Lou Schmuck, who did the statistical analysis of the results reported in the present paper, and also to Geoff Norman, who acted as a consultant on the design of the study and on the statistical analysis, and who generously allowed his research assistant, Mary Lou Schmuck, to do the analysis. I also express my appreciation to Don Hatcher for lending me his copies of Form A of the CCTST and for providing extra data, to Tim van Gelder and Don Hatcher for their comments on drafts of this paper, to Geoff Cumming for answers to questions about measuring effect size and its confidence interval, to Peter Facione for generously providing extra data, and to two anonymous referees for Informal Logic. Any errors in the present paper are my responsibility.
Notes
I It would be practical, and a much better design, to use a non-randomized control group. such as
a cohort of undergraduate students who were not taking the course in critical thinking but who were generally similar in other respects. The present study has used instead a control group of90 students at a California state university taking an introductory philosophy course, whose pre-test and post-pre-test scores are reported in the technical reports on the CCTST (Facione 1990a). In the discussion section, the present paper also uses as a comparison an estimate derived from Pascarella and Terenzini (2005) of the average improvement in critical thinking skills over a semester of full-time university education by students after their first year who are not taking a critical thinking course. Such "controls" are definitely inferior methodologically to a purpose-built control group, unless raw data are available that permit a covariance analysis. With a purpose-built control group, one can compensate for the likelihood that the control group does not perfectly match the experimental group on the pre-test by using the pre-test scores in a covariance analysis to control statistically for differences that existed prior to the treatment. This approach allows for much more robust inferences of causation than the present design, and should be used in future studies if practicable. I thank one of the referees for making this point.
1 This assignment was distributed in class, and students were allowed to work on it in groups
212 David Hitchcock
distributed a week beforehand, thus freeing an additional class for instruction.
) All results are reported to two decimal places, without rounding up. Results of other researchers are reported as they stated them, except that results reported to more than two decimal places are reported to two decimal places, without rounding up.
4 The mean gain divided by the estimated standard deviation in the population is a standard
measure of effect size known as Cohen's d (Cohen 1988: 20). The population from which this sample was taken can be conceptualized as: undergraduate students in English-language universities who have not yet taken a course in critical thinking. To get an estimate of the standard deviation in this population, I have used the standard deviation reported in the test manual (Facione et al. 1998: 12) for 781 undergraduate students at California State University Fullerton who took Form A of the CCTST in 1989 or 1990. This figure has the merit of being available for any study ofthis kind. It is close to the standard deviation at pre-test of the students in the present study (4.50 among all 374 students writing the pre-test) and also to the standard deviations at pre-test reported by Hatcher (ranges from 3.84 to 4.60) and by van Gelder (ranging from 4.04 to 4.86). It
does not make sense to use a pooled standard deviation (the square root of the mean of the variances in the population at pre-test and the population at post-test), since most studies ofthi s kind report a larger standard deviation at post-test than at pre-test. The increase in the standard deviation from pre-test to post-test reflects a spreading out of the scores, presumably as a result of higher initial scorers making larger gains than lower initial scorers. Hence the population of undergraduate students who have taken a course in critical thinking probably has a different standard deviation in CCTST scores than the one from which the students in this sample were selected. The effect size should be measured in tenns of the population who received the treatment, as they were before the treatment, not as they were after it. In this case, the effect of the critical thinking instruction is the mean gain minus the gain expected if the students had taken a full load of courses for one semester which did not include a critical thinking course. For qualitative interpretation of the effect size, see section 4, "Discussion".
l The data were analyzed using a repeated measures analysis of variance (ANOVA) test. The
within-subject repeated factor of time yields an F value of F(I ,277) = 97.18 (p=.OO).
6 Jacobs (1995: 94, 1999: 214) also reports higher mean scores on form A than on form B. In two
successive years, he administered the CCTST to a large group of incoming freshmen randomly allocated to write forms A and B. In 1993, the mean score on part A was 16.01 (n=684), and on part B 15.36 (n=692); the following year on part A it was 15.64 (n=753) and on part B 15.32 (n=708). The differences in mean scores by form type of .65 the first time and .32 the second time would correspond to differences of 1.30 and .64 between a gain in a BA group and a gain in an AB group; thus, the difference in the present study of .65 between the BA groups gain and the AB groups gain confirms Jacobs results. The confirmation is weak, because the present study used a smaller sample and allocation by form type was not random. (The students who wrote form B at pre-test were the students with family names beginning with the letters A through L inclusive who had heeded the instruction in the first class to go to another room for their pre-test. The students writing form A at pre-test included all those with family names beginning with the letters M through Z, along with other students who either did not hear or did not heed the instructions. The students who wrote form A at pre-test were allocated to form A or B at post-test on the basis of their student number, with the more senior students writing form B and the more junior ones form A; in accordance with the general increase in critical thinking skills during an undergraduate education (Pascarella and Terenzini 2005), the more senior group had a higher mean score at pre-test. The student who wrote form B both times disobeyed instructions the second time.)
7 The interaction of form type by time yields an F value ofF(2,274) = 0.78 (p=.45).
ft The interaction of form type by pre-test score (among all 374 students writing the pre-test)