Myocardial microRNAs associated with reverse
remodeling in human heart failure
Carmen C. Sucharov, … , Edward M. Gilbert, Michael R.
Bristow
JCI Insight. 2017;
2(2)
:e89169.
https://doi.org/10.1172/jci.insight.89169
.
BACKGROUND. In dilated cardiomyopathies (DCMs) changes in expression of
protein-coding genes are associated with reverse remodeling, and these changes can be regulated
by microRNAs (miRs). We tested the general hypothesis that dynamic changes in
myocardial miR expression are predictive of
b
-blocker–associated reverse remodeling.
METHODS. Forty-three idiopathic DCM patients (mean left ventricular ejection fraction 0.24
± 0.09) were treated with
b
-blockers. Serial ventriculography and endomyocardial biopsies
were performed at baseline, and after 3 and 12 months of treatment. Changes in RT-PCR
(candidate miRs) or array-measured miRs were compared based on the presence (R) or
absence (NR) of a reverse-remodeling response, and a miR-mRNA-function pathway
analysis (PA) was performed.
RESULTS. At 3 months, 2 candidate miRs were selectively changed in Rs, decreases in
miR-208a-3p and miR-591. PA revealed changes in miR-mRNA interactions predictive of
decreased apoptosis and myocardial cell death. At 12 months, 5 miRs exhibited selective
changes in Rs (decreases in 208a-3p, -208b-3p, 21-5p, and 199a-5p; increase in
miR-1-3p). PA predicted decreases in apoptosis, cardiac myocyte cell death, hypertrophy, and
heart failure, with increases in contractile and overall cardiac functions.
CONCLUSIONS. In DCMs, myocardial miRs predict the time-dependent
reverse-remodeling response to […]
Clinical Medicine
Cardiology
Therapeutics
Find the latest version:
Conflict of interest: C.C. Sucharov, J.D. Port, and M.R. Bristow have stock (each less than 0.1% of total outstanding shares) in Miragen Therapeutics, and M.R. Bristow is member of the Miragen Scientific Advisory Board.
Submitted: June 22, 2016
Accepted: December 12, 2016
Published: January 26, 2017
Reference information:
JCI Insight. 2017;2(2):e89169. doi:10.1172/jci.insight.89169.
Myocardial microRNAs associated with
reverse remodeling in human heart failure
Carmen C. Sucharov,1 David P. Kao,1 J. David Port,1 Anis Karimpour-Fard,2 Robert A. Quaife,1
Wayne Minobe,1 Karin Nunley,1 Brian D. Lowes,3 Edward M. Gilbert,4 and Michael R. Bristow1 1Division of Cardiology, Department of Medicine, 2Department of Pharmacology, University of Colorado School of Medicine,
Aurora, Colorado, USA. 3Division of Cardiology, Department of Medicine, University of Nebraska Medical Center, Omaha,
Nebraska, USA. 4Division of Cardiology, Department of Medicine, University of Utah, Salt Lake City, Utah, USA.
Introduction
Idiopathic dilated cardiomyopathy (IDC), a subset of nonischemic dilated cardiomyopathy (DCM), is a common cause of heart failure (HF) with reduced ejection fraction (HFrEF) (1). IDC is characterized by pathologic remodeling consisting of a reduction in systolic function and the development of eccen-tric veneccen-tricular myocardial hypertrophy accompanied by molecular and cellular changes that include the activation of a myocyte gene network under the control of β1-adrenergic receptor (β1-AR) signal-ing (2, 3). This β1-AR gene signaling network, or β1-GSN, includes elements of the canonical fetal/ adult gene program (FGP) (4–6), a hallmark of cardiac myocyte pathologic hypertrophy defined by the downregulation of the adult genes encoding α-myosin heavy chain (MyHC, MYH6) and sarcoplasmic reticulum calcium-ATPase 2a (Serca 2a, ATP2A2), and upregulation of β-MyHC (MYH7) and the natri-uretic peptides ANP (NPPA) and BNP (NPPB) (7, 8). In addition to changes in the expression of coding RNAs, expression of microRNAs (miRs) is also altered in human IDC. We and others have previously identified miRs that are differentially regulated in IDC patients (9–11).
miRs are 20–22 nucleotide noncoding RNAs that play an important role in regulating gene expres-sion, through recognition of complementary sequences in the 3′ UTR of target genes. miRs promote repression of target genes through mRNA degradation or translation repression (10, 11). Furthermore,
BACKGROUND. In dilated cardiomyopathies (DCMs) changes in expression of protein-coding genes are associated with reverse remodeling, and these changes can be regulated by microRNAs (miRs). We tested the general hypothesis that dynamic changes in myocardial miR expression are predictive of β-blocker–associated reverse remodeling.
METHODS. Forty-three idiopathic DCM patients (mean left ventricular ejection fraction 0.24 ± 0.09) were treated with β-blockers. Serial ventriculography and endomyocardial biopsies were performed at baseline, and after 3 and 12 months of treatment. Changes in RT-PCR (candidate miRs) or array-measured miRs were compared based on the presence (R) or absence (NR) of a reverse-remodeling response, and a miR-mRNA-function pathway analysis (PA) was performed.
RESULTS. At 3 months, 2 candidate miRs were selectively changed in Rs, decreases in miR-208a-3p and miR-591. PA revealed changes in miR-mRNA interactions predictive of decreased apoptosis and myocardial cell death. At 12 months, 5 miRs exhibited selective changes in Rs (decreases in miR-208a-3p, -208b-3p, 21-5p, and 199a-5p; increase in miR-1-3p). PA predicted decreases in apoptosis, cardiac myocyte cell death, hypertrophy, and heart failure, with increases in contractile and overall cardiac functions.
CONCLUSIONS. In DCMs, myocardial miRs predict the time-dependent reverse-remodeling response to β-blocker treatment, and likely regulate the expression of remodeling-associated miRs.
TRIAL REGISTRATION. ClinicalTrials.gov NCT01798992.
C L I N I C A L M E D I C I N E
miRs can be important biomarkers of disease specificity and progression. A myocardial miR signature may distinguish IDC from ischemic cardiomyopathy, and expression of a subset of miRs is normalized in patients after left ventricular assisted device (LVAD) support (9, 12).
Chronic β1-AR activation is known to be an important component of pathologic remodeling (2, 13, 14), and β-blockers, whose common target is the myocardial β1-AR, are a highly clinically effective treat-ment of HFrEF (13), owing in part to their reverse-remodeling effects (15). We have recently described the β-blocker reverse-remodeling mRNA expression profile in a longitudinal study in IDC patients treated with 3 different regimens of AR antagonists that have in common high affinity competitive antagonism of the β1-AR (2). In that study (β-blocker Effect On Remodeling and Gene Expression Trial [BORG]) (2), changes in gene expression from right ventricular septal endomyocardial biopsies were analyzed based on improve-ment in left ventricle (LV) structure and function. Quantitative PCR and array results demonstrated that patients who responded to β-blocker therapy by reverse remodeling displayed changes in the expression of genes in the categories of contractile proteins, calcium handling, and adrenergic and metabolic signaling including the FGP. All the genes that exhibited changed expression in reverse-remodeled LVs were under β1-AR regulation, and nearly all of them fit into the FGP paradigm (2, 3).
In the current report we test the general hypothesis that changes in miR abundance predict β-blocker– associated reverse remodeling, by regulating the expression of remodeling-associated protein-encod-ing genes. In the BORG study, miR expression in the subgroup that responded to β-blocker treatment (Responders, Rs) was compared longitudinally with patients who did not respond (Non-Responders, NRs). In addition to identifying the miR expression profile that accompanies reverse remodeling, we define a sub-set of miRs that can be highly predictive of response to β-blockers. Furthermore, the mRNA array dataset was used to identify possible miR targets, and to define miR-mRNA-related pathways altered in response to inhibition of β1-AR signaling.
Results
Patient treatment and RNA samples
A detailed description of the 47 IDC patients investigated in BORG has been published (2). The current miR cohort consists of 43 of these 47 subjects who had miR measurements by either RT-PCR or array. One patient (metoprolol-treated) appears in the current analysis that was not in the previous study (2), owing to insufficient RNA for mRNA analyses. As described in Supplemental Table 1; supplemental material avail-able online with this article; doi:10.1172/jci.insight.89169DS1, RT-PCR measurement of candidate miRs was performed in 117 samples from 41 patients: baseline, n = 41; 3 months, n = 41 (32 R and 9 NR); 12 months, n = 35 (24 R and 11 NR). miR array measurement was performed in 86 samples from 31 patients including 2 patients who did not have RT-PCR measurements: baseline, n = 31; 3 months, n = 31 (24 R and 7 NR); 12 months, n = 24 (14 R and 10 NR). mRNA array measurement was performed in 115 RNA samples from 42 patients: baseline, n = 42; 3 months, n = 39 (R = 30, NR = 9); 12 months, n =34, including 2 subjects that did not have 3-month samples measured (R = 23, NR = 11). The baseline characteristics of patients included in the miR cohort is given in Supplemental Table 2. There were no differences between the patients in the miR cohort and the previously reported (2) entire cohort, including no differences in background HF therapy.
Expression of several miRs is differentially regulated in LVEF Responders
Left ventricular ejection fraction (LVEF) reverse-remodeling Rs were defined, as previously described (2), as an increase in LVEF by greater than or equal to 0.05 at 3 months or by greater than or equal to 0.08 at 12 months. Failure to achieve these increases defined NRs. To determine if response to β-blockers affected miR expression, RT-PCR and array measurements were performed in RNA extracted from endomyocardial biopsies at baseline, and at 3 and 12 months after initiation of treatment. miR expression was compared with baseline for each individual patient, and comparison between Rs and NRs was performed at 3 and 12 months.
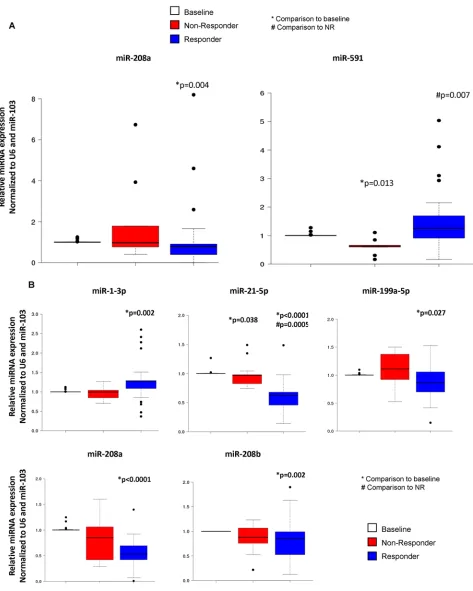
RT-PCR. For candidate miRs measured by RT-PCR (Figure 1A), at 3 months changes from baseline in
C L I N I C A L M E D I C I N E
NRs (P = 0.007), and miR-199a-5p and 208a-3p were selectively decreased compared with baseline and with NRs. Thus, miR-208a-3p was the only miR selectively changed in Rs at 3 and 12 months, and was decreased at both time points. In addition, compared with baseline miR-208b-3p was decreased in Rs at 12 months (P = 0.002) but not in NRs (P = 0.12). There were also selective changes from baseline in miRs in the NR groups at 3 months and 12 months (data not shown in Figure 1). At 3 months, miR-199-5p, -145-5p, -494-3p, -591, and -342-5p were significantly (P < 0.05) changed from baseline in NRs but not in Rs (P > 0.10), with miR-199-5p, -145-5p, -591, and -342-5p increasing and miR-494-3p and -591 decreasing. At 12 months in NRs, miR-494-3p and -378-3p were increased (P < 0.05) compared with baseline, with no change in Rs. For the reference RNAs, the abundance of neither miR-103a nor U6 was changed from baseline levels, in either Rs or NRs.
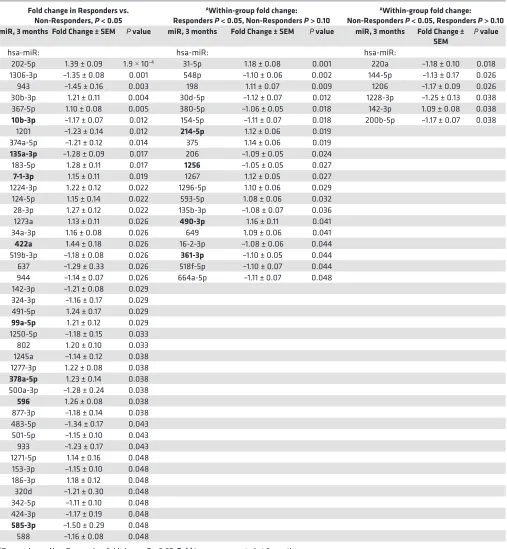
Array. Tables 1 and 2 and the heat map in Figure 2 contain array miR data, performed to generate
supportive and hypothesis-generating data on an approximate 75% subset of patients who had RT-PCR measurements. The data were analyzed the same way as for RT-PCR, except there was no correction for multiplicity of measured values. In the array data, miR-135a-3p and -585-3p are selectively decreased in Rs at both 3 and 12 months, while miR-7-1-3p, -422a, -378a-5p, and -490-3p are selectively increased at 3 and 12 months. miR-596 is selectively decreased in NRs at both time points, and miR-10b-3p, -99a-5p, -214-5p, 361-3p, and -1256 exhibit antithetical directional changes at 3 and 12 months. In terms of agree-ment between RT-PCR and array findings, there were no significant changes in the array that matched the RT-PCR changes at 3 months, but at 12 months there were similar findings between array and RT-PCR for miR-199a-5p and -1-3p. In terms of directionality of R versus NR changes, at 3 months array results were in agreement with RT-PCR for 14 of the 19 RT-PCR measured miRs, and at 12 months the agreement was 11 of 19. Six of the 19 candidate miRs measured by RT-PCR were statistically significant by array at either 3 or 12 months, and 4 of the 6 exhibited directional R versus NR agreement.
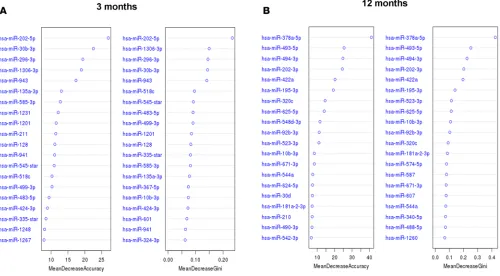
On array data, random forest (RF) analysis was performed to distinguish R from NR patients at 3 and 12 months (Figure 3, A and B, respectively). RF analysis was performed with the top 7 miRs (as determined by multidimensional scaling — Figure 4) that were statistically different (P < 0.05) between Rs and NRs. As previously described (16), miR expression in Rs was considered different than that in NRs if mean expression was ± 2 standard deviations from the mean and was statistically different from changes in NRs. Classification performances to discriminate Rs and NRs at 3 and 12 months were reported in multidimen-sional scaling of the estimated proximity matrix plots (Figure 4). In Figure 4, the rank of the top miRs is displayed, with miR-378-5p, -493-5p, -494-3p, -202-3p, and -422a constituting the top 5.
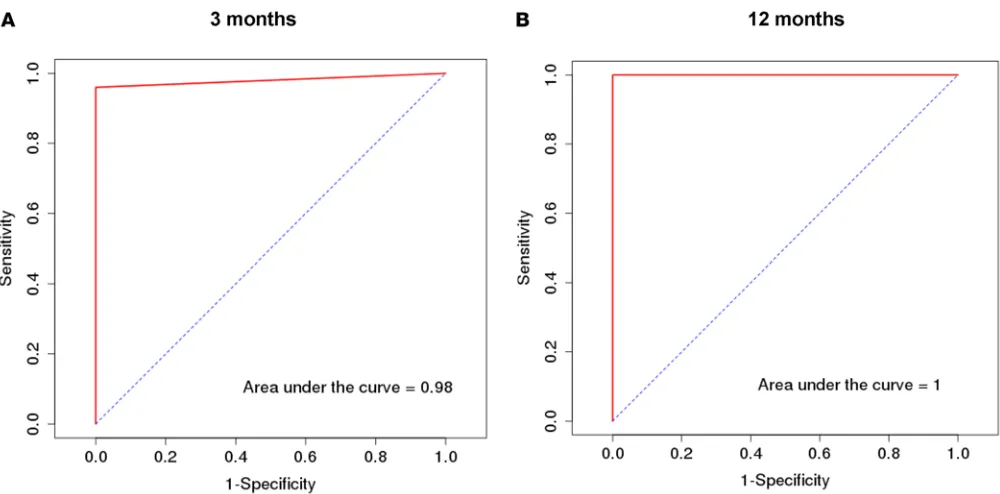
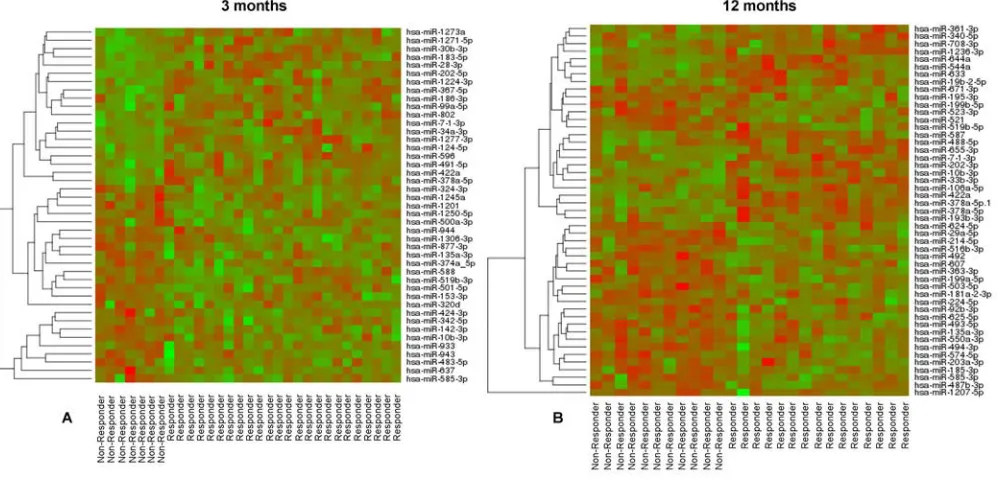
To determine the ability of these miRs to accurately separate patients according to treatment response, hierarchical clustering was performed using the top 7 miRs as determined by RF analysis. As shown in Figure 5, a high degree of clustering was observed based on response to treatment at 3 and 12 months. Next, receiver operating characteristic (ROC) curves were generated to determine if the top
Table 1. miRs differentially regulated in Responders at 3 months. Fold change is mean ± SEM change from baseline in Responders, P
value is from comparison of Responders vs. Non-Responders
Fold change in Responders vs. Non-Responders, P < 0.05
AWithin-group fold change:
Responders P < 0.05, Non-Responders P > 0.10
AWithin-group fold change:
Non-Responders P < 0.05, Responders P > 0.10
miR, 3 months Fold Change ± SEM P value miR, 3 months Fold Change ± SEM P value miR, 3 months Fold Change ±
SEM P value
hsa-miR: hsa-miR: hsa-miR:
202-5p 1.39 ± 0.09 1.9 × 10⁻⁴ 31-5p 1.18 ± 0.08 0.001 220a –1.18 ± 0.10 0.018
1306-3p –1.35 ± 0.08 0.001 548p –1.10 ± 0.06 0.002 144-5p –1.13 ± 0.17 0.026 943 –1.45 ± 0.16 0.003 198 1.11 ± 0.07 0.009 1206 –1.17 ± 0.09 0.026 30b-3p 1.21 ± 0.11 0.004 30d-5p –1.12 ± 0.07 0.012 1228-3p –1.25 ± 0.13 0.038 367-5p 1.10 ± 0.08 0.005 380-5p –1.06 ± 0.05 0.018 142-3p 1.09 ± 0.08 0.038
10b-3p –1.17 ± 0.07 0.012 154-5p –1.11 ± 0.07 0.018 200b-5p –1.17 ± 0.07 0.038
1201 –1.23 ± 0.14 0.012 214-5p 1.12 ± 0.06 0.019 374a-5p –1.21 ± 0.12 0.014 375 1.14 ± 0.06 0.019
135a-3p –1.28 ± 0.09 0.017 206 –1.09 ± 0.05 0.024
183-5p 1.28 ± 0.11 0.017 1256 –1.05 ± 0.05 0.027
7-1-3p 1.15 ± 0.11 0.019 1267 1.12 ± 0.05 0.027
1224-3p 1.22 ± 0.12 0.022 1296-5p 1.10 ± 0.06 0.029 124-5p 1.15 ± 0.14 0.022 593-5p 1.08 ± 0.06 0.032 28-3p 1.27 ± 0.12 0.022 135b-3p –1.08 ± 0.07 0.036 1273a 1.13 ± 0.11 0.026 490-3p 1.16 ± 0.11 0.041 34a-3p 1.16 ± 0.08 0.026 649 1.09 ± 0.06 0.041
422a 1.44 ± 0.18 0.026 16-2-3p –1.08 ± 0.06 0.044 519b-3p –1.18 ± 0.08 0.026 361-3p –1.10 ± 0.05 0.044 637 –1.29 ± 0.33 0.026 518f-5p –1.10 ± 0.07 0.044 944 –1.14 ± 0.07 0.026 664a-5p –1.11 ± 0.07 0.048 142-3p –1.21 ± 0.08 0.029
324-3p –1.16 ± 0.17 0.029 491-5p 1.24 ± 0.17 0.029
99a-5p 1.21 ± 0.12 0.029
1250-5p –1.18 ± 0.15 0.033 802 1.20 ± 0.10 0.033 1245a –1.14 ± 0.12 0.038 1277-3p 1.22 ± 0.08 0.038
378a-5p 1.23 ± 0.14 0.038
500a-3p –1.28 ± 0.24 0.038
596 1.26 ± 0.08 0.038 877-3p –1.18 ± 0.14 0.038 483-5p –1.34 ± 0.17 0.043 501-5p –1.15 ± 0.10 0.043 933 –1.23 ± 0.17 0.043 1271-5p 1.14 ± 0.16 0.048 153-3p –1.15 ± 0.10 0.048 186-3p 1.18 ± 0.12 0.048 320d –1.21 ± 0.30 0.048 342-5p –1.11 ± 0.10 0.048 424-3p –1.17 ± 0.19 0.048
585-3p –1.50 ± 0.29 0.048
588 –1.16 ± 0.08 0.048
C L I N I C A L M E D I C I N E
7 miRs can predict response to treatment (Figure 6). An AUC of 0.98 (3 months) and 1.0 (12 months) demonstrates a strong association between miR expression and response to β-blocker treatment.
Pathway analysis
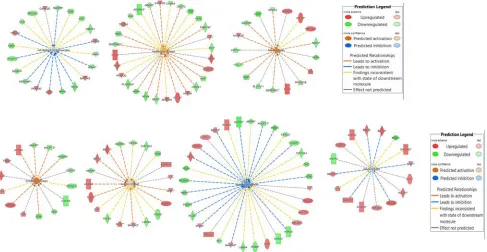
Possible associations of changes in miR expression with mRNA expression related to myocardial pathophysiology were assessed. Predicted miR target mRNAs significantly up- or downregulated in Rs compared with NRs were subjected to ingenuity pathway analysis (IPA) (Figure 7). At 3 months, changes in expression of predicted mRNA targets in Rs versus NRs indicated a pattern associated with a significant decrease in apoptosis (P = 0.004, Z score = –0.54) and cardiac myocyte cell death (P = 0.0019, Z score = –0.334). However, changes in predicted target mRNA expression also predicted an increase in myocardial hypertrophy (P = 0.005, Z score = 0.749), a decrease in contractile func-tion (P = 0.035, Z score = –1.195), and a trend towards HF (P = 0.09, Z score = 1.64) (Figure 7A). At 12 months, target mRNA expression changes in Rs versus NRs predicted an increase in cardiac contractility (P = 0.0035, Z score = 1.414) and overall cardiac function (P = 0.001, Z score = 0.376), and decreases in myocardial hypertrophy (P = 0.000004, Z score = –0.969) and HF (P = 0.03, Z score = –0.387) (Figure 7B). Furthermore, at 12 months, target mRNA expression changes associated with apoptosis and necrosis were predicted to be significantly decreased in Rs (P = 0.0015, Z score = –0.283;
P = 0.00297, Z score = –0.666; respectively).
Radionuclide ventriculography (RNV) data, miR combined cohort
RNV data revealed no differences between the 3 treatment groups in the R/NR response rate (R/NR, [R rate in %]) at 3 months: carvedilol 9/5 (60%), metoprolol 14/1 (93%), metoprolol + doxazosin 10/4 (71%); 12 months: carvedilol 8/6 (57%), metoprolol 11/4 (73%), metoprolol + doxazosin 10/4 (71%) (contingency table P = 0.56). RNV data for the combined miR cohort are given in Table 3. In Rs the median increases [interquartile range] in LVEF at 3 months and 12 months were 0.13 [0.08, 0.23] and 0.22 [0.16, 0.29], respectively (P < 0.001 for each). NRs had no significant change in LVEF at either time point. At 3 months there was no difference between Rs and NRs in end diastolic volume (EDV;
P = 0.29) or end systolic volume (ESV; P = 0.09). However, decreases compared with baseline in both
ventricular volumes were greater (P < 0.05) in Rs compared with NRs. At 12 months, both EDV and ESV were decreased in Rs compared with NRs (respective P values 0.015 and 0.010), with significant (P < 0.05) changes compared with baseline that were greater at 12 months (3- vs. 12-month respective decreases in EDV by 19% and 39%, ESV by 39% and 57%).
Table 2. miRs differentially regulated in Responders at 12 months. Fold change is mean ± SEM change from baseline in Responders,
P value is from comparison of Responders vs. Non-Responders
Fold change in Responders vs. Non-Responders, P < 0.05
AWithin-group fold change: Responders P < 0.05,
Non-Responders P > 0.10
AWithin-group fold change: Non-Responders
P < 0.05, Responders P > 0.10 miR, 12 months Fold Change ± SEM P value miR, 12 months Fold Change ±SEM P value miR, 12 months Fold Change ± SEM P value
hsa-miR: hsa-miR: hsa-miR:
378a-5p 1.66 ± 0.12 1.73 ×10⁻⁵ 150-5p 1.50 ± 0.13 0.001 495-3p 1.05 ± 0.10 0.002
29a-5p –1.35 ± 0.09 1.3 ×10⁻⁴ 139.5p 1.48 ± 0.16 0.002 548d-3p 1.09 ± 0.05 0.003
493-5p –1.34 ± 0.10 0.001 101-3p 1.16 ± 0.09 0.007 9-3p –1.08 ± 0.07 0.008
422a 1.42 ± 0.18 0.001 769-5p –1.11 ± 0.07 0.004 628.5p –1.22 ± 0.08 0.013 644a 1.20 ± 0.08 0.001 130b-3p –1.37 ± 0.16 0.009 1295a 1.11 ± 0.12 0.016 202-3p 1.16 ± 0.10 0.002 550a-3p –1.19 ± 0.07 0.011 1298-5p –1.29 ± 0.09 0.023 494-3p –1.27 ± 0.14 0.002 30d-3p 1.12 ± 0.06 0.013 222-5p –1.23 ± 0.13 0.028 503-5p –1.31 ± 0.13 0.002 199a-5p –1.37 ± 0.13 0.016 126-5p 1.16 ± 0.07 0.034
10b-3p 1.20 ± 0.08 0.008 496 1.19 ± 0.08 0.016 215-5p –1.11 ± 0.06 0.034
214-5p –1.18 ± 0.11 0.008 107 –1.14 ± 0.14 0.019 21-3p –1.18 ± 0.09 0.034
92b-3p –1.26 ± 0.12 0.008 542-3p 1.13 ± 0.06 0.019 1256 –1.07 ± 0.07 0.040 574-5p –1.25 ± 0.12 0.009 187-3p 1.17 ± 0.12 0.021 596 –1.13 ± 0.09 0.040
585-3p –1.49 ± 0.23 0.009 433-3p –1.19 ± 0.08 0.021 1255b-5p –1.15 ± 0.07 0.047
521 –1.18 ± 0.08 0.013 532-3p –1.19 ± 0.10 0.023 196a-5p 1.08 ± 0.07 0.047 587 1.16 ± 0.09 0.013 1-3p 1.38 ± 0.18 0.026 548l 1.13 ± 0.09 0.047 1207-5p –1.22 ± 0.38 0.020 509-3p –1.20 ± 0.08 0.026 648 –1.23 ± 0.10 0.047 487b-3p –1.34 ± 0.20 0.020 551b-3p 1.06 ± 0.06 0.029
607 –1.12 ± 0.12 0.020 15b-3p 1.15 ± 0.09 0.033 671-3p –1.14 ± 0.10 0.020 16-1-3p 1.12 ± 0.07 0.033 106a-5p 1.30 ± 0.16 0.024 34c-3p –1.13 ± 0.07 0.033 181a-2-3p –1.34 ± 0.13 0.024 151.5p 1.05 ± 0.08 0.037 19b-2-5p 1.19 ± 0.08 0.024 191-5p –1.16 ± 0.10 0.037 340-5p 1.23 ± 0.09 0.024 490-3p 1.20 ± 0.13 0.037 488-5p 1.11 ± 0.10 0.024 490-5p 1.09 ± 0.11 0.037 519b-5p –1.10 ± 0.08 0.024 325 –1.07 ± 0.07 0.041 185-3p –1.44 ± 0.18 0.027 let-7f-1-3p 1.11 ± 0.07 0.045 33b-3p 1.30 ± 0.14 0.027 888-3p 1.09 ± 0.07 0.045 363-3p –1.25 ± 0.11 0.027 99b-3p 1.16 ± 0.09 0.045 378a-3p 1.12 ± 0.12 0.027
708-3p 1.31 ± 0.12 0.027 193b-3p 1.24 ± 0.16 0.032 195-3p –1.20 ± 0.09 0.032 203a-3p –1.24 ± 0.14 0.032 492 –1.22 ± 0.11 0.032 523-3p –1.21 ± 0.10 0.032 544a 1.25 ± 0.12 0.036 655-3p 1.28 ± 0.11 0.036
135a-3p –1.25 ± 0.11 0.041
99a-5p –1.26 ± 0.14 0.041
516b-5p –1.13 ± 0.09 0.041 550a-5p –1.15 ± 0.12 0.041 624-5p –1.16 ± 0.08 0.041 633 1.23 ± 0.10 0.041 1236-3p 1.19 ± 0.12 0.047 199b-5p –1.26 ± 0.13 0.047 224-5p –1.11 ± 0.12 0.047
361-3p 1.12 ± 0.09 0.047
625-5p –1.14 ± 0.11 0.047
7-1-3p 1.10 ± 0.13 0.047
C L I N I C A L M E D I C I N E
Discussion
Changes in miR expression are associated with response to β-blocker treatment. Previous work from our and other
laboratories indicated that IDC and ischemic cardiomyopathy forms of HFrEF can be distinguished based on cardiac miR expression (9), and in ischemic but not in DCM, altered expression of a subset of miRs is changed towards normal values in patients after LVAD support (12). These results suggest an association between miR expression, myocardial disease type, and response to therapy. The results presented here indi-cate that changes in miR expression are highly associated with the reverse-remodeling response to β-blocker treatment in DCM and IDC patients. Hierarchical clustering and RF analysis demonstrated that a subset of miRs can segregate patients based on treatment response. Importantly, if confirmed these miRs may serve as biomarkers for predicting response to treatment at 3 or 12 months. Therefore, miRs have the potential to inform treatment for HFrEF patients.
Treatment duration affects miR expression. Although response to treatment resulted in changes in miR
expression, the changes were dependent on treatment duration. As shown in Tables 1 and 2, some miRs were regulated at both 3 and 12 months, but several were uniquely regulated at each time point. Impor-tantly, the top 7 miRs as determined by RF analysis applied to array data were uniquely regulated at 3 or 12 months. This is consistent with IPA results in which genes regulated at 3 and 12 months were predicted to differentially affect ventricular myocardial functional response. The initial response to β-blocker treat-ment as measured at 3 months may be the beginning of favorable structural myocardial effects, accom-panied by relatively small effects on ventricular function (15, 17). As treatment progresses, there is a time-dependent improvement in ventricular function (15, 17) that is likely mediated by different biologic processes including different miRs.
Myocardial remodeling and changes in gene expression. We have previously reported that reversal of
myocar-dial remodeling in response to β-blockers results in changes in the expression of genes responsible for calci-um handling, contractile proteins, energy substrate use, and β-adrenergic signaling (2). In the current study we asked if reverse remodeling was also associated with changes in expression of miRs. Because miRs are predicted to regulate the expression of over 60% of mRNAs (18), it is likely that many of the previously observed changes in mRNA expression (2) are miR regulated. Based on changes in mRNA expression that
are predicted targets of differentially regulated miRs, IPA predicted a gene expression pattern associated with a decrease in cardiac hypertrophy at 12 months in R patients, which is supported by a statistically significant and substantial decrease in EDV. However, at 3 months in Rs versus NRs, IPA predicted a pat-tern associated with an increase in hypertrophy, and RNV-measured EDV was not different. Although changes from baseline in EDV at 3 months indicated statistically significant decreases in Rs versus NRs, these changes were substantially greater at 12 months. Interestingly, by IPA cardiac contractile function was predicted to be increased in Rs at 12 months, corroborated by a large (57%) decrease (P = 0.010 vs. NRs) in ESV, an index of systolic function (19). At 3 months, IPA suggested a decrease in contractile function in Rs versus NRs and ESV was not decreased. Similarly, a decrease in HF was only predicted at 12 months, which was associated with a decrease in necrosis and apoptosis. These results suggest that reverse remodel-ing is time dependent, with 3 months of treatment affectremodel-ing cell death processes, but 12 months of treat-ment resulting in substantial improvetreat-ment in cardiac contractile function, decrease in hypertrophy, and
Figure 5.Hierarchical clustering of Responder and Non-Responder patients based on the top 7 miRs as determined by random forest analysis in Figure 3. (A) 3 months. (B) 12 months.
Table 3. miR cohort, n = 43; RNV descriptive statistics by LVEF response, median [IQR]
Parameter Non-Responders (NR) Responders (R) Test Statistic, P value R vs. NR
3 mos, n = 10 12 mos, n = 11 3 mos, n = 33 12 mos, n = 26 3 mos 12 mos
LVEF_Bsl 0.32 [0.23, 0.37] 0.30 [0.22, 0.38] 0.23 [0.19, 0.32] 0.23 [0.19, 0.32] 0.17 0.16 LVEF_follow-up 0.30 [0.20, 0.35] 0.31 [0.24, 0.36] 0.38 [0.32, 0.50] 0.47 [0.43, 0.56] 0.012 <0.001 LVEF_delta –0.005 [–0.04, 0.02] –0.03 [–0.02, 0.05] 0.13 [0.08, 0.23] 0.22 [0.16, 0.29] <0.001 <0.001 EDV_Bsl, ml 216 [179, 282] 196 [136, 291] 194 [156, 244] 194 [156, 244] 0.52 0.93 EDV_follow-up, ml 200 [140, 278] 279 [271, 296] 158 [114, 207] 119 [96, 170] 0.29 0.015 EDV_delta, ml –1.0 [–19, 20] –3.0 [–34, 83] –41 [–71, –17] –55 [–135, –25] 0.039 0.033 ESV_Bsl, ml 181 [116, 218] 162 [81, 217] 155 [110, 195] 155 [110, 197] 0.70 0.72 ESV_follow-up, ml 146 [90, 195] 189 [183, 221] 94 [54, 138] 67 [41, 99] 0.09 0.01 ESV_delta, ml –5.0 [–32, 2.5] –17 [–22, –14] –53 [–80, –35] –82 [–137, –38] 0.01 0.003
C L I N I C A L M E D I C I N E
decrease in HF. Thus, the molecular patterns of miR and mRNA changes reflect what has been observed for β-blocker reverse-remodeling effects (15, 17), and are generally consistent with the RNV data in the cur-rent study. These observations indicate that the changes in miRs and mRNAs measured in this study are related to the structural and functional reverse-remodeling effects produce by inhibition of β1-AR signaling.
Response to treatment positively affects expression of a subset of candidate miRs. Time- and
remodeling-asso-ciated changes in candidate miR expression changes were identified by RT-PCR (Figure 1). At 3 months miR-591, which has antiproliferative or suppressor activity in tumor models (20, 21), exhibited increased expression in Rs compare with NRs. miR-494-3p expression was decreased in NRs at 3 months, and increased miR-494 expression is thought to be cardioprotective through activation of the AKT pathway (22). It is possible that this decrease in miR-494-3p expression contributed to nonresponse at 3 months, but at 12 months miR-494-3p expression was increased in NRs. miR-208a-3p was substantially and selectively decreased in Rs compared with baseline at 3 and 12 months, and decreased compared with NRs at 12 months. In model systems therapeutic inhibition of miR-208a prevents cardiac remodeling and improves cardiac function (23). Furthermore, increased miR-208a levels have been associated with adverse clinical outcomes in human HF (24).
At 12 months all the statistically significant RT-PCR–measured candidate miRs that were changed from baseline in Rs and not in NRs or in Rs versus NRs are known to be involved in cardiac hypertro-phy/failure, as described below. Moreover, the directionality of change in Rs is substantiated by previ-ously published results in model systems. In addition to miR-208a-3p, miR-21-5p expression was down-regulated in Rs versus baseline values and versus NRs at 12 months. miR-21 inhibition reduces fibrosis (25, 26). miR-1-3p expression was increased in Rs versus baseline, and in NRVMs increased miR-1 levels attenuate hypertrophy-induced increases in cell size and expression of hypertrophic markers (27). In addition, miR-1 blocks β-adrenergic–mediated hypertrophy in adult mouse hearts through target-spe-cific repression of calmodulin and NFAT activity, plus repression of the hypertrophic transcription fac-tor MEF2 (27). miR-199a-5p was downregulated in Rs versus baseline and versus NRs, and decreased levels of miR-199a-5p are associated with the attenuation of pathologic cardiac myocyte hypertrophy (28), as well as in the induction of physiologic hypertrophy and maintenance of cardiac homeostasis (29). miR-208b-3p, selectively decreased in Rs compared with baseline at 12 months, is involved in the mediation of myocardial hypertrophy (30). Moreover, previous work indicated that expression of miR-21, miR-1, and miR-199a-5p is modulated by isoproterenol infusion in a rat model (31). In addition, our
previous published work demonstrated upregulation of miR-21 and miR-199a-5p, and downregulation of miR-1-3p in mice overexpressing human β1-ARs (8); these changes are, as expected, opposite to the response to β-blocker treatment shown here. Furthermore, in a mouse model of isoproterenol infusion, downregulation of miR-21 prevented cardiac dysfunction (32). These studies point to a β-AR–mediated regulation of these miRs, and are consistent with expression of these miRs in response to β-blockers.
Relationship of findings to previous work. miR-1-3p (by RT-PCR at 12 months) and miR-10b-3p (by array
at 3 and 12 months) exhibited increases in expression in Rs versus NRs, which is in agreement with our previous report of downregulation of these miRs in IDC (9). Similarly, a decrease in miR-195-3p by array at 12 months in Rs versus NRs is in agreement with upregulation of this miR in IDC (9). On array, no changes in Rs versus NRs were detected in miR-150, -92a, -133a, or -133b, despite previously reported evidence of downregulation in IDC versus nonfailing controls (9), and in the case of miR-133a, a role in modulation of β1-AR downstream signaling (33). No changes on array were observed in Rs versus NRs
for miR-100 and -125b, despite upregulation in IDC (9). Decreases in miR-342-5p and -224-5p were noted in Rs versus NRs on array at 3 and 12 months, respectively, despite no changes reported in IDC hearts versus nonfailing controls (9). Finally, of a group of miRs (miR-125a-5p, -125b-5p, -150, 199a-3p, and -214-5p) reported to effect biased β1-AR/β-arrestin-1 signaling (34), only miR-214-5p was changed in Rs
versus NRs, downregulated at 12 months on array. Carvedilol has been reported to selectively upregulate these miRs, but the relatively small sample size within the carvedilol treatment group (for arrays, 7 Rs and 3 NRs) precluded any ability to detect an R versus NR difference.
Limitations. There are limitations to the current study. miRs can target gene expression at the
transcrip-tional and translatranscrip-tional levels. By analyzing mRNA expression to identify miR targets, it is likely that some targets were missed. However, the current study presents an initial evaluation of the possible function of miRs that are involved in the reverse-remodeling response to β-blocker treatment of HFrEF. In addition, mRNAs included in the analysis are predicted targets for these miRs. Future studies are needed to confirm if these miRs affect the expression of these mRNA targets.
Although our results indicate that a subset of miRs can be predictive of response to treatment, based on their invasive nature, endomyocardial biopsies are not likely to become routine practice for predict-ing if a patient is likely to respond to therapy. However, miRs are also present in the circulation, and this
C L I N I C A L M E D I C I N E
study may guide the choice of miRs analyzed in the serum or plasma in future studies of potential bio-markers of reverse remodeling. In support of our findings, decreased expression of circulating miR-378 is highly associated with left ventricular hypertrophy in aortic stenosis patients (35); circulating miR-208a levels are acutely increased in a rat model of isoproterenol-induced cardiac injury (36); and a decrease in miR-1 expression and an increase in miR-21 expression has been observed in the serum of symptomatic HF patients (37). Directionality of expression of these miRs in these studies is antithetical to a positive response to β-blocker treatment in the myocardium, and strongly supports the use of these miRs as circulat-ing biomarkers of response in patients.
We measured miRs by both RT-PCR and array, and there was an overall poor correlation between findings using these 2 methodologies. Of the 19 RT-PCR–measured candidate miRs, only 2 (miR-199a-5p and -1-3p) were similarly changed in Rs versus NRs on RT-PCR and array. Less than ideal correla-tion between RT-PCR and array measurements of miRs has been described by others (38), and may be attributed to methodological issues or in our case array measurements being performed in only a subset of samples that had RT-PCR performed. In addition, in our study the discrepancies between RT-PCR and array involve statistical significance over time or in changes in Rs versus NRs, which adds addi-tional sources of non-agreement related to variance across multiple human samples. Overall, we view both the RT-PCR and array-specific findings as being hypothesis generating, and needing confirmation in subsequent studies.
Conclusions. In support of the study’s general hypothesis we conclude that changes in the miR
abun-dance predict β-blocker–associated reverse remodeling, by regulating the expression of remodeling-associated protein-encoding genes. We demonstrated that miR expression changes are highly remodeling-associated with the reverse-remodeling response to β-blocker treatment, and may be involved in the molecular mechanisms that effect decreases in hypertrophy, increases in cardiac function, and decreased cell death. Several studies have suggested that miRs can be therapeutically targeted in a multitude of dis-eases including myocardial hypertrophy (23, 39). Importantly, directionality of change in expression of several miRs identified in this study has been associated with a reverse in pathological hypertrophy in animal models. Although further investigations in the human heart and in model systems will be required to confirm the specific reverse-remodeling-associated miRs described in the current study, this is possibly the first demonstration that changes in myocardial miR expression are dynamically asso-ciated with a remodeling response in human HFrEF. Finally, these data suggest that miRs could be important therapeutic targets for HF treatment.
Methods
Study Design
Detailed information on the study design for the entire 47-patient trial (BORG, NCT01798992) has been previously published (2). Briefly, in the miR cohort patients were randomized open label to commercially available formulations of carvedilol (COREG, n = 14), metoprolol succinate (TOPROL-XL, n = 15) or metoprolol succinate + doxazosin mesylate (CARDURA, n = 14), which have in common blockade of β1-ARs. The general hypothesis tested in the current study was that changes in miRs are associated with reverse remodeling and the previously described changes in mRNA that can be characterized as belonging to a β1-GSN, and miR changes are potentially distinct between early (3 months) and later (12 months) time
points. As in the previous report of mRNA expression changes associated with reverse-remodeling Rs or NRs, data from the 3 treatment arms were collectively evaluated.
Endomyocardial biopsy
Endomyocardial biopsies were performed as previously described (2) from the distal right ventricular sep-tum at baseline (no treatment), and 3 and 12 months after treatment initiation. There were no procedural complications of biopsy.
RNV
was defined as not meeting LVEF positive-response criteria, or the occurrence of heart transplantation, LVAD placement, or death (2). If RNV data were missing at 12 months (n = 8), then the 3-month value was carried forward, using the R/NR response criteria (2).
RNA extraction
Biopsies were immediately frozen in liquid nitrogen and stored at –80°C. Samples from each patient were processed concomitantly. Total RNA was extracted using the mirVana miRNA Isolation Kit (Ambion, Inc.) according to the manufacturer’s recommendations, with the exception that the Lysis/Binding Buffer used for tissue homogenization was replaced with TRIzol (Invitrogen). Genomic contamination was elimi-nated by treatment with DNase (TURBO DNA-free Kit, Ambion, Inc.).
miR measurements by RT-PCR and array
RT-PCR. miRs potentially associated with the primary reverse-remodeling outcome were identified
statisti-cally as described in the Statistics section below. Candidate miRs were preselected for measurement by RT-PCR on the basis of either: (a) having been associated with biologic processes known or likely to be impor-tant in remodeling (hypertrophy, contractile dysfunction, apoptosis, fibrosis, regeneration, inflammation, or autophagy, n = 13, miR-1-3p, -21-5p, -98-5p, -143-3p, -145-5p, -181a-2-3p, -199a-5p, -208a-3p, -208b-3p, -320d, -378-3p, -494-3p, and -499a-5p, six of which had also been shown to be modified by β1-AR signaling); (b)
associated with non-remodeling biologic processes (n = 6, miR-302d-5p, -342-3p, -342-5p, -423-3p, -591, and -1260a); or (c) as a reference RNA (miR-103a and the small nuclear RNA S6). RNA for RT-PCR was ali-quoted first, and then remaining RNA was subjected to array analysis. No RT-PCR measurements were based on array data, as the measurements were generated in parallel.
Of the 41 patients with RT-PCR measurements, RNA starting material was insufficient in two 3-month samples and two 12-month samples. Endomyocardial biopsies were unavailable in an additional six 12-month patients due to study withdrawal (n = 2), patient relocation to another state (n = 2), death (n = 1), or insufficient biopsy sample (n = 1) (2). Thus, for RT-PCR miR measurements 41 patients had baseline and 3-month assess-ments and 35 also had 12-month measureassess-ments.
RT-PCR was performed in duplicate for each individual sample, as previously described (40). Abun-dance data for each of the 19 candidate miRs were normalized to the geometric mean of the fold changes of the 2 reference RNAs (41).
Array. For miR measurements by array, RNA starting material was insufficient for 12 of the 41
RT-PCR–measured patients, and in 2 patients there was adequate RNA for array but not for RT-PCR. Thus, 31 patients had miR measurements by array at baseline and 3 months. The 12-month array miR measure-ments were on 24 patients, with missing values arising for the same reasons as in the RT-PCR cohort plus an additional patient with an insufficient RNA amount. Broad-based miR measurements were per-formed in parallel with the candidate miR RT-PCR measurements, by array, using the 846-miR Affymetrix GeneChip miRNA Array v1.0 (miRBase version 11).
mRNA measurements by array
mRNA array analysis was performed using Affymetrix GeneChip Human Genome U133 Plus 2.0 Array as previously described (2), on 42 of the 43 subjects in the miR cohort.
Statistics
RT-PCR measurements. Three-month or 12-month changes from baseline values within R or NR groups were
assessed by the Wilcoxon signed-rank test, and differences in the fold-change values between Rs and NRs at 3 or 12 months were determined by a Wilcoxon rank-sum test (2). Missing values were interpolated from the mean values of the available other patients’ measurements relative to the patient’s measured value at the other time point (42). Hochberg multiple test correction was performed on P values for each group (43). A Hochberg corrected P less than 0.05 was considered statistically significant for the R versus NR comparisons. For the within-group fold changes, a Hochberg corrected P value of less than 0.05 within the R group cou-pled with a corrected P value of greater than 0.10 in the NR group was considered statistically significant.
Array miR measurements. The raw CEL files were analyzed with the miR QC Tool software for
C L I N I C A L M E D I C I N E
After normalization, the human-specific miRs were selected for further analysis. The normalized dataset contained the expression for 843 miRs at 3 time points (baseline, 3, and 12 months). The data first were normalized to baseline for each time point. Two different approaches were used to identify the signifi-cantly changed miR between R and NR. First, 2-tailed nonparametric statistical Wilcoxon signed-rank test was used to determine miRs that discriminate between R and NR at 3 and 12 months, with P less than 0.05 uncorrected for multiplicity taken for statistical significance. Second, for each miR fold change from baseline, differences between R and NR groups were assessed by the Wilcoxon rank-sum test, and the criteria for statistical significance were the same as for RT-PCR data except there was no correction of the P value for multiplicity. After the between-responder-groups statistical analysis, classification anal-ysis between the groups was done using RF (45) by generating 50,000 trees. The results of RF analanal-ysis were visualized using a multidimensional scaling plot. All the analyses were carried out with R (www.r-project.org). The RF model predictive accuracy was assessed, and the area under the ROC (AUC) was calculated using the pROC package in R (46).
Array mRNA measurements. The Affymetrix Bioconductor package was used to summarize and
nor-malize mRNA expression data. RMA normalization was performed on expression data based on internal standard amplification, and probe sets were annotated using the hgu133plus2.db Bioconductor package.
RNV, Responder versus Non-responder analyses. Ejection fraction and ventricular volume data were
ana-lyzed by a Wilcoxon rank-sum or signed-rank test using the R statistical package. Differences between treat-ment group response rates were assessed by contingency table analysis using Fisher’s exact test.
Predicted functional analysis
mRNA and miR expression at baseline was subtracted from expression at 3 and 12 months, which yields fold changes in the log2 scale data. miRs that significantly and selectively changed from baseline or between R and NR at 3 and 12 months as determined by RT-PCR, and the top 7 miRs as predicted by RF analysis of array data were selected for IPA. Predicted miR targets were determined using Target Scan. All predicted targets for a given miR were compared with the mRNA array dataset based on directionality of expression. mRNAs that were predicted miR targets and were selectively changed in R versus NR as determined by array were further analyzed by IPA.
Human studies approval
All human studies were performed according to the Declaration of Helsinki principles. All study partici-pants signed written informed consent for protocols approved by the IRBs of the University of Colorado Anschutz Medical Campus or the University of Utah. The BORG entire cohort study is described in clinicaltrials.gov (NCT01798992).
Author contributions
CCS supervised RT-PCR measurements of miRs, performed the IPA, and wrote the first draft of the manuscript. DPK provided data management, statistical analyses, and manuscript editing. JDP provided direction, partial funding of the miR analyses, and manuscript review. AKF provided statistical analyses and manuscript review. RAQ developed the imaging methods and ventriculography analyses. WM did the RNA extractions, performed the RT-PCR measurements for mRNAs, and provided manuscript review. KN performed the RT-PCR measurements of miRs and provided manuscript review. BDL was the Uni-versity of Colorado Clinical PI, performed endomyocardial biopsies, provided partial funding for miR measurements, and provided manuscript review. EMG was the University of Utah Clinical PI, performed endomyocardial biopsies, and provided manuscript review. MRB designed the study, provided funding and study management, in collaboration with AKF designed the statistical analysis plan, and wrote portions of and edited the manuscript.
Acknowledgments
The authors thank Rachel Rosenberg for manuscript processing.
1. Maron BJ, et al. Contemporary definitions and classification of the cardiomyopathies: an American Heart Association Scien-tific Statement from the Council on Clinical Cardiology, Heart Failure and Transplantation Committee; Quality of Care and Outcomes Research and Functional Genomics and Translational Biology Interdisciplinary Working Groups; and Council on Epidemiology and Prevention. Circulation. 2006;113(14):1807–1816.
2. Kao DP, et al. Therapeutic molecular phenotype of β-blocker-associated reverse-remodeling in nonischemic dilated cardiomy-opathy. Circ Cardiovasc Genet. 2015;8(2):270–283.
3. Vehlow C, Kao DP, Bristow MR, Hunter LE, Weiskopf D, Görg C. Visual analysis of biological data-knowledge networks. BMC Bioinformatics. 2015;16:135.
4. Lompre AM, Schwartz K, d’Albis A, Lacombe G, Van Thiem N, Swynghedauw B. Myosin isoenzyme redistribution in chronic heart overload. Nature. 1979;282(5734):105–107.
5. Nakao K, Minobe W, Roden R, Bristow MR, Leinwand LA. Myosin heavy chain gene expression in human heart failure. J Clin Invest. 1997;100(9):2362–2370.
6. Lowes BD, et al. Changes in gene expression in the intact human heart. Downregulation of alpha-myosin heavy chain in hyper-trophied, failing ventricular myocardium. J Clin Invest. 1997;100(9):2315–2324.
7. Sucharov CC, Mariner PD, Nunley KR, Long C, Leinwand L, Bristow MR. A beta1-adrenergic receptor CaM kinase II-depen-dent pathway mediates cardiac myocyte fetal gene induction. Am J Physiol Heart Circ Physiol. 2006;291(3):H1299–H1308. 8. Dockstader K, et al. Temporal analysis of mRNA and miRNA expression in transgenic mice overexpressing Arg- and Gly389
polymorphic variants of the β1-adrenergic receptor. Physiol Genomics. 2011;43(23):1294–1306.
9. Sucharov C, Bristow MR, Port JD. miRNA expression in the failing human heart: functional correlates. J Mol Cell Cardiol. 2008;45(2):185–192.
10. Port JD, Sucharov C. Role of microRNAs in cardiovascular disease: therapeutic challenges and potentials. J Cardiovasc Pharmacol. 2010;56(5):444–453.
11. Topkara VK, Mann DL. Role of microRNAs in cardiac remodeling and heart failure. Cardiovasc Drugs Ther. 2011;25(2):171–182. 12. Schipper ME, van Kuik J, de Jonge N, Dullens HF, de Weger RA. Changes in regulatory microRNA expression in myocardium
of heart failure patients on left ventricular assist device support. J Heart Lung Transplant. 2008;27(12):1282–1285.
13. Bristow MR. Treatment of chronic heart failure with β-adrenergic receptor antagonists: a convergence of receptor pharmacol-ogy and clinical cardiolpharmacol-ogy. Circ Res. 2011;109(10):1176–1194.
14. Lowes BD, et al. Myocardial gene expression in dilated cardiomyopathy treated with beta-blocking agents. N Engl J Med. 2002;346(18):1357–1365.
15. Eichhorn EJ, Bristow MR. Medical therapy can improve the biological properties of the chronically failing heart. A new era in the treatment of heart failure. Circulation. 1996;94(9):2285–2296.
16. Miyamoto SD, et al. Circulating microRNA as a biomarker for recovery in pediatric dilated cardiomyopathy. J Heart Lung Trans-plant. 2015;34(5):724–733.
17. Bristow MR, Roden RL, Lowes BD, Gilbert EM, Eichhorn EJ. The role of third-generation beta-blocking agents in chronic heart failure. Clin Cardiol. 1998;21(12 Suppl 1):I3–I13.
18. Friedman RC, Farh KK, Burge CB, Bartel DP. Most mammalian mRNAs are conserved targets of microRNAs. Genome Res. 2009;19(1):92–105.
19. Borow KM, et al. End-systolic volume as a predictor of postoperative left ventricular performance in volume overload from val-vular regurgitation. Am J Med. 1980;68(5):655–663.
20. Cheng S, Xu Y, Shi Z, Lin Y, Hoang CD, Zhang X. Overexpression of micro ribonucleic acid-591 inhibits cell proliferation and invasion of malignant pleural mesothelioma cells. Thorac Cancer. 2016;7(3):340–347.
21. Shohet JM, et al. A genome-wide search for promoters that respond to increased MYCN reveals both new oncogenic and tumor suppressor microRNAs associated with aggressive neuroblastoma. Cancer Res. 2011;71(11):3841–3851.
22. Wang X, et al. MicroRNA-494 targeting both proapoptotic and antiapoptotic proteins protects against ischemia/reperfusion-induced cardiac injury. Circulation. 2010;122(13):1308–1318.
23. Montgomery RL, et al. Therapeutic inhibition of miR-208a improves cardiac function and survival during heart failure. Circula-tion. 2011;124(14):1537–1547.
24. Satoh M, Minami Y, Takahashi Y, Tabuchi T, Nakamura M. Expression of microRNA-208 is associated with adverse clinical outcomes in human dilated cardiomyopathy. J Card Fail. 2010;16(5):404–410.
25. Gupta SK, et al. miR-21 promotes fibrosis in an acute cardiac allograft transplantation model. Cardiovasc Res. 2016;110(2):215–226. 26. Dong X, et al. Downregulation of miR-21 is involved in direct actions of ursolic acid on the heart: implications for cardiac
fibrosis and hypertrophy. Cardiovasc Ther. 2015;33(4):161–167.
27. Ikeda S, et al. MicroRNA-1 negatively regulates expression of the hypertrophy-associated calmodulin and Mef2a genes. Mol Cell Biol. 2009;29(8):2193–2204.
28. Zhang H, et al. Qiliqiangxin attenuates phenylephrine-induced cardiac hypertrophy through downregulation of miR-199a-5p. Cell Physiol Biochem. 2016;38(5):1743–1751.
29. Li Z, et al. miR-199-sponge transgenic mice develop physiological cardiac hypertrophy. Cardiovasc Res. 2016;110(2):258–267. 30. Mathiyalagan P, Okabe J, Chang L, Su Y, Du XJ, El-Osta A. The primary microRNA-208b interacts with Polycomb-group
pro-tein, Ezh2, to regulate gene expression in the heart. Nucleic Acids Res. 2014;42(2):790–803.
31. Hou Y, et al. β-adrenoceptor regulates miRNA expression in rat heart. Med Sci Monit. 2012;18(8):BR309–BR314. 32. Thum T, et al. MicroRNA-21 contributes to myocardial disease by stimulating MAP kinase signalling in fibroblasts. Nature.
2008;456(7224):980–984.
33. Castaldi A, et al. MicroRNA-133 modulates the β1-adrenergic receptor transduction cascade. Circ Res. 2014;115(2):273–283. 34. Kim IM, et al. β-Arrestin1-biased β1-adrenergic receptor signaling regulates microRNA processing. Circ Res. 2014;114(5):833–844. 35. Chen Z, Li C, Xu Y, Li Y, Yang H, Rao L. Circulating level of miR-378 predicts left ventricular hypertrophy in patients with
aortic stenosis. PLoS One. 2014;9(8):e105702.
C L I N I C A L M E D I C I N E
37. Sygitowicz G, Tomaniak M, Błaszczyk O, Kołtowski Ł, Filipiak KJ, Sitkiewicz D. Circulating microribonucleic acids miR-1, miR-21 and miR-208a in patients with symptomatic heart failure: Preliminary results. Arch Cardiovasc Dis. 2015;108(12):634–642. 38. Git A, et al. Systematic comparison of microarray profiling, real-time PCR, and next-generation sequencing technologies for
measuring differential microRNA expression. RNA. 2010;16(5):991–1006.
39. Ganesan J, et al. MiR-378 controls cardiac hypertrophy by combined repression of mitogen-activated protein kinase pathway factors. Circulation. 2013;127(21):2097–2106.
40. Sucharov CC, Sucharov J, Karimpour-Fard A, Nunley K, Stauffer BL, Miyamoto SD. Micro-RNA expression in hypoplastic left heart syndrome. J Card Fail. 2015;21(1):83–88.
41. Vandesompele J, et al. Accurate normalization of real-time quantitative RT-PCR data by geometric averaging of multiple inter-nal control genes. Genome Biol. 2002;3(7):RESEARCH0034.
42. Royston P. Multiple imputation of missing values. Stata J. 2004;4:227–241.
43. Benjamini Y, Hochberg Y. Controlling the false discovery rate: a practical and powerful approach to multiple testing. J R Stat Soc Series B Stat Methodol. 1995;57:289–300.
44. Irizarry RA, et al. Exploration, normalization, and summaries of high density oligonucleotide array probe level data. Biostatis-tics. 2003;4(2):249–264.
45. Liaw A. Wiener M. Classification and Regression by randomForest. R News. 2002;2:18–22. http://www.bios.unc.edu/~dzeng/ BIOS740/randomforest.pdf. Accessed December 16, 2016.

![Table 3. miR cohort, n = 43; RNV descriptive statistics by LVEF response, median [IQR]](https://thumb-us.123doks.com/thumbv2/123dok_us/84952.2010301/10.585.42.541.60.322/table-cohort-rnv-descriptive-statistics-lvef-response-median.webp)