InTrans Project Reports Institute for Transportation
6-2016
Upgrading Bridge Rails on Low-Volume Roads in
Iowa
Zachary Hans
Iowa State University, [email protected]
Basak Aldemir Bektas
Iowa State University, [email protected]
Brent Phares
Iowa State University, [email protected]
Follow this and additional works at:http://lib.dr.iastate.edu/intrans_reports
Part of theCivil Engineering Commons
This Report is brought to you for free and open access by the Institute for Transportation at Iowa State University Digital Repository. It has been accepted for inclusion in InTrans Project Reports by an authorized administrator of Iowa State University Digital Repository. For more information, please [email protected].
Recommended Citation
Upgrading Bridge Rails on Low-Volume Roads in Iowa
Abstract
Building on previous research, the goal of this project was to identify significant influencing factors for the Iowa Department of Transportation (DOT) to consider in future updates of its Instructional Memorandum (I.M.) 3.213, which provides guidelines for determining the need for traffic barriers (guardrail and bridge rail) at secondary roadway bridges—specifically, factors that might be significant for the bridge rail rating system component of I.M. 3.213. A literature review was conducted of policies and guidelines in other states and, specifically, of studies related to traffic barrier safety countermeasures at bridges in several states. In addition, a safety impact study was conducted to evaluate possible non-driver-related behavior characteristics of crashes on secondary road structures in Iowa using road data, structure data, and crash data from 2004 to 2013. Statistical models (negative binomial regression) were used to determine which factors were significant in terms of crash volume and crash severity. The study found that crashes are somewhat more frequent on or at bridges possessing certain characteristics—traffic volume greater than 400 vehicles per day (vpd) (paved) or greater than 50 vpd (unpaved), bridge length greater than 150 ft (paved) or greater than 35 ft (unpaved), bridge width narrower than its approach (paved) or narrower than 20 ft (unpaved), and bridges older than 25 years (both paved and unpaved). No specific roadway or bridge characteristic was found to contribute to more serious crashes. The study also confirmed previous research findings that crashes with bridges on secondary roads are rare, low-severity events. Although the findings of the study support the need for appropriate use of bridge rails, it concludes that prescriptive guidelines for bridge rail use on secondary roads may not be necessary, given the limited crash expectancy and lack of differences in crash expectancy among the various combinations of explanatory characteristics.
Keywords
bridge barrier rails, bridge guardrails, crash severity mitigation, low-volume roads, safety countermeasures, secondary road bridges
Disciplines
Civil Engineering
Comments
Upgrading Bridge Rails on
Low-Volume Roads in Iowa
Final Report
June 2016
Sponsored by
About InTrans
The mission of the Institute for Transportation (InTrans) at Iowa State University is to develop and implement innovative methods, materials, and technologies for improving transportation efficiency, safety, reliability, and sustainability while improving the learning environment of students, faculty, and staff in transportation-related fields.
About CTRE
The mission of the Center for Transportation Research and Education (CTRE) at Iowa State University is to develop and implement innovative methods, materials, and technologies for improving transportation efficiency, safety, and reliability while improving the learning environment of students, faculty, and staff in transportation-related fields.
Disclaimer Notice
The contents of this report reflect the views of the authors, who are responsible for the facts and the accuracy of the information presented herein. The opinions, findings and conclusions expressed in this publication are those of the authors and not necessarily those of the sponsors.
The sponsors assume no liability for the contents or use of the information contained in this document. This report does not constitute a standard, specification, or regulation.
The sponsors do not endorse products or manufacturers. Trademarks or manufacturers’ names appear in this report only because they are considered essential to the objective of the document.
ISU Non-Discrimination Statement
Iowa State University does not discriminate on the basis of race, color, age, ethnicity, religion, national origin, pregnancy, sexual orientation, gender identity, genetic information, sex, marital status, disability, or status as a U.S. veteran. Inquiries regarding non-discrimination policies may be directed to Office of Equal Opportunity, Title IX/ADA Coordinator, and Affirmative Action Officer, 3350 Beardshear Hall, Ames, Iowa 50011, 515-294-7612, email [email protected].
Iowa DOT Statements
Federal and state laws prohibit employment and/or public accommodation discrimination on the basis of age, color, creed, disability, gender identity, national origin, pregnancy, race, religion, sex, sexual orientation or veteran’s status. If you believe you have been discriminated against, please contact the Iowa Civil Rights Commission at 800-457-4416 or the Iowa Department of Transportation affirmative action officer. If you need accommodations because of a disability to access the Iowa Department of Transportation’s services, contact the agency’s affirmative action officer at 800-262-0003.
Technical Report Documentation Page
1. Report No. 2. Government Accession No. 3. Recipient’s Catalog No. IHRB Project TR-679
4. Title and Subtitle 5. Report Date
Upgrading Bridge Rails on Low-Volume Roads in Iowa June 2016
6. Performing Organization Code
7. Author(s) 8. Performing Organization Report No.
Zachary Hans, Basak Aldemir Bektas, Emmanuel Nketah, and Brent Phares (orcid.org/0000-0003-0649-9124, orcid.org/0000-0002-0866-6216, orcid.org/0000-0001-6678-5128, and orcid.org/0000-0001-5894-4774)
InTrans Project 14-508
9. Performing Organization Name and Address 10. Work Unit No. (TRAIS) Institute for Transportation
Iowa State University
2711 South Loop Drive, Suite 4700 Ames, IA 50010-8664
11. Contract or Grant No.
12. Sponsoring Organization Name and Address 13. Type of Report and Period Covered Iowa Highway Research Board
Iowa Department of Transportation 800 Lincoln Way
Ames, IA 50010
Final Report
14. Sponsoring Agency Code IHRB Project TR-679
15. Supplementary Notes
Visit www.intrans.iastate.edu for color pdfs of this and other research reports.
16. Abstract
Building on previous research, the goal of this project was to identify significant influencing factors for the Iowa Department of Transportation (DOT) to consider in future updates of its Instructional Memorandum (I.M.) 3.213, which provides guidelines for determining the need for traffic barriers (guardrail and bridge rail) at secondary roadway bridges—specifically, factors that might be significant for the bridge rail rating system component of I.M. 3.213.
A literature review was conducted of policies and guidelines in other states and, specifically, of studies related to traffic barrier safety countermeasures at bridges in several states. In addition, a safety impact study was conducted to evaluate possible non-driver-related behavior characteristics of crashes on secondary road structures in Iowa using road data, structure data, and crash data from 2004 to 2013. Statistical models (negative binomial regression) were used to determine which factors were significant in terms of crash volume and crash severity.
The study found that crashes are somewhat more frequent on or at bridges possessing certain characteristics—traffic volume greater than 400 vehicles per day (vpd) (paved) or greater than 50 vpd (unpaved), bridge length greater than 150 ft (paved) or greater than 35 ft (unpaved), bridge width narrower than its approach (paved) or narrower than 20 ft (unpaved), and bridges older than 25 years (both paved and unpaved).
No specific roadway or bridge characteristic was found to contributeto more serious crashes. The study also confirmed previous research findings that crashes with bridges on secondary roads are rare, low-severity events. Although the findings of the study support the need for appropriate use of bridge rails, it concludes that prescriptive guidelines for bridge rail use on secondary roads may not be necessary, given the limited crash expectancy and lack of differences in crash expectancy among the various
combinations of explanatory characteristics.
17. Key Words 18. Distribution Statement
bridge barrier rails—bridge guardrails—crash severity mitigation—low-volume roads—safety countermeasures—secondary road bridges
No restrictions.
19. Security Classification (of this report)
20. Security Classification (of this page)
21. No. of Pages 22. Price
Unclassified. Unclassified. 56 NA
U
PGRADING
B
RIDGE
R
AILS
ON
L
OW
-V
OLUME
R
OADS IN
I
OWA
Final Report June 2016
Principal Investigator
Zachary Hans, Research Engineer
Center for Transportation Research and Education, Iowa State University
Co-Principal Investigators
Basak Aldemir Bektas, Research Scientist
Center for Transportation Research and Education, Iowa State University Brent Phares, Director
Bridge Engineering Center, Iowa State University
Research Assistant
Emmanuel Nketah
Authors
Zachary Hans, Basak Aldemir Bektas, Emanuel Nketah, and Brent Phares
Sponsored by
the Iowa Highway Research Board and the Iowa Department of Transportation
(IHRB Project TR-679)
Preparation of this report was financed in part
through funds provided by the Iowa Department of Transportation through its Research Management Agreement with the
Institute for Transportation (InTrans Project 14-508)
A report from
Institute for Transportation Iowa State University
2711 South Loop Drive, Suite 4700 Ames, IA 50010-8664
TABLE OF CONTENTS
ACKNOWLEDGMENTS ... ix
EXECUTIVE SUMMARY ... xi
Background ... xi
Research Methodology ... xi
Key Findings ... xii
Conclusions ... xii
INTRODUCTION ...1
LITERATURE REVIEW ...2
Policies and Guidelines ...2
Previous Studies ...5
DATA COLLECTION METHODOLOGY ...12
Roadway Database ...12
Structure Data ...12
Crash Data ...13
Data Processing ...14
DATA ANALYSIS METHODOLOGY...15
Data Sampling and Descriptive Statistics ...15
Statistical Models ...23
STATISTICAL ANALYSIS ...27
Crash Frequency Results...27
Crash Severity Results ...32
Results Implications ...33
CONCLUSION ...35
REFERENCES ...39
LIST OF FIGURES
Figure 1. Unshielded bridge rail end...7 Figure 2. Example of a bridge structure struck more than once ...14 Figure 3. Diagram showing crashes of any given year linked to the databases of that year ...14 Figure 4. Distribution of structures along the paved and unpaved secondary roadways by
traffic volume (AADT) ...17 Figure 5. Examples of typical roadway cross-sections with negative relative (narrow)
bridge width (left) and positive relative (wider) bridge width (right) ...18 Figure 6. Distribution of structures along the paved and unpaved secondary roadways by
width ...18 Figure 7. Distribution of structures along the paved and unpaved secondary roadways by
length ...19 Figure 8. Distribution of structures along the paved and unpaved secondary roadway
LIST OF TABLES
Table 1. Example of MASH test matrix for traffic barrier Systems ...3
Table 2. Summary of studies related to traffic barrier safety countermeasures ...5
Table 3. Fixed object potential hazards ...6
Table 4. Distribution of number of structures per number of crashes ...13
Table 5. Distribution of structures and “bridge” crashes by county for the top 5 plus technical advisory committee counties ...15
Table 6. Distribution of structures and “bridge” crashes by paved and unpaved secondary road network system ...16
Table 7. Descriptive statistics of model variables ...21
Table 8. Distribution of number of structures by crash Severity ...21
Table 9. Descriptive statistics of the statewide secondary roads used in the statewide sample ...22
Table 10. Descriptive statistics of the paved and unpaved secondary roads used in the paved and unpaved samples ...23
Table 11. Distribution of “bridge” crashes by severity for the paved and unpaved road network systems ...24
Table 12. Pearson’s correlation matrix for explanatory variables used in the statewide sample ...27
Table 13. Pearson’s correlation matrix for explanatory variables used in the paved sample ...27
Table 14. Pearson’s correlation matrix for explanatory variables used in the unpaved sample ...28
Table 15. Negative binomial regression results for the overall (statewide) model ...28
Table 16. Log-likelihood and AIC values of variables at various thresholds for the paved sample ...30
Table 17. Log-likelihood and AIC values of variables at various thresholds for the unpaved sample ...30
Table 18. Negative binomial regression results for the paved model using paved sample ...31
Table 19. Negative binomial regression results for the unpaved model using unpaved sample ...31
Table 20. Threshold rankings based on effect on expected crashes on paved secondary roads ...33
ACKNOWLEDGMENTS
EXECUTIVE SUMMARY
The goal of this project was to identify significant influencing factors for the Iowa Department of Transportation (Iowa DOT) to consider in future updates of its Instructional Memorandum (I.M.) 3.213 (Iowa DOT 2013), which provides guidelines for determining the need for traffic barriers (guardrail and bridge rail) at secondary roadway bridges—specifically, factors that might be significant for the bridge rail rating system component of I.M. 3.213.
Background
A previous study for the Iowa Highway Research Board (IHRB TR-592) provided an overview of the nation’s bridge and approach rail state of practice and of a statewide crash analysis of bridge rails and approach guardrails on low-volume road (LVR) bridges in Iowa. The study found that LVR bridge crashes were rare events, occurring more frequently on bridges with widths of less than 24 ft. Crash rates were found to be higher on bridges with a narrower width compared to the approach roadway width.
Partly as a result of TR-592, changes were made to the guardrail exceptions in I.M. 3.213 to increase the average daily traffic (ADT) exception from 200 vehicles per day (vpd) to 400 vpd and add an exception for bridges with widths greater than the approach roadway width.
However, no significant changes were made to the detailed bridge rail rating system component of I.M. 3.213, which is used to determine necessary bridge rail upgrades by assigning points to bridges based on crash history, ADT, width, length, and type of bridge rail. Thus, the current study was a follow-up to, and builds upon, the results of TR-592.
Research Methodology
A literature review was conducted of policies and guidelines in other states and, specifically, of studies related to traffic barrier safety countermeasures at bridges. Bridge railing and guardrails are a Group 3 (high-severity) fixed object/hazard (Stephens 2005). In general, however, for certain roadway characteristics such as LVRs, it may not be necessary or desirable to design bridge railing or guardrail countermeasures to full AASHTO standards. Also, the Guidelines for
Geometric Design of Very Low-Volume Local Roads (ADT ≤400 vpd) (AASHTO 2001)
recommend that safety improvements should be initiated only when a safety problem exists at a site.
First, a combined sample set involving the entire secondary road network (statewide) to investigate the effects of the explanatory variables (road and structure characteristics) on the expectancy of bridge crashes for the entire network as a whole was analyzed. Then, separate samples from only paved roads and unpaved roads, respectively, were analyzed. Splitting the network into paved and unpaved secondary systems allowed for more specific parameter estimation for the paved and unpaved systems, which may have exclusive policies and characteristics that cannot be specified as variables.
Several characteristics were identified as possible factors correlated with bridge crashes: traffic volume and percentage of heavy vehicles, roadway cross-section features factors such as lane/shoulder widths and structure length, roadway alignment factors such as the presence of horizontal/vertical curvature, and weather conditions factors such as the presence of rain/snow or low visibility settings. Several factors were excluded from the study for various reasons, leaving the following factors to be considered in the final analyses: traffic volume (ADT), bridge width, bridge length, and bridge age.
Key Findings
The study confirmed previous research findings that crashes with bridges on secondary roads are rare, low-severity events. The study did find that crashes are somewhat more frequent on or at bridges possessing certain characteristics:
Traffic volume greater than 400 vehicles per day (vpd) (paved) or greater than 50 vpd (unpaved)
Bridge length greater than 150 ft (paved) or greater than 35 ft (unpaved)
Bridge width narrower than its approach (paved) or narrower than 20 ft (unpaved) Bridges older than 25 years (both paved and unpaved).
No specific roadway or bridge characteristic, including paved or unpaved, was found to contribute to more serious crashes.
Conclusions
INTRODUCTION
In March 2010, the Iowa Highway Research Board (IHRB) sponsored project “Bridge Rail and ApproachRailing for Low-Volume Roads In Iowa” (TR-592) (Bigelow et al. 2010) was
completed. TR-592 provided an overview of the nation’s bridge and approach rail state of
practice as well as results of a statewide crash analysis of bridge rails and approach guardrails on low-volume road (LVR) bridges in Iowa. Primary analysis findings were that LVR bridge crashes were rare events, occurring on bridges with very low volumes and width less than 24 ft. Additionally, crash rates were higher on bridges with a narrower width compared to the approach roadway width.
The Iowa Department of Transportation (DOT) used the TR-592 findings, in part, in the July 18, 2013, update of Instructional Memorandum (I.M.) 3.213 (found in Appendix A) which provides guidelines for determining the need for traffic barriers (guardrail and bridge rail) at roadway bridges. Specifically, the following changes were made to the guardrail exceptions: (1) the average daily traffic (ADT) exception was increased from 200 vehicles per day (vpd) to 400 vpd and (2) an exception was added for bridges with a width greater than the approach roadway width. However, no significant changes were made to the bridge rail rating system component of I.M. 3.213. This system is used to determine necessary bridge rail upgrades by assigning points to bridges based on crash history, ADT, width, length, and type of bridge rail.
The existing bridge barrier rail rating system is somewhat detailed, with limited documentation regarding the basis for point assignment, categories, and thresholds employed. For example, a combination of different crash severities and frequencies dictates crash history-based point assignment. However, if minimum equivalent crash costs are estimated for these different combinations, resulting costs may overlap among categories. A wide range of values may also exist within any given category. Using the Iowa DOT’s Traffic Safety Improvement Program (TSIP) benefit cost worksheet, the minimum equivalent cost for a bridge receiving 10 points can be in excess of $300,000, while minimum costs for bridges receiving 15 and 20 points range from approximately $15,000 to $4.8M and $22,000 to $4.8M, respectively. That said, I.M. 3.213’s bridge barrier rail rating system still supports the essential role of promoting traffic safety on local roads, ensuring motorists adequate protection from more hazardous objects.
This project builds on previously completed research, including TR-592, through
comprehensive, rigorous analysis of crash experience at or on secondary road bridges in Iowa. A primary objective is to investigate and identify significant influencing factors that may be
LITERATURE REVIEW
Policies and Guidelines
Modern highway design concepts essentially began in the 1940s; however, roadside safety design did not start until the 1970s (AASHTO 2011). Sometimes referred to as “off-pavement” design, roadside design is often defined as the design of the area outside the traveled way. Today, many roadways built prior to 1970 have reached their useful designed lifespan and are prime candidates for reconstruction—an opportunity to update and improve their “off-pavement” designs. National- and state-level roadway design guidelines have been established to be used by states and local agencies as acceptable design standards/guidance and are regularly
revised/refined over time. Released in 1967, the Highway Design and Operational Practices
Related to Highway Safety was the first official report that focused attention on hazardous
roadside elements and suggested appropriate treatments for them (AASHTO 2011). The document was later revised and updated in 1974 with the introduction of roadside concepts by the American Association for State Highway Officials. In 1989, AASHTO published the first edition of the Roadside Design Guide. Through years of experience and research, the design guide has been modified over time to include sequential options for reducing crashes involving roadside obstacles. The following, in order of preference, are techniques suggested for reducing crashes and crash severity:
1. Remove the obstacle.
2. Redesign the obstacle so it can be safely traversed.
3. Relocate the obstacle to a point where it is less likely to be struck. 4. Reduce impact severity by using an appropriate breakaway device.
5. Shield the obstacle with a longitudinal traffic barrier designed for redirection or use a crash cushion.
6. Delineate the obstacle if the previous alternatives are not appropriate.
Often, the removal or relocation of such roadside obstacles may be impractical or unavoidable. Along roadways where the shortest lateral distance (i.e., horizontal clearance) to a roadside fixed objects is considered “insufficient” or hazardous to user safety, some common cost-effective countermeasures include the installation of obstacle protective devices such as cable/traffic barriers, guardrails, or impact attenuators (crash cushions), the installation of “on-the-pavement” edge safety features such as shoulder rumble strips/stripes, or a combination of both to help errant vehicles recover after diverging from its traveled way before colliding with a roadside obstacle. In many cases, these counteragents may be appropriate and have been proven beneficial toward the reduction of the severity and possibly frequency of run-off-road crashes. Nonetheless, they do not completely explain the problem of serious injuries associated with roadway departure crashes involving roadside objects.
and light pole supports, and work zone hardware used on the NHS (or federally funded projects) shall meet full-scale crash performance criteria contained in the National Cooperative Highway Research Program (NCHRP) Report 350: Recommended Procedures for the Safety Performance
Evaluation of Highway Features (Ross et al. 1993) or AASHTO’s MASH (AASHTO 2009).
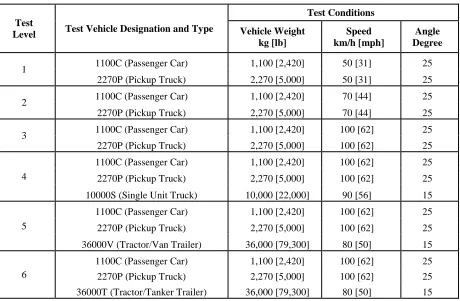
[image:19.612.69.529.258.559.2]Bridge railings are very important components of roadway safety systems and play an important role in preventing and mitigating crash severity. Since their primary purpose is to prevent penetration, bridge railings must be strong enough to redirect an impacting vehicle. MASH presents specific test level (TL) impact conditions at various speeds for conducting vehicle crash tests. However, because of concerns with high speed conditions, test level 3 (TL-3), tested at 100 km/h (62 mph), devices are considered standard by many highway agencies (AASHTO 2009). Table 1 shows the test matrix for traffic barrier systems.
Table 1. Example of MASH test matrix for traffic barrier Systems
Test
Level Test Vehicle Designation and Type
Test Conditions Vehicle Weight
kg [lb]
Speed km/h [mph]
Angle Degree
1 1100C (Passenger Car) 1,100 [2,420] 50 [31] 25
2270P (Pickup Truck) 2,270 [5,000] 50 [31] 25
2 1100C (Passenger Car) 1,100 [2,420] 70 [44] 25
2270P (Pickup Truck) 2,270 [5,000] 70 [44] 25
3 1100C (Passenger Car) 1,100 [2,420] 100 [62] 25
2270P (Pickup Truck) 2,270 [5,000] 100 [62] 25
4
1100C (Passenger Car) 1,100 [2,420] 100 [62] 25
2270P (Pickup Truck) 2,270 [5,000] 100 [62] 25
10000S (Single Unit Truck) 10,000 [22,000] 90 [56] 15
5
1100C (Passenger Car) 1,100 [2,420] 100 [62] 25
2270P (Pickup Truck) 2,270 [5,000] 100 [62] 25
36000V (Tractor/Van Trailer) 36,000 [79,300] 80 [50] 15
6
1100C (Passenger Car) 1,100 [2,420] 100 [62] 25
2270P (Pickup Truck) 2,270 [5,000] 100 [62] 25
36000T (Tractor/Tanker Trailer) 36,000 [79,300] 80 [50] 15
Source: AASHTO 2009
In many instances, TL-3 devices work for both TL-1 and TL-2 conditions as well as for high speed conditions. The FHWA reviews test results and issues worthiness letters for each bridge rail that is tested according to the evaluation criteria.
guide also recommends clear zone ranges based on a width of 30 to 32 ft for flat, level terrain adjacent to a straight section of a 60 mph highway with an average daily traffic of 6,000 vehicles. For steeper slopes on a 70 mph roadway the clear zone range increases to 38 to 46 ft, and on a low speed, low-volume roadway the clear zone range drops to 7 to 10 ft. For horizontal curves the clear zone can be increased by up to 50%. Another AASHTO publication, A Policy on
Geometric Design of Highways and Streets (also known as the Green Book), recommends a
10-foot minimum clear zone on collectors without curbs, low-speed rural collectors, and rural local roads (AASHTO 2004). For local roads and streets, a minimum clear zone of 7 to 10 ft is considered desirable on sections without curb. As a practical matter, the clear zone dimensions may be limited by available right-of-way; the location, frequency, and nature of roadside objects; the presence of valued resources such as wetlands; or the need to provide for pedestrians
(AASHTO 2004). Thus, railing or guardrail countermeasures designed to full AASHTO
standards may not be necessary/desirable for certain roadway characteristics such as LVRs. Also,
the Guidelines for Geometric Design of Very Low-Volume Local Roads (ADT ≤400 vpd)
(AASHTO 2001) recommends that safety improvements should be initiated only when a safety problem exists at a site. Furthermore, the design guide states that a one-lane bridge can be used for roads with traffic volumes of less than 100 vpd.
Roadside crash fatality rate for rural roads is estimated to be nearly three times the average roadside fatal crash rate for all roads in the United States (Ross et al. 1993), and these types of roads typically have very restricted rights-of-way, little to no clear zones, and substandard design features. Because of their low traffic volumes, drivers are more likely to become distracted and fatigued. Nonetheless, this is still a concern on all roads. The Manual on Uniform Traffic Control
Devices (MUTCD) requires that post/sign supports within the clear zone be made breakaway or
shielded by a barrier (FHWA 2009). All existing supports located on highways posted at 50 mph or greater shall meet this criterion by January 2013. On roads posted at speeds 45 mph or lower, the breakaway criterion may be met when upgrading sign retroreflectivity or by 2019, whichever comes first. Based on an urban roadside safety study conducted by Dixon et al. (2009) on arterial and collector-type facilities in urban areas with speeds up to 50 mph, the authors assessed
corridors of urban roadside conditions and compared 6 years of historic crash data with roadside features and noted that “restricted right-of-way with a greater demand for functional use of the space adjacent to urban roads makes the maintenance of a wide clear zone impractical.”
Engineering is not a science; it is an art. As an art, its practice precedes its theory. Thus, per design standard, most countermeasures are routinely installed based on a subjective analysis of their benefits to the motorist. However, on occasion, the benefits gained from a specific safety design or treatment may not be immediately obvious; thus, engineering judgement is also required to decide how, where, and when funds are spent to achieve maximum benefit.
Addressing safety on local and rural roads presents several challenges including the actuality that 1) safety issues are often random on local and rural roads and 2) strategies to address local and rural road safety are diverse and draw from several safety areas. Consequently, per AASHTO’s
Load and Resistance Factor Design (LRFD) manual, agencies are required to develop their
warrants for bridge installations (or upgrades) per site (FHWA 2001). They are also encouraged to upgrade existing safety hardware that has not been accepted either during a bridge’s
one methodological approach typically used for accomplishing a benefit/cost analysis of various countermeasure alternatives.
Previous Studies
Supplemental to national-level guidance, several agencies have analyzed the design and safety countermeasures of bridges through various research efforts. Nonetheless, it is impossible for regression models to account for each and every factor associated with crash occurrences
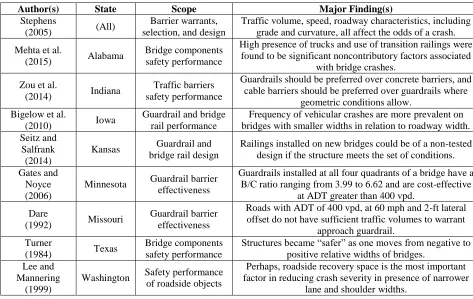
[image:21.612.66.539.309.608.2](Persaud and Dzbik 1993). As the first crash frequency modelers to analyze multilane roadways, Persaud and Dzbik investigated the relationship between freeway crashes and traffic volumes (Chengye and Ranjitkar 2013). In design, most focus is typically placed on the crashworthiness of the guardrail/bridge rail connections and end treatments; hence, very few studies were found to be directly related to the objectives of this research. Table 2 shows summaries of findings related to traffic barrier safety countermeasures in design and traffic safety characteristics.
Table 2. Summary of studies related to traffic barrier safety countermeasures
Author(s) State Scope Major Finding(s)
Stephens
(2005) (All)
Barrier warrants, selection, and design
Traffic volume, speed, roadway characteristics, including grade and curvature, all affect the odds of a crash.
Mehta et al.
(2015) Alabama
Bridge components safety performance
High presence of trucks and use of transition railings were found to be significant noncontributory factors associated
with bridge crashes.
Zou et al.
(2014) Indiana
Traffic barriers safety performance
Guardrails should be preferred over concrete barriers, and cable barriers should be preferred over guardrails where
geometric conditions allow. Bigelow et al.
(2010) Iowa
Guardrail and bridge rail performance
Frequency of vehicular crashes are more prevalent on bridges with smaller widths in relation to roadway width. Seitz and
Salfrank (2014)
Kansas Guardrail and bridge rail design
Railings installed on new bridges could be of a non-tested design if the structure meets the set of conditions.
Gates and Noyce (2006)
Minnesota Guardrail barrier effectiveness
Guardrails installed at all four quadrants of a bridge have a B/C ratio ranging from 3.99 to 6.62 and are cost-effective
at ADT greater than 400 vpd.
Dare
(1992) Missouri
Guardrail barrier effectiveness
Roads with ADT of 400 vpd, at 60 mph and 2-ft lateral offset do not have sufficient traffic volumes to warrant
approach guardrail. Turner
(1984) Texas
Bridge components safety performance
Structures became “safer” as one moves from negative to positive relative widths of bridges.
Lee and Mannering
(1999)
Washington Safety performance of roadside objects
Perhaps, roadside recovery space is the most important factor in reducing crash severity in presence of narrower
lane and shoulder widths.
All States
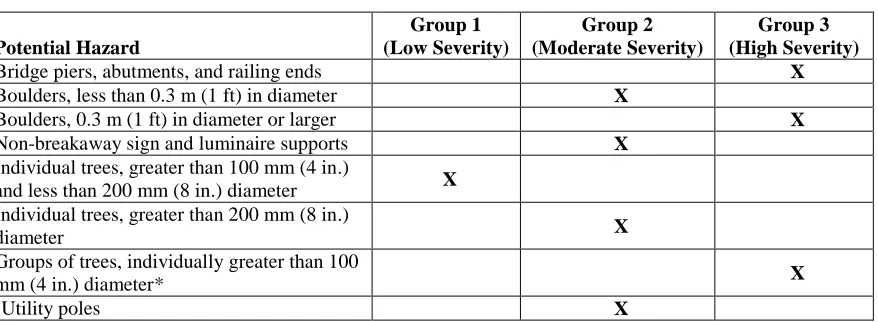
low-speed roads. They require processes to ensure that all important issues are addressed rather than a “cookbook” approach. Thus he suggests special, practical considerations be taken for such road classification per condition situations. Relative to this study, they include consideration for speed, hazard offset, and special design considerations for aesthetics and severe conditions. Table 3 lists hazards and their potential severity.
Table 3. Fixed object potential hazards
Potential Hazard
Group 1 (Low Severity)
Group 2 (Moderate Severity)
Group 3 (High Severity)
Bridge piers, abutments, and railing ends X
Boulders, less than 0.3 m (1 ft) in diameter X
Boulders, 0.3 m (1 ft) in diameter or larger X
Non-breakaway sign and luminaire supports X
Individual trees, greater than 100 mm (4 in.)
and less than 200 mm (8 in.) diameter X
Individual trees, greater than 200 mm (8 in.)
diameter X
Groups of trees, individually greater than 100
mm (4 in.) diameter* X
Utility poles X
*Because of driver expectancy, a group of trees at a consistent offset for lengthy distances may experience lower encroachment rates, even though the offset may be within the clear zone. In such instances, it may be appropriate to consider the trees a Group 2 hazard.
Source: Stephens 2005
Stephens 2005
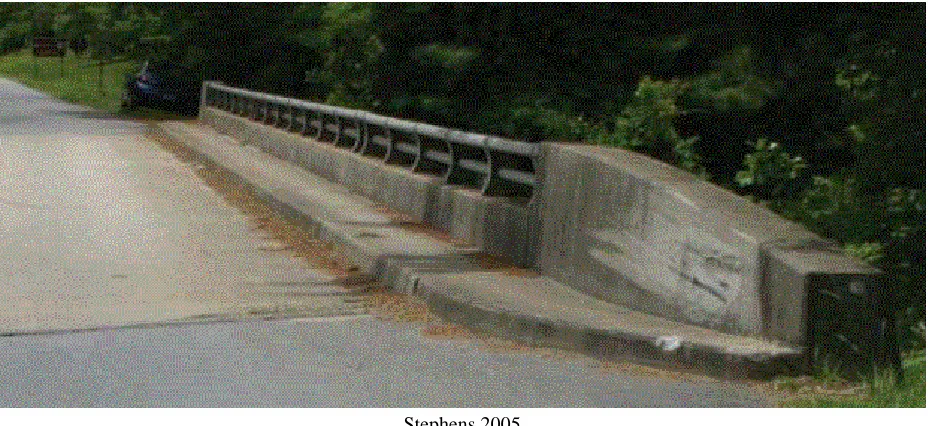
Figure 1. Unshielded bridge rail end
Similarly, within the perspective of traffic operations, the concepts of probability and severity must be understood to effectively evaluate roadside safety alternatives. Stephens (2005) suggested that the probability (or likely frequency) of a vehicle striking any roadside object or condition (including barriers) should be determined by a complex set of variables, including the following:
Traffic volume Speed
Roadway characteristics (number and width of lanes, shoulders, divided or not, etc.) Horizontal curvature
Grade
Size and offset of the hazard or barrier
Rate of encroachment (affected by familiarity of drivers, driver distractions, driver expectancy and design consistency of the roadway)
Alabama
A recent study conducted by Mehta et al. aimed to develop safety performance functions for overall crashes and single-vehicle crashes involving bridges in Alabama (Mehta et al. 2015). The study focused on 1,122 bridge structures located on state and interstate highways, including ramps. Of the structures considered, 9,985 crashes along the structures’ overpasses were
the expected number of bridge crashes, whereas high presence of trucks and use of transition railings were found to be significant noncontributory factors likely to decrease the expected number of bridge crashes. It was also found that the predictive capability of the final model (using all significant variables) was not much different from the predictive capability of similar model using only AADT, bridge length, and truck percentage. Moreover, the authors noted that, if available, the variables related to the presence of bridge railings or guardrails may be included but are not essential.
Indiana
Another study conducted by Zou et al. (2014) analyzed the severity of injuries sustained by vehicle occupants when colliding with several types of roadside barriers along freeways. The study focused on the safety performance of road barriers in Indiana in reducing the risk of injury. In so doing, the study compared the risk of injury among different hazardous events faced by an occupant in a single-vehicle crash. The studied hazardous events included rolling over, striking three types of barriers (guardrails, concrete barrier walls, and cable barriers) with different barrier offsets to the edge of the traveled way, and striking various roadside objects. A total of 2,124 single-vehicle crashes (3,257 occupants) that occurred between 2008 and 2012 on 517 pair-matched homogeneous barrier and non-barrier segments were analyzed. The findings indicated that crashes involving barriers such as guardrails or cable barriers are typically less severe than crashes with poles or rollover crashes. More specifically, the study found that the likelihood of occupant injury was reduced significantly across several crash barrier types as offset distance increased depending on the barrier struck. For example, odds of injury decrease 43% when colliding with a guardrail within 15–18 ft rather than colliding with a median concrete barrier within the same lateral offset distance. Further injury reductions were observed when compared to a concrete barrier within 7–14 ft of the traveled way. The study claimed that guardrails should be preferred over concrete barriers, and cable median barriers should be
preferred over guardrails where geometric conditions allow. The study noted, however, that there was a certain degree of invariability across vehicle characteristics in regards to crash severity sustained and general interactions between barrier types during collisions.
Iowa
The most recent study in the state of Iowa concerning LVR traffic barriers was conducted by Bigelow et al. (2010) to determine criteria and guidelines used by states for bridge and approach guardrail implementation on low-volume roads. The primary objective of the study was to provide information about the use of bridge rail and approach guardrail on LVR in Iowa. Statistical and economic analyses were used to aid the investigation. The authors found that, based on a survey of non-Iowa bridge owners, most agencies tend to not use ADT as a
A previous study led by Schwall (1989) in the state of Iowa in 1988 looked at the
cost-effectiveness of approach guardrails on primary-system roads. Schwall found that, to obtain a B/C ratio of 1.0 or better, a traffic volume of at least 1,400 vpd with a guardrail offset of 2 ft is required.
Currently, the Iowa DOT recommends upgrade standards provided in its Instructional
Memorandums (I.M.s) to Local Public Agencies that warrant bridge railing upgrades based on scoring of five criteria (Iowa DOT 2013):
1. Crash History (in the past 5 years) 2. ADT (current year annual daily traffic) 3. Bridge Width (curb-to-curb) in ft 4. Bridge Length (in ft)
5. Bridge Type
Kansas
A study by Seitz and Salfrank (2014) aimed to maximize the safety benefits of low-cost bridge design for low-volume local roads in Kansas given the limited funding. The study consisted primarily of bridge/approach guardrail crash-cost analyses. In conclusion, the authors
recommended that bridge rails installed on new or rehabilitated bridges utilizing federal funds could be of a non-tested design if the structure meets the set of conditions. This non-tested design should be constructed of a W-beam guardrail section mounted on standard guardrail posts that are fastened to the bridge structure either by welding or a bolted connection. In addition, no approach guardrail will be required on these bridges. Nonetheless, Seitz and Salfrank noted that, although the findings would support a policy that does not require installation of bridge rails on structures between 20 ft and 50 ft on roads functionally classified as Local Roads with less than 50 vpd), it is recognized that there are benefits of the rail that cannot be evaluated by this effort.
In support, an earlier study in the state of Kansas (Russell and Rys 1998) compared the probabilities and expected cost of crashes at bridge and culvert locations with bridge rails and headwalls versus the expected cost of crashes with bridge rails and culvert headwalls removed. Russell and Rys concluded that the expected costs of these crashes were less with the concrete rails and headwalls removed for ditch depths of 2.4 meters or less.
Minnesota
A study led by Gates and Noyce (2005) analyzed characteristics of 96 run-off-road, rural-area crashes that occurred on the approach or departure railings of low-volume state-aid highway bridges in Minnesota over a 14-year period from 1988 to 2002. The objective of the study was to determine the ADT at which the B/C ratio suggests that installation of guardrails at the bridge approach is cost-effective (i.e., B/C > 1.0). On the basis of statistical and benefit-cost analyses, the study confirmed that crashes that occurred at bridges with approach guardrails were
involving bridges with approach guardrails were more likely to result in property damage only. More precisely, approach guardrails installed at all four quadrants of a bridge had a B/C ratio ranging from 3.99 to 6.62 and are cost-effective at traffic volumes greater than or equal to 400 vpd, according to Gates and Noyce. The study recommended to the Minnesota DOT that a minimum threshold of 400 vpd be a requirement for the installation of a bridge guardrail on LVRs, which is consistent with current roadside clear zone guidelines suggested by AASHTO for local LVRs. The authors furthermore suggest that bridges with ADT volumes between 150 to 400 vpd be reviewed individually because bridges with unique circumstances (bridges along curves and/or bridges with narrow widths) may warrant guardrails. Installing guardrails along bridges serving ADT less than 150 vpd is considered probably not cost-effective by Gates and Noyce; nonetheless, if a guardrail is installed, it should be on all four corners of the bridge.
Missouri
The Missouri DOT (MoDOT) concluded from a study by Dare (1992) that roads with an ADT of 400 vpd at 60 mph speed limit and 2-ft lateral guardrail offset do not have sufficient traffic volumes to warrant approach guardrail. The same study also provided higher thresholds values for 40 and 50 mph speeds and lateral offsets of 8 and 10 ft, respectively.
Texas
A similar study conducted by Turner (1984) aimed to identify hazardous structures, evaluate potential safety treatments, predict bridge accidents, and set priorities for improvement at bridges in Texas. Rural, two-lane two-way bridge crashes were the focus of the study. The investigation was narrowed to a statistically consistent sample of 2,849 crashes that occurred at or near 2,087 structures during a 4-year period. The research led to emphasis on three key variables: (1) width of a bridge (bridge width minus road width), (2) ADT, and (3) width of the approach roadway. These variables were used to develop a probability table for collision prediction. Results showed that the structures became “safer” as one moves from negative to positive relative widths of bridges.
Washington
One study conducted by Lee and Mannering (1999) investigated the relationships among roadway geometry, roadside characteristics, and run-off-roadway accidents and concluded that temporal, environmental, driver-related, roadway, and roadside geometric characteristics all play a role in roadside crash severity. However, the study also declared that perhaps roadside recovery space is the most important factor in reducing crash severity. Other factors such as driver
DATA COLLECTION METHODOLOGY
In order to conduct a safety impact study to evaluate possible non-driver-related behavior characteristics of crashes on secondary road structures in Iowa, a statewide analysis of crashes occurring during the period from January 2004 to December 2013 was performed. The primary sources of data for this analysis included the Iowa DOT Geographic Information Management System (GIMS) and the Iowa Crash Data. A statewide query and integration of all data from 2004 to 2013 was performed using ArcGIS 10.2 software program.
From the GIMS database, two sets of records were of interest: the Base Record Road Data and the Structure Data. In conjunction with these two GIMS records were the Crash Record Data that came from the Iowa Crash Data for the same years (2004–2013).
Roadway Database
The Base Record Road database included all public road records in Iowa. However, given the scope of the research, only roadways under county jurisdiction (secondary roads) were
considered in the analysis. Roadways classified as interstate, major U.S./state route, municipal, or institutional roads were excluded. Of those roadways included in the study, roadway
characteristics were associated with the structures along the network, including the following key characteristics:
Annual average daily traffic volume of the road Speed limit of the road
Roadway geometry (in terms of width and number of lanes serving the roadway) Surface type of the roadway (paved versus unpaved)
On the basis of these criteria, approximately 75% (88,000 miles) of the public road network were considered local, secondary roads. Moreover, 80% of the secondary roadway network had
unpaved surface type and 20% paved.
Structure Data
The Structure database included all National Bridge Inventory (NBI) structures in the state of Iowa, specifically, those structures of a minimum length of 20 ft, located along secondary roadways and serving vehicular traffic on the bridge. Structures serving railroads and other non-vehicular modes were excluded from the analysis. Of the nearly 26,000 recorded structures in the database, 20,791 (79.2%) of them were vehicular bridge structures on a secondary roadway. Those also included box-culverts of 20 ft or longer along secondary roads. Of those structures retained, some of the key structure characteristics included were the structure number/ID, the structure geometry (i.e., bridge length and bridge width), and structure construction or
on a paved road network system (n = 5,704) and those situated on an unpaved road network system (n = 15,087).
Crash Data
The crash database includes reported and recorded crashes on all public roads resulting in an injury or minimum estimated property damage of $1,500. In the 10-year analysis period from 2004 to 2013, there were a total of 547,654 automobile crashes reported and recorded in the state of Iowa; however, of those recorded, less than 1% (5,377) were crashes involving a vehicle striking a bridge or bridge rail on a secondary roadway overpass. Furthermore, based on the premise that all crashes of interest may or may not be geospatially accurate and providing that all structures (including those less than 20 ft in length) are not geospatially located in the structure database, the preliminary 5,377 “bridge” crashes of interest were then examined and refined.
In an attempt to minimize possible errors in the crash coding/selection procedure, bridge crashes within 50 m (164 ft) of either inventoried structures in the database or streams/rivers intersecting secondary roadways were initially retained. The spatial proximity of 50 m was employed to address changes (improvements) in the spatial accuracies of the roadway, structures, and crash database throughout the analysis period and not neglect crashes located at non-inventoried structures. However, due to lack of extensive information about these non-inventoried structures, corresponding crashes were ultimately excluded from analysis. The majority of crashes excluded from consideration were (a) crashes involving collision with an animal, (b) ramp crashes, and (c) crashes indicated as along a structure underpass based on vehicle initial direction of travel. Thus, upon final revision of the refined crashes, the locations of 846 crashes involving vehicles striking a bridge or bridge component were retained and used in the succeeding analysis.
[image:29.612.79.547.595.658.2]Of the crashes included in the study, key crash characteristics were noted and associated to the nearest structure to each crash. Key crash characteristics included the following: a unique crash key (and case number) for each crash, the severity level of the crash (in terms of number of fatalities and injuries), number of vehicles involved in a crash, location and time of the crash, and other environmental and weather conditions during the time of collision. These 846 crashes occurred at 729 structures, with some structures involved in more than one crash during the analysis period. Table 4 shows the distribution of structures ranging from 20,062 structures with zero crashes to 1 structure with 6 crashes.
Table 4. Distribution of number of structures per number of crashes
Road Network
Number of Structures per Number of Crashes on the Structure Zero Crashes One Crash Two Crashes Three Crashes Four Crashes Five Crashes Six Crashes
Paved 5312 332 44 11 3 1 1
Unpaved 14750 313 16 7 1 0 0
©2016 Google
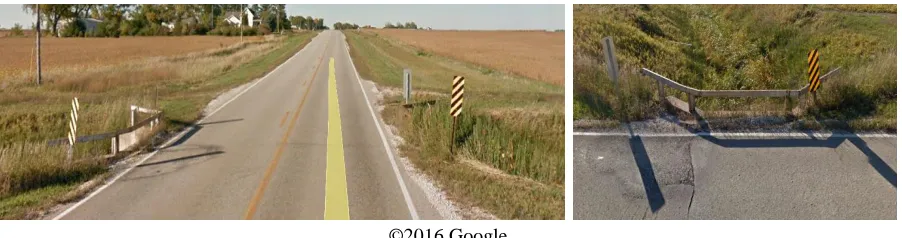
Figure 2. Example of a bridge structure struck more than once
Data Processing
Within the analysis period, in order to correct for potential temporal differences in the GIMS data each year, crashes of any given year were linked to the Structure and Road database of the year the crash record occurred, as illustrated in Figure 3.
Figure 3. Diagram showing crashes of any given year linked to the databases of that year
For example, if a crash occurred in 2004, its Structure and Road Data were based on the 2004 record for which the crash occurred. Furthermore, in any instance where a structure experienced no crash in the analysis period, its Structure and Road data were based on the middle year GIMS snapshot record (2008–2009). In any instance where a structure experienced multiple crashes in different years (or same year) in the analysis period, the averages of the Structure and Road Data were used to avoid over representation of structures with multiple crashes in the final analysis.
Structure Database
• Structure Number • Structure Width • Structure Length • …etc.
Road
Database
• Traffic Volume • Speed Limit • Number of Lanes • …etc.
Crash Database
• Crash Key/Number • Crash Severity • Number of Vehicles • …etc.
[image:30.612.75.541.322.469.2]DATA ANALYSIS METHODOLOGY
In an effort to apply the most appropriate methods that best reflect the data distribution to produce effective model results, a number of sampling approaches were considered for various statistical modeling approaches (i.e., negative binomial regression model vs. Poisson regression). Sampling adjustments were also made based on the advice from the project’s technical advisory committee (TAC) to improve the study variables for a better representation of local roads and bridges and to have variables that conform to potential policy decisions. Final decisions on the selection of the statistical models were based on the data set and analysis results.
Data Sampling and Descriptive Statistics
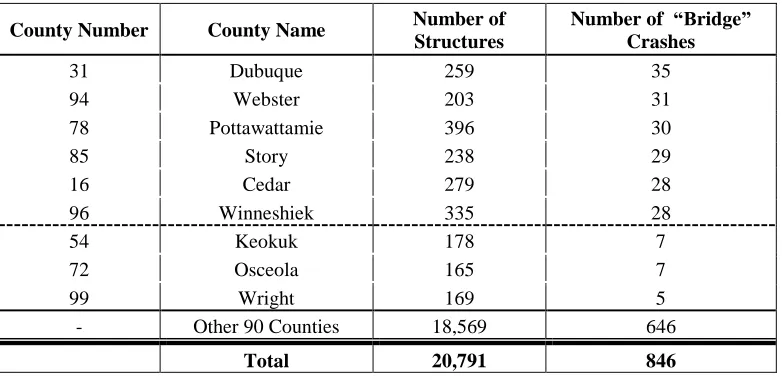
[image:31.612.72.463.328.518.2]Initially, based on advice from the project’s TAC, only selected counties (shown in Table 5) were included in the data sample.
Table 5. Distribution of structures and “bridge” crashes by county for the top 5 plus technical advisory committee counties
County Number County Name Number of Structures
Number of “Bridge” Crashes
31 Dubuque 259 35
94 Webster 203 31
78 Pottawattamie 396 30
85 Story 238 29
16 Cedar 279 28
96 Winneshiek 335 28
54 Keokuk 178 7
72 Osceola 165 7
99 Wright 169 5
- Other 90 Counties 18,569 646
Total 20,791 846
These were the top five counties, including one tie, which experienced the most bridge crashes (Dubuque, Webster, Pottawattamie, Story, Cedar, and Winneshiek) in addition to three counties represented by the TAC (Keokuk, Osceola, and Wright). However, due to the small sampling size of 200 crashes within these counties, the analysis was expanded to include all counties to improve the results and have sufficient number of observations for the statistical analysis.
Moving forward, the analysis was implemented in three parts. First, a combined sample set involving the entire secondary road network (statewide) to investigate the effects of the
systems, which may have exclusive policies and characteristics that cannot be specified as variables. Table 6 shows the distribution of bridge crashes and number of structures represented in the three models.
Table 6. Distribution of structures and “bridge” crashes by paved and unpaved secondary road network system
Statewide Sample Paved Sample Unpaved Sample Statewide
Road Network
Paved Road Network
Unpaved Road Network Number/% of Crashes 846 100% 477 56% 369 44%
Number/% of Structures 20,791 100% 5,704 27% 15,087 73%
Based on the descriptive statistics of the sample data and previous literature, a few characteristics stood out to be factors correlated with bridge crashes and were considered initially in this
analysis. Those characteristics included traffic volume and percentage of heavy vehicles, roadway cross-section features factors such as lane/shoulder widths and structure length, roadway alignment factors such as the presence of horizontal/vertical curvature, and weather conditions factors such as the presence of rain/snow or low visibility settings.
However, based on the project objectives/scope, data availability, and expected effect on the model outcomes, not all aforementioned variables were used as explanatory variables to estimate bridge crashes. For example, characteristics such as weather-related factors were excluded from the analysis due to their seasonal effects, and roadway alignment factors involving curvatures were also excluded due to lack of their availability in the database.
As a starting point, factors and thresholds used from the current I.M. 3.213 criteria (i.e., ADTs, bridge widths, and bridge lengths) were considered for the analysis. Descriptive statistics and the distribution of the variables were used to refine the variables considered for the analysis.
Traffic Volume
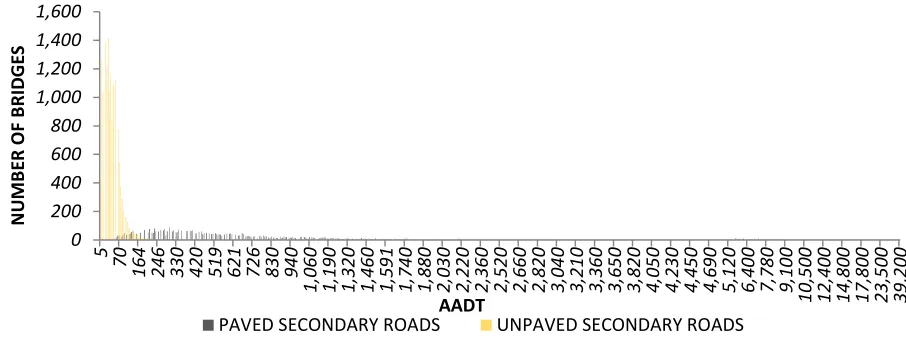
Figure 4. Distribution of structures along the paved and unpaved secondary roadways by traffic volume (AADT)
As evident, there are more structures on the unpaved network than the paved network; however, there are more crashes and higher traffic volumes on the paved system than the unpaved system.
Bridge Width
Among several variables that pertain to bridge and roadway width, bridge roadway width was preferred as a variable, in lieu of surface lane or shoulder widths. This was preferred given that, the bridge width is the face-to-face or curb-to-curb minimum distance measurement between the structure railings which would include both lane and shoulder widths (and medians when
indicated) and also bridge roadway width was the most consistently collected variable. For structures with closed or no medians, the bridge width is the sum of the most restrictive
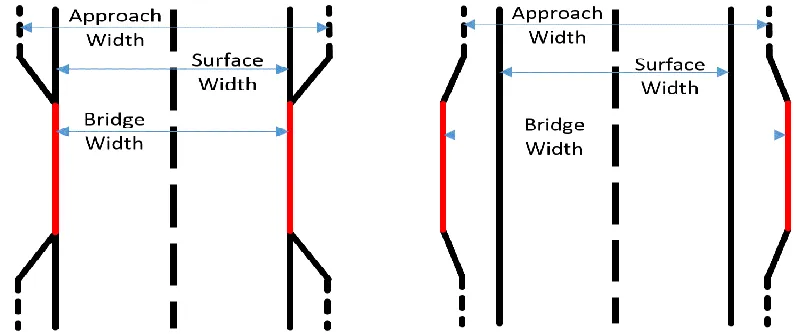
minimum distances for all roadways carried by the structure. In an effort to simplify the analysis and account for median presence, an alternative variable as relative bridge width (the algebraic difference between bridge and approach roadway widths) was used. Figure 5 shows an example of a typical roadway bridge cross-section with respect to its approach, surface, and bridge widths. 0 200 400 600 800 1,000 1,200 1,400 1,600 5 70 16 4 24 6 33 0 42 0 51 9 62 1 72 6 83 0 94 0 1,06 0 1,19 0 1,32 0 1,46 0 1,59 1 1,74 0 1,88 0 2,03 0 2,22 0 2,36 0 2,52 0 2,66 0 2,82 0 3,04 0 3,21 0 3,36 0 3,65 0 3,82 0 4,05 0 4,23 0 4,45 0 4,69 0 5,12 0 6,40 0 7,78 0 9,10 0 10 ,5 00 12 ,4 00 14 ,8 00 17 ,8 00 23 ,5 00 39 ,2 00 N UM B ER O F B R ID G ES AADT
Figure 5. Examples of typical roadway cross-sections with negative relative (narrow) bridge width (left) and positive relative (wider) bridge width (right)
Relative bridge width of negative value indicates bridge structures that are narrower than the traveled way. Both the bridge and approach widths include shoulder and median widths. Also, the cases with missing values for bridge roadway width were removed from consideration to consistently analyze the effects of these variables. Figure 6 shows the distribution of bridge roadway widths for both the paved and unpaved bridge structures.
Figure 6. Distribution of structures along the paved and unpaved secondary roadways by width
Bridge Length
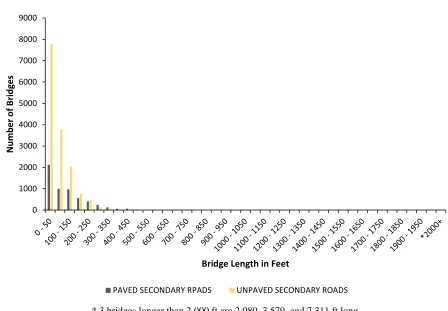
A majority (52%) of the structures on the unpaved road network are structures less than or equal to 50 ft long, whereas, on the paved road network, 72% of the structures are less than or equal to 150 ft long. Figure 8 shows the distribution of structure length for both the paved and unpaved road bridge structures.
0 200 400 600 800 1,000 1,200 1,400 1,600
10 16 20 23 25 27 29 32 34 37 42 46 52 58 70 96
N
u
m
b
e
r
o
f B
ri
d
ge
s
Bridge Roadway Width in Feet
[image:34.612.77.530.383.546.2]* 3 bridges longer than 2,000 ft are 2,080, 3,579, and 7,311 ft long
Figure 7. Distribution of structures along the paved and unpaved secondary roadways by length
Bridge Age
In an effort to better understand the range of construction (or reconstruction) year of bridges on the paved and unpaved road networks, bridge age was calculated with respect to the year of crash, or middle year in cases of no crash. Figure 8 shows the age distribution of all structures along the secondary road networks.
0 1000 2000 3000 4000 5000 6000 7000 8000 9000
Nu
m
b
er
of B
ri
d
ges
Bridge Length in Feet
Figure 8. Distribution of structures along the paved and unpaved secondary roadway by age
As shown, over half (51%) of the structures on paved and unpaved road networks are over the age of 35; these were structures last designed or reconstructed prior to 1980.
Tables 7 through 10 show the descriptive and summary statistics respectively for all variables considered in the analysis.
0 50 100 150 200 250 300 350 400 450 500
0 20 40 60 80
10
0
12
3
N
u
m
b
e
r
o
f B
ri
d
ge
s
Bridge Age in Years
Table 7. Descriptive statistics of model variables
Variable Description
Number of Crashes (in 10 years) The sum of crashes from 2004 to 2013 involving bridges (per structure).
Crash Severity (1 = Fatal; 5 = PDO) 1 = Fatal, 2 = Major, 3 = Minor, 4 = Possible/Unknown, 5 = (Property Damage Only (PDO) crashes
Structure Length (ft) The length of a structure (bridge) in ft.
Bridge Roadway Width (ft) The curb-to-curb distance (width) between the structure railings (in ft).
Approach Roadway Width (ft) The width of usable roadway approaching the structure (in ft).
Relative Approach Width (ft) The algebraic difference in bridge and approach roadway widths (in ft).
Narrow Approach Indicator An indicator variable for structure narrower than approach: 1 = narrow; 0 otherwise.
Bridge Age (Years) The average (or middle year) age of the structure at time of crash.
AADT (vehicles per day) The annual average number of vehicles using the structure roadway each day.
Speed Limit (MPH) The posted speed limit of the roadway the structure is on (in miles per hour).
Surface Lane Width (ft) The width of roadway surface (excluding shoulder and median widths).
Median Width (ft) The width of roadway median in ft.
Paved Road Indicator An indicator variable for structure on paved road: 1 = paved; 0 otherwise.
Number of Lanes The number of lanes serving the roadway the structure is on.
Average Shoulder Width (ft) The algebraic average of the right and left shoulder widths of the roadway.
Number of Observations The total number of secondary road structures considered.
Table 8. Distribution of number of structures by crash Severity
Road Network
Number of Structures by Crash Severity Property
Damage Only
Possible/ Unknown
Minor Injury
Major Injury Fatal Paved 274 100 74 23 6
[image:37.612.66.381.482.556.2]Table 9. Descriptive statistics of the statewide secondary roads used in the statewide sample
Statewide (Secondary) Road Network Variable Min Mean Std. Dev. Max
CRASH DATABASE
Number of Crashes (in 10 years) 0 0.04 0.23 6
Crash Severity (1 = Fatal; 5 = PDO) 1 4.21 1.03 5
STRUCTURE DATABASE
Structure Length (ft) 18 86.38 107.58 3580
Bridge Roadway Width (ft) 12 24.82 6.75 113
Approach Roadway Width (ft) 8 27.66 6.67 137
Relative Approach Width (ft) -38 -2.74 5.12 46
Narrow Approach Indicator 0 0.68 0.47 1
Bridge Age (Years) 0 39.07 25.92 142
ROAD DATABASE
AADT (vehicles per day) 5 433.49 1675.94 30300
Speed Limit (MPH) 5 52.78 7.32 55
Surface Lane Width (ft) 10 23.53 3.82 75
Median Width (ft) 0 0.05 1.06 40
Paved Road Indicator 0 0.27 0.45 1
Number of Lanes 1 2.03 0.25 6
Average Shoulder Width (ft) 0 1.86 2.01 15
Table 10. Descriptive statistics of the paved and unpaved secondary roads used in the paved and unpaved samples
Paved (Secondary) Road Network
Unpaved (Secondary) Road Network
Variable Min Mean Std.
Dev. Max Min Mean
Std.
Dev. Max
CRASH DATABASE
Number of Crashes
(in 10 years) 0 0.08 0.34 6 0 0.02 0.17 4
Crash Severity
(1 = Fatal; 5 = PDO) 1 4.29 0.98 5 1 4.12 1.08 5
STRUCTURE DATABASE
Structure Length (ft) 20 125.82 174.59 3580 18 71.46 60.09 855
Bridge Roadway
Width (ft) 12 30.66 8.63 113 12 22.81 4.46 60
Approach Roadway
Width (ft) 8 33.63 8.83 137 9 25.42 3.68 63
Relative Approach
Width (ft) -38 -3.06 6.81 46 -27 -2.63 4.39 38
Relatively Narrow
Approach Width (%) 0 0.63 0.48 1 0 0.70 0.46 1
Bridge Age (Years) 0 35.99 22.14 113 0 40.24 27.12 142
ROAD DATABASE
AADT (vehicles per day) 5 1439.7
5 2957.46 30300 5 52.37 177.39 6000
Speed Limit (MPH) 10 48.19 11.47 55 5 54.52 3.60 55
Surface Lane Width (ft) 12 24.31 5.79 75 10 23.23 2.67 38
Median Width (ft) 0 0.20 2.01 40 0 0.00 0.00 0
Number of Lanes 1 2.09 0.46 6 1 2.00 0.01 2
Avg. Shoulder Width (ft) 0 4.03 2.73 15 0 1.03 0.53 10
Number of Observations 5,704 15,087
As can be seen in Table 10, on average more crashes occur on paved roads than on unpaved roads, probably due to exposure. Nonetheless, though paved roads experience higher traffic volumes, they also experience more non-injury crashes on average compared to unpaved roads. The summary statistics also revealed that, of those structures with no missing values, there are more narrow structures on unpaved roads (70%) than on paved roads (63%). Whereas, on average, structures on paved roads are relatively younger in age in comparison to structures on unpaved roads (Figure 8).
Statistical Models
Crash Frequency
the mean). Negative binomial regression variance term includes a dispersion parameter vector (𝛼) that is different than zero; so selection between negative binomial regression and Poisson regression models depends on the significance of the overdispersion parameter. Equation (1) shows the expected number of crash events (𝑦𝑖) per structure (𝑖) per period of time using a negative binomial regression.
𝐸[𝑦𝑖] = exp(𝛽0+ ∑𝑛 𝛽𝑖𝑋𝑖
𝑖=1 + 𝜀𝑖) 𝑜𝑟 ln(𝐸[𝑦𝑖]) = 𝛽0+ ∑𝑛𝑖=1𝛽𝑖𝑋𝑖 + 𝜀𝑖 (1)
where: 𝐸[𝑦𝑖] = the expected crash frequency per structure (𝑖) in 10 years, 𝛽0 = the intercept term,
𝛽𝑖 = the (estimated) parameter coefficient per variable 𝑋,
𝑋𝑖 = the explanatory variables (traffic volume, length, widths, age), and 𝜀𝑖 = the disturbance term.
The (gamma-distributed) disturbance term 𝜀𝑖 has the mean of 1 and variance of 𝛼. The addition of this term allows the variance of the distribution to differ from the mean within a negative binomial regression as shown in equation (2).
𝑉𝐴𝑅[𝑦𝑖] = E[𝑦𝑖][1 + 𝛼𝐸[𝑦𝑖]] = 𝐸[𝑦𝑖] + 𝛼𝐸[𝑦𝑖]2 (2)
Crash Severity
[image:40.612.69.539.470.616.2]Table 11 shows the distribution of bridge crashes by severity on both paved and unpaved roads.
Table 11. Distribution of “bridge” crashes by severity for the paved and unpaved road network systems
Statewide Road Network
Paved Road Network
Unpaved Road Network Crash Severity Crash Count % Crash Count % Crash Count %
No Injury (PDO) 465 55% 274 57% 191 52%
Possible/Unknown Injury 174 21% 100 21% 74 20%
Minor Injury 144 17% 74 16% 70 19%
Major Injury 49 6% 23 5% 26 7%
Fatal Injury 14 2% 6 1% 8 2%
TOTAL 846 100% 477 56% 369 44%
𝑧 = 𝛽𝑋 + 𝜀 (3)
where: 𝑧 = a latent variable used for the basis of modeling observed ordinal-injury severities,
𝛽 = the (estimated) parameter coefficient per variable 𝑋,
𝑋 = the explanatory variables (traffic volume, length, widths, age), and
[image:41.612.74.422.226.447.2]𝜀 = the disturbance term.
Figure 9 illustrates an ordered probability parameter threshold using equation (3) for the observed ordinal severity dataset (𝑦) per crash defined as the following:
𝑦 = 5 If 𝑧 > 𝜇3
𝑦 = 4 If 𝜇2 < 𝑧 ≤ 𝜇3
𝑦 = 3 If 𝜇1 < 𝑧 ≤ 𝜇2
𝑦 = 2 If 𝜇0 < 𝑧 ≤ 𝜇1
𝑦 = 1 If 𝑧 ≤ 𝜇0
after Washington et al. 2011
Figure 9. Illustration of ordered probability regression with 𝝁𝒊 as parameter thresholds
Goodness of Fit Measures
Numerous goodness-of-fit statistics are used to assess the overall fit of regression model results. The coefficient of determination (R2) is a commonly used fundamental statistic. It serves as a numerical value ranging from zero to one which summarizes the overall strength of the model, with zero indicating a model with no predictive power and one indicating a model with perfect predictive power (Hu et al. 2006). This statistic can be interpreted as a proportion of the variance that can be predicted (explained) given a set of explanatory/independent variables within a model (compared to its constant-only model).
parameters (Washington et al. 2011). For this analysis, the McFadden pseudo-R2 (written as 𝜌2) is utilized as the preferred statistic and is calculated using equation (4):
𝜌2 = 1 −𝐿𝐿(𝛽)
𝐿𝐿(0) (4)