*Corresponding author: Naveen. Y ISSN: 0976-3031
Research Article
EXPERIMENTAL ANALYSIS TO PREDICT THE FORMABILITY OF ALUMINIUM
AA6061-T6 SHEET METAL AT ELEVATED TEMPERATURES
*Naveen. Y., Radhika.S and Swapna.D
Department of Mechanical Engineering, RVR&JC College of Engineering (Autonomous)
Chowadavaram: Guntur-522019, AP, India
DOI: http://dx.doi.org/10.24327/ijrsr.2019.1007.3693
ARTICLE INFO ABSTRACT
Formability, it is the capacity of a material to be formed into a particular shape without failure, it is an important property of sheet metals to create complex sheet parts effectively. Prediction of Formability, Thickness distribution in deep drawing process will decrease the production cost and time of material to be formed. In this study, Experimental analysis is using to draw cylindrical cups at elevated temperatures i.e. Room temperature (32°C), 150°C, 300°C and with different thickness of blanks i.e. 1mm, 1.5mm, 2mm with 105mmm dia, 110 mm dia. Influence of forming temperature on maximum drawing load is measured. Influence of forming temperature on thickness strain, Influence of forming temperature on radial strain, Influence of forming temperature on Hoop strain were tabulated and experimentally analysed. Experimentally thickness distribution at various locations in half cut cup along with flange region is identified. Forming limit curves are plotted based on the experimental results predicted safe zone for sheet metal for different thickness of blanks.
INTRODUCTION
In automobile they test the formability of newly developed materials to introduce new models with better performance to get customer satisfaction or to select them for specific applications [1]. For that experimental analysis is needed number of experiments have to conduct to get good product. Theoretical analysis of deep drawing of cups was first reported by Hessenberg (HESSEBGERG, 1954), and Danckert (Danckert, 1995) studied the effect of residual stress in deep drawing of cylindrical cups by process modelling the die profile. The results of the parametic variation of the numerical simulation by Kobayashi and co-workers (Kobayashi and Alton, 1989; Kobayashi, 1978) compared reasonably well with experimental work of swift and chung (swift and chung, 1951), introduced plasticity matrices with elasto-plasto model for analysing cup drawing.D Swapna, S Radhika were reported a review on deep drawing (swapna and radhika, 146-149, 2018),
Venkateswarlu. G and.; Davidson, M were (venkateswarlu,
Davidson and Tagour, 2(11), 41–49 (2010).) worked on the
influence of process parameters.A. C. Reddy, T. Kishen Kumar
Reddy and M. VidyaSagar (vol.4, no.3, pp.53-62, 2012.) studied the characterization of warm deep drawing process. Yamuna, B., Reddy, A. C. Parametric (6(4), 2015, pp.
416-424)) worked on influence of elevated temperatures on warm deep drawing process.
Table 1 Chemical composition of AA 6061-T6
Component Al Cr Cu Fe Mg Mn Si Ti Zn WT % 98.6 0.04 0.4 0.7 1.2 Max 0.15 0.8 Max0.15 Max 0.25
Table 2 Mechanical properties of AA6061
Property Metric English
Hardness, Rockwell B 60 60
Hardness, Vickers 107 107
Ultimate Tensile Strength 310 MPa 45000 psi Tensile Yield Strength 276 MPa 40000 psi
Elongation at Break 12 % 12 %
Modulus of Elasticity 68.9 GPa 10000 ksi
Poisson's Ratio 0.33 0.33
Fatigue Strength 96.5 MPa 14000 psi Fracture Toughness 29 MPa-m½ 26.4 ksi-in½
Shear Strength 207 MPa 30000 psi
The main tools used in deep drawing process are blank, punch, die and blank holder.Fig.1 will give the basic idea of deep drawing as follows.
Available Online at http://www.recentscientific.com
International Journal of
Recent Scientific
Research
International Journal of Recent Scientific Research
Vol. 10, Issue, 07(D), pp. 33555-33561, July, 2019
Copyright © Naveen. Y., Radhika.S and Swapna.D, 2019, this is an open-access article distributed under the terms of the Creative Commons Attribution License, which permits unrestricted use, distribution and reproduction in any medium, provided the original work is properly cited.
DOI: 10.24327/IJRSR
CODEN: IJRSFP (USA)
Article History: Received 15th April, 2019 Received in revised form 7th May, 2019
Accepted 13th June, 2019 Published online 28th July, 2019
Key Words:
Naveen. Y et al., Experimental Analysis To Predict The Formability of Aluminium
Fig 1 Deep drawing of cylindrical cup formation
Aluminium alloys [4] are indispensable as an important material in sheet metal industry because of their superior properties such as acceptable cost, low density, good mechanical properties, structural integrity and simple fabrication pr
Aluminium alloys are used in the production of railcars, marine hulls, military vehicles and aircraft. Sheet metal fabrication industries require materials that do not undergo necking, wrinkling and fracture during the forming process so that dimensional accuracy is maintained. The forming limit diagram was introduced by Keelar, an extensive work was done by Goodwin and the evaluation of the FLD was made simple by Hecker. Strano and Colosimo emphasised an approach to determine the forming limit curve based on experimental results. Their work focused on the separation of safe strains and failure strains[14].Many investigations have been reported on the sheet metal formability. However, a combined study of the construction of a FLD, the prediction of a FLD using a model and influence of parameters at different temperatures with different diameter blanks and with different thickness has not yet been carried out. The present investigation has been undertaken with the aim of establishing the forming l diagram of Three different thickness blanks 1mm, 1.5mm, 2mm with two different diameters 105mm & 110mm at three different temperatures Room Temperature 32°C, 150°C, 300°C. This paper has attempted to experimental evaluation of aluminium sheets at elevated temperature. Also the Strains along radial strain, hoops strain [6] is measured. Thickness variation measured along the cup portions like Base, punch corner, wall, Die corner, Flange portion were measured. By using experimental investigation Forming l
plotted for all thickness blanks, Safe zone fo0r better forming was predicted.
Experimental Procedure
In experimentation first aluminium sheets are cut into Blanks as per the requirement. The aluminium Blanks are set apart with line examples of circles by using electric discharge machining. Blank is clamped at movable blank holder. The starting operations directed at three distinct temperatures (Room temperature, 150°C, 300°C). At the point when sheet metal is formed, It is subjected to Different stresses. These stresses create non-uniform strains and many prompt wrinkling or crack in the formed specimen. forming procedure causes the line patterns to disfigure by a sum which relies upon the neighbourhood twisting experienced by the sheet metal. After the sheet metal is shaped, the circles will turn into an oval unless disfigurement is unadulterated biaxial stretching.
Experimental Analysis To Predict The Formability of Aluminium AA6061-T6 Sheet Metal At Elevated Temperatures
cup formation
are indispensable as an important material in sheet metal industry because of their superior properties such as acceptable cost, low density, good mechanical properties, structural integrity and simple fabrication process [5]. Aluminium alloys are used in the production of railcars, marine hulls, military vehicles and aircraft. Sheet metal fabrication industries require materials that do not undergo necking, wrinkling and fracture during the forming process so that dimensional accuracy is maintained. The forming limit diagram was introduced by Keelar, an extensive work was done by Goodwin and the evaluation of the FLD was made simple by Hecker. Strano and Colosimo emphasised an approach to curve based on experimental results. Their work focused on the separation of safe strains and .Many investigations have been reported on the sheet metal formability. However, a combined study of the of a FLD using a model and influence of parameters at different temperatures with different diameter blanks and with different thickness has not yet been carried out. The present investigation has been undertaken with the aim of establishing the forming limit diagram of Three different thickness blanks 1mm, 1.5mm, 2mm with two different diameters 105mm & 110mm at three different temperatures Room Temperature 32°C, 150°C, 300°C. This paper has attempted to experimental evaluation of ated temperature. Also the Strains is measured. Thickness variation measured along the cup portions like Base, punch corner, wall, Die corner, Flange portion were measured. By using experimental investigation Forming limit diagram was plotted for all thickness blanks, Safe zone fo0r better forming
In experimentation first aluminium sheets are cut into Blanks as per the requirement. The aluminium Blanks are set apart with line examples of circles by using electric discharge machining. Blank is clamped at movable blank holder. The starting operations directed at three distinct temperatures (Room temperature, 150°C, 300°C). At the point when sheet metal is formed, It is subjected to uniform strains and many prompt wrinkling or crack in the formed specimen. The forming procedure causes the line patterns to disfigure by a sum which relies upon the neighbourhood twisting experienced by the sheet metal. After the sheet metal is shaped, the circles will turn into an oval unless disfigurement is unadulterated
The longest measurement of the circle is the major axis and the measurement opposite to the major axis is called the minor axis. Estimation of major and minor axes of extended circles is measured by using Tools makes microscope can see i
By measuring the change in circle due to deep drawing i.e. Major and minor axis, figuring the estimations of real strain and minor strains, plotted FLD OF AA6061
experimental setup shown in figure
Fig 2 Hydraulic deep drawing
Fig 3 Die with heater setup
T6 Sheet Metal At Elevated Temperatures
The longest measurement of the circle is the major axis and the measurement opposite to the major axis is called the minor axis. Estimation of major and minor axes of extended circles is measured by using Tools makes microscope can see it in Fig.2. By measuring the change in circle due to deep drawing i.e. Major and minor axis, figuring the estimations of real strain and minor strains, plotted FLD OF AA6061-T6. The experimental setup shown in figure 2.
Hydraulic deep drawing machine
International Journal of Recent Scientif
Fig 4 Drawn cups with different thickness
RESULTS AND DISCUSSION
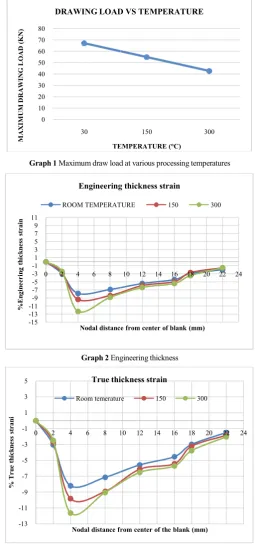
A total of 27 experiments are performed and the results were plotted from Graph 1 to Graph 11.
From graph 1 It can be observed that
forming load is decreased at full draw when the processing temperature is increased. This is due to the flow stress decrees and ductility increases when the temperature is increased.
From graph 2 and graph 3. It can be observed that the maximum thinning occurs in the deep drawn cup at the punch corner radius region due to this region is subjected to biaxial tensile stress. The thickness variation at the bottom of the cup is negligible at all temperatures and it indicates no cold work is done at this region. The reduction of the thickness at the cup bottom decreases as the temperature is increasing. The effect of thinning increases at all temperatures and the temperature increases at 150°C, and subsequently, it decreases on increasing the temperature. This is due to flow stress is decreased as the temperature is increased.
From graph 4 and graph 5. It can be observed that the percentage of radial strain variation at the bottom of the cup is negligible at all temperatures it is due to no cold work done at this region. The radial strain increases as the temperature is increased and the maximum variation in radial strain is observed at the bottom of the cup. As the temperature increased the radial strain decreased at all temperatures and then subsequently, decreases on increasing the temperatures. This is due to the easy flow of metal as the temperature is increased.
From graph 6 and graph 7. It can be observed that the percentage of hoop strain variation at the bottom of the cup is negligible at all temperatures it is due to no cold work is done at this region. The hoop strain is decreased as the temperature increased. As the temperature is increased, the hoop strain decreases at all tempera 150°C, and then decreases on increasing the temperatures. This is due to the easy flow of metal as the temperature is increased and also the required load to cause this flow is decreased.
From the above graph 8 to graph 11, FLD can be observed to a curve of the major and minor strains. The right side of forming limit diagram, which is indication for positive major and minor strains. The left side of forming limit diagram indicates pertinent for positive major and negative minor strains. From the graph 8 we can observe forming limit diagram for 1mm thickness with two different diameter specimens, in this we can clearly see that safe zone, neck zone and unsafe zone. As we increase the thickness of the test specimen it can observe that fld limit is increasing from 1mm sheet to 2mm sheet we can see this variation in graph 11. It can be seen that from the graph 10 to 11Forming limit diagrams that thickness of specimen impacts forming utmost curves of AA6061. Identified that the optimum forming thickne
experiment, the FLD curves are shifted up significantly along themajor strain axis. By increasing the thickness of the specimens the formability is increasing.
International Journal of Recent Scientific Research Vol. 10, Issue, 07(D), pp. 33555-33561
Drawn cups with different thickness
A total of 27 experiments are performed and the results were
From graph 1 It can be observed that the maximum forming load is decreased at full draw when the processing temperature is increased. This is due to the flow stress decrees and ductility increases when the From graph 2 and graph 3. It can be observed that the maximum thinning occurs in the deep drawn cup at the punch corner radius region due to this region is subjected to biaxial tensile stress. The thickness variation at the at all temperatures and it indicates no cold work is done at this region. The reduction of the thickness at the cup bottom decreases as the temperature is increasing. The effect of thinning increases at all temperatures and the temperature 0°C, and subsequently, it decreases on increasing the temperature. This is due to flow stress is decreased as the temperature is increased.
From graph 4 and graph 5. It can be observed that the percentage of radial strain variation at the bottom of the p is negligible at all temperatures it is due to no cold work done at this region. The radial strain increases as the temperature is increased and the maximum variation in radial strain is observed at the bottom of the cup. As the radial strain decreased at all temperatures and then subsequently, decreases on increasing the temperatures. This is due to the easy flow of metal as the temperature is increased.
From graph 6 and graph 7. It can be observed that the rain variation at the bottom of the cup is negligible at all temperatures it is due to no cold work is done at this region. The hoop strain is decreased as the temperature increased. As the temperature is increased, the hoop strain decreases at all temperatures at 150°C, and then decreases on increasing the temperatures. This is due to the easy flow of metal as the temperature is increased and also the required load to
From the above graph 8 to graph 11, FLD can be observed to as a curve of the major and minor strains. The right side of forming limit diagram, which is indication for positive major and minor strains. The left side of forming limit diagram indicates pertinent for positive major and negative minor e graph 8 we can observe forming limit diagram for 1mm thickness with two different diameter specimens, in this we can clearly see that safe zone, neck zone and unsafe zone. As we increase the thickness of the test increasing from 1mm sheet to 2mm sheet we can see this variation in graph 11. It can be seen that from the graph 10 to 11Forming limit diagrams that thickness of specimen impacts forming utmost curves of AA6061. Identified that the optimum forming thickness for this experiment, the FLD curves are shifted up significantly along themajor strain axis. By increasing the thickness of the
Graph 1 Maximum draw load at various processing temperatures
Graph 2 Engineering thickness
Graph 3 0 10 20 30 40 50 60 70 80 30 M AXI M UM DRAWI NG L OAD (KN) TEMPERATURE (
DRAWING LOAD VS TEMPERATURE
-15 -13 -11 -9 -7 -5 -3 -1 1 3 5 7 9 11
0 2 4 6 8
%En gin eer in g th ick n e ss strain
Nodal distance from center of blank (mm)
Engineering thickness strain
ROOM TEMPERATURE -13 -11 -9 -7 -5 -3 -1 1 3 5
0 2 4 6 8 10
% Tr u e th ick n es s stran i
Nodal distance from center of the blank (mm)
True thickness strain
Room temerature
33561, July, 2019
Maximum draw load at various processing temperatures
Engineering thickness
True thickness
150 300
TEMPERATURE (°C)
DRAWING LOAD VS TEMPERATURE
10 12 14 16 18 20 22 24
Nodal distance from center of blank (mm)
Engineering thickness strain
ROOM TEMPERATURE 150 300
10 12 14 16 18 20 22 24
Nodal distance from center of the blank (mm)
True thickness strain
Naveen. Y et al., Experimental Analysis To Predict The Formability of Aluminium AA6061-T6 Sheet Metal At Elevated Temperatures
Graph 4 Engineering Radial strain
Graph 5 True Radial strain
Graph 6 Engineering Hoops strain
0 2.4
3.8
20.2
16.2
12
9
4.6
0 2
3.6
18
9.8 10
8.2
2.4
0 1.8
2.4
16
6.8 6.6
4.4
2
0 5 10 15 20 25
0 5 10 15 20 25
%
En
gin
eer
ing
radial
strain
Nodal distance from center of the blank (mm)
Engg. Radial strani vs Nodal distance
room temperature
150
300
0
2.371 3.729
18.39
15.01
11.33
8.6177
4.49
0
1.98026 3.536
16.55
9.349 9.531
7.8811
2.3716
0
1.7833 2.371
14.84
6.57 6.39
4.305
1.9802
0 2 4 6 8 10 12 14 16 18 20
0 5 10 15 20 25
%Tr
u
e
radial
strain
Nodal distance from center of the blank (mm)
True radial radial strain vs nodal distance
room temperature
150
300
0
-0.6
-10
-18
-20.2 -16
-11.6
0 -0.4
-8
-16
-16.8
-14.2
-8.2 0
-0.2
-6.4
-15
-16.4
-11.4
-7.6
-25 -20 -15 -10 -5 0 5
0 2 4 6 8 10 12 14 16 18 20 22 24
%
en
gin
eer
ing
h
o
o
ps
strain
Nodal distane from center of blank (mm)
Engg. Hoops strain vs nodal distance
room temperature
150
International Journal of Recent Scientific Research Vol. 10, Issue, 07(D), pp. 33555-33561, July, 2019
Forming Limit Diagram
Specimens were sheared from the aluminium sheet metal AA6061-T6 with a thickness of 1mm,1.5mm, and 2mm, with a diameter of 105mm and 110mm. All specimens were marked with circles by using electronic discharge machining, with circle of 5mm diameter. And were formed up to the point of fracture using the hydraulic press. Sheet specimens were subjected to different states of strain namely tension plane strain and tension-compression because of the varying width. During formation, the circles were distorted to ellipses. A Tools maker microscope (Computer operated) with an accuracy of 0.01 mm was used to measure dimensions of the ellipses. The true major strain and the true minor strain were calculated using the formulae as
True major strain = ln (Final D major/ original diameter) True minor strain = ln (Final D minor/ original diameter) The true major strain and the true minor strain were measured in the necked region, the fractured region and the safe region. The forming limit diagram was drawn using the true minor strain on abscissa and the true major strain on the ordinate. The safe region was identified by drawing a curve using the strain values obtained in the necked region. The strain states above the curve represent failure. The strain states below the curve represent the safe region.
Forming Limit Diagrams for the different thickness and different diameters of blanks are as follows.
Graph 8 FLD for 1mm Thick sheet
Graph 9 FLD for 1.5mm thick sheet
Graph 10 FLD for 2mm Thick sheet Graph 7 True Hoops strain
0 -0.6018
-10.536
-19.845
-22.5646 -17.435
-12.3298
0 -0.40008
-8.338
-17.435
-18.392 -15.315
-8.555 0
-0.2002
-6.613
-16.2518 -17.91266
-12.1038
-7.90432
-25 -20 -15 -10 -5 0 5
0 2 4 6 8 10 12 14 16 18 20 22 24
%
Tu
re
h
o
o
ps
strain
Nodal distance from center of blank(mm)
True hoops strain vs nodal distance
room temperature
150
Naveen. Y et al., Experimental Analysis To Predict The Formability of Aluminium
Graph 11 Combined FLD
CONCLUSON
The chemical composition of the AA6061
reveals that high Mg concentration and low Mn, Si and Fe concentrations, it results in better formability compared to other series of aluminium alloys. The results also shown that the 2mm thick AA6061 has the highest major limiting strain at a particular minor strain for the tension-tension, plane strain and tension compression strain states therefore, the workability range of this sheet metal is good. In forming of sheet metal, the AA6061-T6 sheets exhibited higher limit strains at 300 the 1500C and room temperature. As the temperature increases we can observe good formability with low application of load. As thickness increases the level of FLD increases up to 2mm, identified that at the forming thickness1mm,1.5mm and 2mm, the FLD curves are shifted up significantly along the major strain axis. After experimentation on AA6061
drawing, it can be concluded that the working temperature working thickness of AA606-T6 material is between 150 3000C and 1.5mm to 2mm for producing quality products and smooth operations for AA6061-T6 materials.
Acknowledgmen
The authors would like to thank the University Grant Commission, India, as the present work is carried out as a part of UGC-MRP [MRP-6754/16 (SERO/UGC)].
References
1. M. Kleiner, M. Geiger, A. Klaus; “Manufacturing of Lightweight Components by Metal Forming”; CIRP annals; Manufacturing technology, volume
2003; pp- 521-542.
2. G. Palumbo, L. Tricario. Numerical and experimental investigations on the warm deep drawing process of circular aluminum alloy specimens. J. Mater. Process. Technol 184 (2007) 115-123.
3. TigramAbovyan, Ghassan, T. Kridli; Peter, A Friedman; Georges Ayoub (2015), Formability Prediction of aluminium sheet alloy under Isothermal Forming Conditions. Journal of Manufacturing Process
413.
Experimental Analysis To Predict The Formability of Aluminium AA6061-T6 Sheet Metal At Elevated Temperatures
The chemical composition of the AA6061-T6 sheet metal reveals that high Mg concentration and low Mn, Si and Fe concentrations, it results in better formability compared to alloys. The results also shown that the 2mm thick AA6061 has the highest major limiting strain at tension, plane strain and tension compression strain states therefore, the workability good. In forming of sheet metal, the T6 sheets exhibited higher limit strains at 3000C then C and room temperature. As the temperature increases we can observe good formability with low application of load. f FLD increases up to 2mm, identified that at the forming thickness1mm,1.5mm and 2mm, the FLD curves are shifted up significantly along the major strain axis. After experimentation on AA6061-T6 deep drawing, it can be concluded that the working temperature and T6 material is between 1500C to C and 1.5mm to 2mm for producing quality products and
T6 materials.
The authors would like to thank the University Grant the present work is carried out as a part 6754/16 (SERO/UGC)].
M. Kleiner, M. Geiger, A. Klaus; “Manufacturing of Lightweight Components by Metal Forming”; CIRP annals; Manufacturing technology, volume-52 issue-2; G. Palumbo, L. Tricario. Numerical and experimental investigations on the warm deep drawing process of circular aluminum alloy specimens. J. Mater. Process. TigramAbovyan, Ghassan, T. Kridli; Peter, A Friedman; Ayoub (2015), Formability Prediction of aluminium sheet alloy under Isothermal Forming Journal of Manufacturing Process 20;
406-4. Ravikumar, D.; Swaminathan, K. (2013), Formability of two aluminium alloys. Material science and Technology, 15:11, 1241-1252.
5. W. Miller, S. Zhuang, L. Bottema, J. Wittebrood, Recent development in aluminium alloys for the automotive Industry,
Engineering: A, vol. 280, no. 1, 2000, pp.37
6. Cunsheng Zhang, Xingrong Chu, Dominique Guin Lionel Leotoing, Jie Ding,
strain rate on the forming limit curves of AA5086 sheet, ‖ Procedia Engineering, vol.81, 2014, pp.772
7. Ahmetoglu.M.; Broek. T.R.; Kinzel, G; Altan. T:
Control of blank holder force to eliminate wrin
fracture in deep-drawing rectangular parts. CIRP Ann. Manuf. Technol. 44, 247
8. Ahmadi.S,
Experimental and analytical studies on the prediction of forming limit diagrams.
Materials science 44, 1252
9. Venkateswarlu, G.; Davidson, M.J.; Tagore, G.R.N.:
Influence of process parameters on the cup drawing of aluminium 7075 sheet.
41–49 (2010).
10. A. C. Reddy, T. Kishen Kumar Reddy and M. VidyaSagar, Experimental characterization of warm deep drawing process for EDD steel, International Journal of Multidisciplinary Research & Advances in Engineering, vol.4, no.3, pp.53
11. FahrettinOzturk, Murat Dilmec, MevlutTurkoz, Re E. Ece, Huseyin S. Halk
Measurement Methods for Sheet Metal Formability, Design and Production of Machines and DIES/MOLDS, 2009, pp.18-21.
12. A. R. Joshi, K. D. Kothari, Dr. R. L. Jhala, “Effects Of Different Parameters On Deep Drawing Process”; International Journal of Engineering Research & Technology (IJERT) Vol. 2 Issue 3, March
2278-0181.
13. Y.S. Lee, M.C. Kim, S.W. Kim, Y.N. Kwon, S.W. Choi, J.H. Lee. Experimental and analytical studies for forming limit of AZ31 alloy on warm sheet metal forming. J. Mater. Process. Technol 187 (2007) 103 14. Picu, R. C.; Vincze, G.; Ozturk, F. (2005), Strain rate
sensitivity of the commercial aluminium alloy AA5182.0 Materials Science and Engineering A390; 334-343.
15. Kleemola, H.J.; Kumpalainen, J.O. (2013), Form of aluminium and steel sheets.
Technology, 159-162
16. FahrettinOzturk, Murat Dilmec, MevlutTurkoz, Remzi E. Ece, Huseyin S. Halk
Measurement Methods for Sheet Metal Formability, Design and Production of Machine
2009, pp.18-21.
17. Eshwara K. Prasad, R. Raman Goud, Swadesh Kumar Singh, N. Sateesh, - Construction of Strain Distribution Profiles of EDD Steel at Elevated Temperatures, International Journal of Chemical, Molecular, Nuclear, Materials and Metallurgical Engineering
pp.1329-1335.
T6 Sheet Metal At Elevated Temperatures
Ravikumar, D.; Swaminathan, K. (2013), Formability of two aluminium alloys. Material science and Technology, W. Miller, S. Zhuang, L. Bottema, J. Wittebrood, -Recent development in aluminium alloys for the automotive Industry, ‖ Materials Science and Engineering: A, vol. 280, no. 1, 2000, pp.37-49.
Cunsheng Zhang, Xingrong Chu, Dominique Guines, Lionel Leotoing, Jie Ding,-Effects of temperature and strain rate on the forming limit curves of AA5086 sheet,
gineering, vol.81, 2014, pp.772-778.
Ahmetoglu.M.; Broek. T.R.; Kinzel, G; Altan. T: Control of blank holder force to eliminate wrinkling and drawing rectangular parts. CIRP Ann.
, 247–250 (1995).
Eivani.AR.,Akbarzadeh.A.,2009. Experimental and analytical studies on the prediction of forming limit diagrams. Journal of Computational
44, 1252-1257
Venkateswarlu, G.; Davidson, M.J.; Tagore, G.R.N.: Influence of process parameters on the cup drawing of
aluminium 7075 sheet. Int. J. Eng. Sci. Technol. 2(11),
A. C. Reddy, T. Kishen Kumar Reddy and M. Experimental characterization of warm deep drawing process for EDD steel, International Journal of Multidisciplinary Research & Advances in Engineering, vol.4, no.3, pp.53-62, 2012.
International Journal of Recent Scientific Research Vol. 10, Issue, 07(D), pp. 33555-33561, July, 2019
18. A. Chennakesava Reddy, “Evaluation of local thinning during cup drawing of gas cylinder steel using isotropic criteria,” International Journal of Engineering and Mate-rials Sciences, vol.5, pp.71-76, 2012.
19. A Review on Deep Drawing Process D Swapna, S Radhika International Journal of Emerging Research in Management and Technology 6 (6), 146-149, 2018 20. Yamuna, B., Reddy, A. C. Parametric Merit of Warm
Deep Drawing Process for 1080A Aluminium Alloy: Validation through FEA, International Journal of Scientific & Engineering Research, 6(4), 2015, pp. 416-424.
How to cite this article:
Naveen. Y et al., 2019, Experimental Analysis To Predict The Formability of Aluminium AA6061-T6 Sheet Metal At Elevated Temperatures. Int J Recent Sci Res. 10(07), pp.33555-33561. DOI: http://dx.doi.org/10.24327/ijrsr.2019.1007.3693