Psychology: Journal Articles (Peer-Reviewed) Psychology
2005
Measuring perceptual and motivational facets of
computer control: The development and
validation of the computing control scale
John P. Charlton
University of Bolton, [email protected]
Digital Commons Citation
Charlton, John P.. "Measuring perceptual and motivational facets of computer control: The development and validation of the computing control scale." (2005).Psychology: Journal Articles (Peer-Reviewed).Paper 1.
Measuring Perceptual and Motivational Facets of Computer Control:
The Development and Validation of the Computing Control Scale
John P. Charlton
Bolton Institute, UK
Correspondence should be addressed to John P. Charlton, Department of Psychology
and Life Sciences, Bolton Institute, Deane Road, Bolton, BL3 5AB, Lancs, UK.
Abstract
The Computing Control Scale (CCS), a new factor analytically derived
psychometric instrument is developed. The CCS consists of Computing Autonomy
and Computing Need for Control subscales. Computing autonomy represents a
composite of confidence in controlling computers and self-reliance when using
computers. Computing need for control is considered to represent a domain-specific
analog of Burger’s (e.g. 1992) global desire for control construct. The factor structure
of the instrument is shown to be replicable. Also, the two subscales are shown to be
reliable and to exhibit construct validity in terms of their differential relationships
with other concepts such as computer comfort - anxiety, computer addiction and
non-domain-specific desire for control. In addition, the data collected shows that few
people attribute computing-related outcomes to luck or chance and indicates that the
vast majority of people believe that in principle such outcomes are within their
control. It is therefore concluded that attempts to measure computing-specific locus of
control using a factor analytically derived instrument may not be viable.
Keywords: Internal External Locus of Control; Needs; Self Efficacy;
1. Introduction
Much research into individual differences in computing behavior and attitudes has
used locus of control as a predictor. Results of this research have been mixed, effects
sometimes being identified and sometimes not. Studies have used general measures of
locus of control rather than computing-specific measures, and this might partially
account for the failure to find effects in some studies. One aim of the present research
then, was to develop a computing-specific locus of control measure. Locus of control
concerns people’s perceptions of whether there is a contingency between one’s
actions and outcomes. Another type of perceptual control construct involves whether
people perceive that they have the ability to perform behaviors and thereby control
outcomes. Psychologists construe such perceptions in terms of self-efficacy or
confidence. Although measures of computing self-efficacy / confidence exist, items in
the measures do not explicitly deal with control issues. A second purpose of the
present project was to remedy this. A final aspect of the present work aimed to
develop a measure of need for control over computers. Rather than involving
perceptions of control, this construct involves motivation to control. This issue has
been neglected in the computing literature, but is likely to be of major importance in
relation to computer-related stress and addiction.
In the following three sections, each conception of control is considered along with
its applicability to computing behavior and attitudes, and the way in which it was
taken into account in developing the presently constructed instrument.
1.1 Locus of control
The concept of locus of control (Rotter, 1966) sprang from Rotter’s social learning
theory in which the potential for a behavior to occur is considered to be a function of
one’s expectancy (subjective probability) that a given reinforcement will occur as a
result of the behavior and the value one attaches to that reinforcement. Expectancies
can be either specific to a particular situation or more generalized with a gradient
between the two (Rotter, 1990). Locus of control involves a generalized expectancy
concerning the extent to which environmental reinforcement tends to be contingent
upon one’s own efforts and behaviors (internal control expectancy) or upon external
influences such as chance, luck and powerful others (external control expectancy)
(Rotter, 1990). Thus, externals entertain low subjective probabilities that a particular
reinforcement (e.g. success on a task) will result from their behavior, while the
subjective probabilities of internals in this respect are higher. Because of these
differences in expectancy, people with internal control expectancies are more highly
motivated to master their environment since they believe that their efforts are likely to
lead to positive outcomes (Phares, 1976). In contrast, externals are less highly
motivated towards environmental mastery because they perceive that their efforts
have little influence on outcomes. Thus, internals and externals have been found to
differ with respect to a host of mastery-related variables: information seeking,
expression of a willingness to remedy personal inadequacies, persistence in giving up
smoking, learning, utilization of knowledge etc. (Phares, 1976).
With respect to computing behavior and attitudes, the above suggests that internals
Much work has tested such hypotheses since negative attitudes towards computing in
general, and computer anxiety in particular, are seen as potentially damaging to an
individual’s educational and wider life chances. While some studies have shown
greater externality of locus of control to be positively related to anxiety, and / or
negatively related to attitudes (e.g. Coovert & Goldstein, 1980; Igbaria &
Parasuraman, 1989; Hoffman, Novak and Schlosser, 2000; Potosky and Bobko,
2001), null findings are common (Hawk, 1989; Howard & Smith, 1986; Crable,
Brodzinski, Scherer & Jones, 1994; Anderson & Hornby, 1996), and on occasion the
direction of the relationship is even reversed (Woodrow, 1990).
The work of Hoffman et al. (2000) is of particular interest since it shows that
contemporary work involving locus of control fits in with the observation that
findings from studies of Internet-related behavior and attitudes reflect patterns often
seen in the older literature concerning computer attitudes in general (Durndell &
Hagg, 2002). Hoffman and her colleagues used Levenson’s (e.g. 1981) Internality,
Powerful Others and Chance (IPC) Scales in which internality and externality are
viewed as independent and in which there are two externality subscales. They found
that earlier adopters of Internet technology were characterized by greater internality,
and lower expectancies regarding outcomes being largely determined by powerful
others or chance (both external dimensions). Similar results were found with respect
to feelings of comfort with computers in general, and, for internality and external
powerful others, comfort with respect to the Internet in particular. The Internet-related
results supported the idea that internals adopted the technology more quickly because
it allows them to exert direct (primary) control over their environment (note though
positively related to greater Internet usage in terms of hours per day. This supported
the idea that individuals with such beliefs use the Internet in an ‘experiential’ manner:
for leisure activities such as chat, entertainment, etc. Other findings included the
observation that greater internality was associated with usage of the Web for less
instrumental, more goal-directed, activities such as shopping, researching, seeking
information on home products, etc. This is consistent with the tendency of internals to
engage in greater information seeking (Phares, 1976).
There is a long-standing assumption by major locus of control researchers that
domain-specific locus of control measures should provide better prediction in a
particular domain than more general global measures (Lefcourt, 1991). Thus, while
the early general measures of locus of control (e.g. Rotter, 1966; Levenson, 1981), are
still in use, these measures have been supplemented by domain-specific measures for
research in areas such as health, aging, alcoholism and academic achievement and
affiliation (see Lefcourt, 1981). The failure of the early literature on locus of control
and computing attitudes to demonstrate robust relationships and the present surge in
research using locus of control to predict Internet-related behavior provided much of
the impetus for the present attempt to design a computing-specific locus of control
scale. No such attempt appears to be recorded in the literature despite the large
amount of attention paid to non-domain-specific locus of control as a possible
predictor of computing variables.
Generation of locus of control items for the present instrument took cognizance of
the structure of Levenson’s (e.g. 1981) IPC Scales. Internal items involved the ideas
that the success of one’s interactions with computers is dependent upon ability and
others. The latter items were split into two areas: humans as powerful others and
computers as powerful others. The first of these reflected the traditional locus of
control literature. The second took account of the possibility that the interactive nature
of computing could lead to the perception that some outcomes were attributable to the
unpredictable nature of computers and their software, irrespective of design features
built into systems by human powerful others.
Because the results of the factor analytic process necessitated reformulation of
hypotheses intended to validate a locus of control subscale emerging from the present
analyses, development of these hypotheses is left until the Results section.
1.2 Perceived self-efficacy / confidence in controlling computers
In addition to locus of control, self-efficacy is another important control-related
concept in social learning theory (or latterly social cognitive theory - Bandura, 1991,
1997). Whereas locus of control involves beliefs that outcomes are in principle within
or without one’s control, perceived self-efficacy constitutes a conception of control in
the form of whether one perceives that one has control over whether one can perform
a certain behavior in terms of having the requisite ability (Ajzen, 2002). Perceived
inability to control computers has been cited as a major reason for ‘technophobia’
(Hill, Smith & Mann, 1987).
Research shows that locus of control and self-efficacy beliefs are largely
independent of each other (Bandura, 1997). Feelings of self-efficacy coupled with
one’s efforts in mastering an activity (Bandura, 1991). Applying Bandura’s (1997)
observations to the domain of computing and considering circumstances in which an
individual believes that they cannot control computers (i.e. has negative computer
self-efficacy) then if this is coupled with a belief that computing outcomes are not
personally determined (external locus of control) one will experience resignation or
apathy with respect to mastering computers. On the other hand, if one has negative
computer efficacy but believes that computing outcomes are personally determined
(internal locus of control) one will experience self-devaluation or despondency with
respect to one’s computing efforts. Neither of these two combinations is likely to lead
to attempts to master computers. Turning to positive self-efficacy, if one believes that
one can control computers and believes that computing outcomes are personally
determined, then one will be productively engaged with computers. (It is not clear
what would be expected where positive computer self-efficacy beliefs are paired with
an external locus of control).
Research on perceived computing self-efficacy conducted during the 1980s showed
males to exhibit more positive self-efficacy perceptions than females (Miura, 1987;
Murphy, Coover & Owen, 1989). Also, Hill et al. (1987) showed perceived
self-efficacy to predict enrollment in computer-related courses irrespective of the
perceived instrumentality of enrolling, and that perceived self-efficacy was related to
previous computing experience and usage of electronic technologies other than
computers. More recent work has confirmed the continuing existence of a sex
difference in perceived self-efficacy, its relationship with computing experience and
with previous attendance on a computer training course (Cassidy & Eachus, 2002).
situation at different levels of complexity within the domain. However, Cassidy and
Eachus (2002) argued that the advent of graphical user interfaces (GUIs), and in
particular the ubiquity of Windows environments, has made some of the computing
self-efficacy scales used in 1980s research obsolete since many of the computing
tasks mentioned were associated with different types of computing package and GUIs
have rendered many of the tasks associated with packages the same. The
aforementioned authors therefore produced what they considered to be a general
domain-specific measure of perceived computer self-efficacy, including items which
were non-task-specific and which did not represent differing levels of complexity.
Despite the fact that computer self-efficacy has been defined in terms of
expectations as to whether one can control computers (Hill et al., 1987), neither the
instruments developed during the 1980s nor that of Cassidy and Eachus (2002) had a
specific focus upon controllability. However, the relevant items included in the
present instrument were focused upon this construct. To render them similar to other
items in the instrument under construction, the items aimed to tap perceptions of
computers’ controllability in general, rather than controllability associated with
specific computing tasks. In this respect then, they had something in common with the
items of Cassidy and Eachus (2002). But, given that the present items did not measure
perceived capabilities in controlling computers across several types of computing
situation at different levels of complexity as demanded by Bandura (1997), despite the
lead given by Cassidy and Eachus (2002), the idea that these items constituted a
prospective measure of perceived self-efficacy in controlling computers was avoided.
Instead, it was considered more reasonable to conceive of them as measuring
controlling computers without contravening Bandura’s strictures on the content of
self-efficacy measures. The idea that computer confidence and perceived computer
self-efficacy are highly similar is supported by the occasional synonymous usage of
these two terms by both Cassidy and Eachus (2002) and Brosnan (1998). Also,
equating self-efficacy beliefs with confidence in one’s capacity to carry out a behavior
is said to be consistent with Bandura’s conception of self-efficacy (Ajzen, 2002).
As for the locus of control subscale, the results of the factor analytic process made
it necessary to reframe hypotheses aimed at validating a possible confidence in
controlling computers subscale. Therefore, again, development of these hypotheses is
left until the Results section.
1.3 Need for control
In addition to attempting to develop measures of perception of control in the
domain of computing (indices of computing locus of control and confidence in
controlling computers), the present research also aimed to develop a measure of
computing need for control: an index of motivation to control computers. As far back
as 1980, Shneiderman emphasized that desire for control is an important factor in
people’s interactions with computers. However, the importance of this factor in the
design of interfaces and other software is likely to differ across individuals according
to how strong their desire for control is.
One researcher active in the area of control motivation is Burger who has developed
DC Scale scores displaying reasonable relationships (absolute correlations in the
range .36 to .46) with scores on all three dimensions (Internal, External Powerful
Others and External Chance) of Levenson’s (1981) IPC Scales (Burger, 1984). This
seems reasonable in that people who have a high desire for control are likely to make
persistent attempts to influence outcomes and these attempts are likely to be
successful at least some of the time. On the other hand, the attempts of people low in
desire for control to influence outcomes are likely to be less frequent, and such people
will therefore have fewer opportunities to learn that outcomes are likely to be
contingent upon their actions. Even when the latter type of person does make an
attempt to control outcomes, in many instances they will do so in a more half-hearted
manner and their attempts at control will therefore be less successful than those of the
high DC person, thereby reinforcing an external control expectancy.
In spite of the relationship between desire for control and locus of control, the
distinction between these two constructs has proven to be of empirical use. For
example, people high in desire for control, low in internality and with a belief that
outcomes are determined externally by chance and powerful others are more likely to
seek help from others when they have a depressing problem than other types of
individual classified by their joint scores on locus of control and desire for control
measures (Burger, 1992). Thus, given the utility of the desirability of control
construct, Burger and other researchers have used the DC scale in investigations of
behavior across a wide range of situations (e.g. social interaction, academic
performance, sexual behavior, health-related behavior and gambling behavior – see
Burger [1992] for a review). Also, just as happened with locus of control instruments,
instruments such as those measuring desire for control in the workplace and control
over dental treatment (Burger, 1999).
Desirability of control is viewed largely as a positive attribute by Burger and
Cooper (1979). People high on this personality dimension are ‘…assertive, decisive
and active’, seek to ‘…influence others…’, prefer ‘…to avoid unpleasant situations or
failures by manipulating events to ensure desired outcomes’ and seek ‘…leadership
roles in group situations.’ (quotations from Burger & Cooper, 1979, p.383). Likewise,
computing-specific need for control is likely to have advantages, the day by day quest
for control over computers being likely to lead to greater computing proficiency and
knowledge. However, there is also likely to be a down side.
In general, ‘… computer users come to expect rapid performance … and a high
degree of control…’ (Shneiderman [1998], p.593, citing the 1984 writings of Brod). A
computer’s failure to meet these expectations of rapid performance and control is
likely to result in frustration with resultant anger and stress. For example, Wallace
(1999) noted that slow download times are a major complaint among Internet users,
and this is likely to be particularly true for people with a high need for control over
computers. It is also easy to conceive of other computing situations in which a high
need for control is likely to lead to extreme frustration: situations where in principle
computers should be controllable but where in practice they are not. Such situations
include erratic cursor control resulting from malfunctioning mice, computers crashing
and hanging, autocorrect and autoformatting features of software making unwanted
changes to documents, and non-optimal response times resulting from computer
So, the present research effort aimed to develop a computing-specific measure of
control motivation since, although such a scale would constitute a useful research
tool, no such instrument appears to exist.
The need for control items included in the pool of items for the present
questionnaire were intended to represent a computing-specific form of Burger’s
general Desirability of Control measure. The items tapped motivational issues
surrounding both satisfaction obtained from getting computers to do what one wants
them to and the general desire to have as much control as possible over computers
when using them. Additionally, items involving self-reliance were included. These
items sought to tap the extent to which individuals were willing to rely upon their own
efforts in seeking to control computers or to rely upon others. This reflected Burger’s
(1992) observation that factor analysis of DC scale responses revealed an Avoidance
of Dependence factor among others, and it was envisaged that including items tapping
computing self-reliance should make the resultant instrument useful for educational
and vocational research.
In validating the present Need for Control subscale it was assumed that the
possibility of exerting a high degree of control over one’s environment, which
computing affords, would result in a positive relationship between computing need for
control scores and computer addiction scores. This reflects the observation that a high
need for control can be an important part of the psychological make-up of computer
addicted or dependent people (Weizenbaum, 1984; Shotton, 1989; Levy, 1994). As a
domain-specific measure of need for control it was also hypothesized that computing
need for control would exhibit a moderate positive relationship with scores on Burger
Of the three types of Levenson locus of control score, internality displays the
greatest absolute relationship with DC scores (Burger, 1984; 1992). It was therefore
expected that the magnitude of the positive correlation between computing need for
control and internality would be greater than the negative correlations between
computing need for control and the Powerful Others and Chance scores. Although
Burger gives no reason why Internality scores should exhibit the highest correlation
with DC scores, the observation that highly internal people experience greater stress
in uncontrollable situations than in controllable situations (Franken, 1998) suggests
that they are generally characterized by high need for control and provides a partial
rationale for the present hypothesis.
In summary, the present project aimed to use factor analytic methods to develop a
psychometric instrument measuring the three computer-related conceptions of control
discussed above. On derivation of factorially valid subscales, studies of replicability,
reliability and validity were undertaken.
2. Method
2.1 Design
The initial pool of items for the Computing Control Scale (CCS) consisted of 60
items falling into six broad classes on an a priori basis: Internal Causality (Effort and
Ability), Chance/Luck/Fate and Powerful Others (both Humans and Computers) as
Self-Reliance. Within each of these categories and subcategories an attempt was made
to keep a balance between positively and negatively phrased items.
Items were phrased in the first person rather than the third person. This was
identified by Levenson (1981) as one important difference between her scale and that
of Rotter (1966), and seems a reasonable approach since it ensures that an instrument
will tap an individual’s personal control perceptions and motivations. The instrument
aimed to tap conceptions of control as they apply to computer users, and therefore
most of the items were focused upon perceptions and motivations while using
computers. This makes the instrument suitable for use only with people having
computing experience, although such experience may be minimal.
The same six-point Likert scaling procedure as that adopted by Levenson was
adopted, people responding on a numerical scale of -3, -2, -1, +1, +2 and +3
corresponding to labels of Strongly Disagree, Moderately Disagree, Slightly Disagree,
Slightly Agree, Moderately Agree and Strongly Agree respectively. Here, an even
number of choice options prevents the choice of a middle placed neutral option as a
response set.
The project consisted of a number of phases. Subsequent to initial screening of
items, exploratory factor analyses were performed. The resultant factor structure was
then cross-validated and measures of subscales’ internal consistency and test-retest
reliability were obtained. Finally, the CCS subscales were subjected to validation
2.2 Respondents
In total, 233 people (143 females and 90 males, age range = 18 to 64 years, mean
age = 38.95 years, SD = 12.28 years, with missing age data for 12 people) formed the
development sample. Respondents included 173 members of academic, administrative
and technical staff working at a higher education institution in the north of England,
and 55 undergraduate and postgraduate students at the same institution (occupational
data was missing for 5 respondents). Inclusion of these different types of individual
helped to ensure heterogeneity of the sample so as to maximize variability in the
responses obtained, which is an important pre-requisite for an adequate factor analysis
(Kline, 2000).
Subsequent to its derivation, the final version of the questionnaire was
cross-validated using a sample of 203 undergraduate and postgraduate students studying
either Psychology, Tourism Management or Business. These respondents consisted of
151 females and 48 males (gender of 4 unknown) in the age range 18 to 57 years
(mean = 25.91 years, SD = 8.60 years, age unknown for 7 respondents).
Test-retest reliability was determined using a subsample of 43 students from the
cross-validation sample. These students were all on modular undergraduate degree
courses involving some study of psychology. The sample consisted of 32 females and
11 males in the age range 18 to 52 years (mean = 26.98 years, SD = 8.66 years, age
data missing for 1 respondent).
All respondents had some experience of using computers (see Design and
Procedure). Given the nature of the development sample, it is probable that the
considered desirable as it facilitates use of the final instrument with a wide range of
computer users.
2.3 Materials
Four instruments were used to assess the validity of the CCS subscales. The first
validation instrument was a version of the Computer Apathy and Anxiety Scale
(CAAS; Charlton & Birkett, 1995) revised by Charlton (1999, 2002) to include a
Computer Addiction subscale, and referred to here as the CAAS-R. This 33 item
instrument contains three subscales measuring computer anxiety – comfort (13 items),
computer apathy – engagement (8 items) and computer non-addiction – addiction (12
items), with high scores indicating a greater orientation towards computers. Items
consist of positively and negatively worded statements. People respond to these items
on a 5-point Likert-type scale ranging from Strongly Disagree to Strongly Agree.
Only the scales measuring anxiety - comfort and non-addiction - addiction were
involved in the present validation analyses.
The Internality, Powerful Others and Chance Scales (Levenson, e.g. 1981) were
used as a second validation instrument. As mentioned in the Introduction, this is a
general locus of control scale with subscales measuring expectancies on the three
eponymous dimensions, the second two of which measure two separate dimensions of
externality. This instrument consists of 24 items with 8 items per subscale. Responses
are given on a 6-point Likert-type scale with numbered responses representing
that high scores indicate greater internality, greater belief in control by powerful
others and greater belief that outcomes are determined by chance / luck.
Burger and Cooper’s (1979) Desirability of Control (DC) scale constituted a third
validation instrument. This 20 item instrument consists of statements concerning
preferences for tasks and situations which involve exerting control. People respond to
statements on a 7-point scale ranging from “Never Applies to You”, through “Applies
Half the Time” to “Always Applies to You”. A high score indicates greater
desirability of control.
Because socially desirable responding has been identified as a major problem with
locus of control scales, the Marlow-Crowne Social Desirability Scale (Crowne &
Marlowe, 1960), was used as a final validation instrument. Here, people have to
respond either “True” or “False” as to whether they engage in 30 types of socially
desirable and undesirable thoughts and behaviors expressed as statements. Items
involve thoughts and behaviors which people commonly engage in / do not engage in
although social norms dictate that one should not / should respectively. Responses are
keyed so that a high total score indicates greater socially desirable responding.
2.4 Procedure
Questionnaires for the development phases of the study (the exploratory factor
analysis and validation phases) were distributed simultaneously along with an
explanatory letter giving non-specific details of the study. Participation was voluntary
questionnaires. Means of distribution and collection differed slightly for different
types of respondent. Questionnaires for higher education employees were distributed
and collected by means of the institution’s internal mail system, while course tutors
were responsible for distributing and collecting questionnaires from students. Care
was taken not to place pressure upon students to participate. No instructions as to
order of questionnaire completion were given. At least one other psychometric
questionnaire was given along with the CCS for validation purposes. All responses
were treated in the strictest confidence. People with no computing experience were
asked to return the questionnaire uncompleted (these people were still entered for the
lottery).
CCS test–retest and cross-validation data was collected from students only. Tutors
administered and collected questionnaires during timetabled classes. Participation was
again voluntary. Ethical considerations were similar to those described above. In the
collection of test-retest data there was a two month time interval between first and
second CCS administrations
3. Results
3.1 Exploratory factor analysis
Inspection of data for the 60 items in the initial pool of CCS items showed that
many items had markedly non-normal distributions, a high degree of skew being
tended to be items tapping internal causation of computing outcomes and
chance/luck/fate as responsible for successful outcomes, were excluded from further
analysis along with a few residual items tapping these issues1.
Further analysis to refine the questionnaire proceeded in a manner recommended by
Kline (2000). A scree plot associated with an initial Principal Components Analysis
(PCA) carried out on the remaining items suggested that two factors existed in the
data set. Inspection of output from a second, Principal Axis Factoring (PAF), run
specifying oblique (Direct Oblimin) rotation of two factors revealed that items tapping
the role of powerful others in determining computing outcomes failed to load highly
on either factor.
With the above items excluded, a final analysis was performed. This obliquely
rotated PAF run on the remaining 21 items revealed a correlation of -.34 between the
factors, this being higher than the criterion of +/-.32 suggested by Tabachnick and
Fidell (2001) as warranting oblique rotation.. The two factors in the solution
accounted for around 35% of variance cumulatively. Factor One accounted for around
27% of variance and Factor Two for around 8% of variance. Table 1 gives item
communalities, pattern matrix loadings and item wordings.
---
Insert Table 1 about here
---
1
From the factor loadings in Table 1 it can be seen that the 21 items in the refined
final instrument were factor pure, there being no cross-loadings greater than +/- .32.
From item wordings the first factor was interpreted as Computing Autonomy. Here,
14 items designed to tap confidence in controlling computers and self-reliance when
interacting with computers coalesced exclusively into a single bipolar factor, with the
factor representing the extent to which people are autonomous in their use of
computers in that they feel they can control them and solve computer-related
problems without the help of others. Factor Two was interpreted as Need for Control
(NControl), this bipolar factor loading upon all seven of the control motivation items
in the final questionnaire.
3.2 Internal properties
In an initial test of the stability of the CCS factor structure, and to ensure that the
solution was equally applicable to both sexes, the development sample was split on
the basis of sex and analyses were conducted for males and females separately. Scree
plots for two PCA runs suggested two factor solutions for both subsamples, and factor
interpretations for subsequent PAF runs were the same as those for the whole sample
analysis. Stability of factor structure across the two sexes was tested using two
procedures recommended by (Tabachnick and Fidell, 1989, 2001). First, Pearson’s r
analyses compared the patterns and magnitudes of loadings between the pair of
Autonomy factors and the pair of NControl factors from the sex-specific factor
solution applies to both males and females equally well. This conclusion was
supported by a further comparison of loading patterns. With loadings in the
hyperplane defined as those lower than +/-.32 (Tabachnick and Fidell, 1989), a
significant value of Cattell’s Salient Similarity Index (SSI) was obtained for the
NControl factor (s = 0.92, hyperplane count = 67%, P < .001). Given the greater
number of items on the Autonomy subscale, a low hyperplane count meant that
evaluation of the SSI was not feasible for this subscale. On the other hand, a major
reason why it is desirable to compute the SSI in addition to Pearson’s r is that the
presence of a large number of low loadings can inflate r (Tabachnick and Fidell,
1989). Thus, the low hyperplane count meant that this was not a great problem with
respect to the Pearson’s r analysis for the Autonomy subscale.
3.2.1 Cross-validation
Given that a number of variables were screened out prior to and during factor
analysis, cross-validation of the final questionnaire on a new sample of respondents
was necessary. Therefore PAF with oblique rotation was performed on data for the
203 students forming the cross-validation sample to test the replicability of the CSS
factor structure.
The techniques used were the same as those used above for testing stability across
the sexes. Comparison of patterns and magnitudes of loadings for factor pairs from
the data for the development and cross-validation samples resulted in Pearson’s r
results indicated a high degree of stability in factor structure across the two data sets.
More support for replicability came from a comparison of patterns of loadings where
a significant value of SSI was obtained for the NControl factor (s = 0.77, hyperplane
count = 62%, P < .001). Again, evaluation of the SSI for the Autonomy subscale was
not possible because of a low hyperplane count. But again this is not particularly
problematical.
From the above analyses it can be concluded that the factor structure of the CCS is
replicable. A copy of the final version of the CCS is included as an appendix.
3.2.2 Reliability
Subsequent to reverse coding of negatively phrased items, Cronbach’s alpha
coefficients for the two subscales on the data for the development sample showed the
internal consistency of both subscales to be acceptable, alpha having a value of .88 for
the Autonomy subscale and .73 for the NControl subscale.
Tests of temporal stability for 43 students across a two month time interval yielded
Pearson’s r coefficients of r(41)= 0.79 (P < .001, one-tailed) and r(41)= 0.75 (P <
.001, one-tailed) for the Autonomy and NControl subscales respectively. Both of
3.3 Validity
Data for validation analyses was provided by members of the development sample
described in the Method section. To allow a concise exposition, the precise
demographic details for the subsamples of the development sample associated with
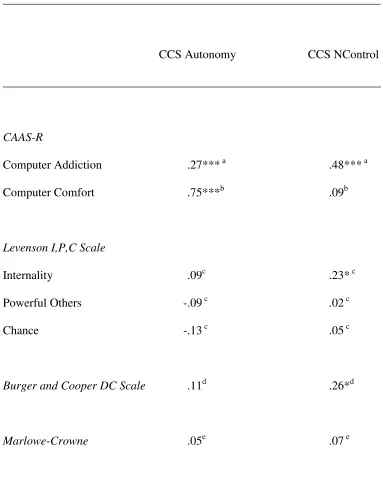
each analysis are not given. Correlations (Pearsons r coefficients) between scores on
the two CCS subscales and the various indices contained in the validation instruments
are given in Table 2.
In deriving subscale scores, responses on the items of each subscale were summated
with scoring keyed so that higher scores were commensurate with the two subscale
names: higher computing autonomy and need for control.
---
Insert Table 2 about here
---
3.3.1 Relationships with the Revised Computer Apathy and Anxiety Scale
It was not possible to develop hypotheses involving the Autonomy subscale prior to
factor analysis because it was assumed that Locus of Control and Confidence in
Controlling Computers factors, rather than an Autonomy factor, would exist.
However, subsequent to factor analysis it was possible to formulate hypotheses
anxiety – comfort subscale was concerned, it was hypothesized that people exhibiting
greater comfort with computers would be able to use them with greater autonomy.
However, feeling comfortable with computers would not be expected to say anything
about one’s need for control over them (in fact, an excessive need for control might be
considered as tending towards pathology – as implied by the rationale developed in
the Introduction for the hypothesis involving the CAAS-R Computer Addiction
subscale). Therefore, a null Comfort – NControl relationship was hypothesized. The
correlations in Table 2 supported this differential prediction. Computer Comfort
scores were more positively related with CCS Autonomy scores than with CCS
NControl scores. Furthermore, Williams’ test for differences between
non-independent correlations revealed a significant difference between the two
coefficients (t(121)= 8.77, P < .001, one-tailed).
Reference to Table 2 also reveals support for the hypothesis that greater computing
need for control would exhibit a particularly high relationship with computer
addiction. The correlation between these two variables was significant and the
magnitude of this coefficient was significantly greater than that for the Computing
Autonomy – Computer Addiction relationship (t(121)= 2.15, P < .05, one-tailed).
The high CCS Autonomy – CAAS-R Comfort coefficient in Table 2 shows that
scores for these two measures shared around 56% of their variance. Confirmatory
factor analysis (CFA) of standardized scores was therefore performed to ensure that
the distinction between the two constructs underlying these two subscales was
factorially valid.
The CFA was performed using EQS 5.7a (Bentler, 1995) and specified two
loadings in the range +/- 0.25 to +/-0.81 for the Autonomy factor and +/- 0.40 to +/-
0.83 for the Comfort factor. A significant chi-square goodness of fit statistic for the
analysis revealed a lack of fit between the data and the hypothesized factor structure
(χ2(431) = 721.42, P <.001). However, there are many problems with the chi-square
statistic and consideration of the ratio of chi-square to its degrees of freedom provides
a better approximate assessment, with a ratio of less than 2 indicating a reasonable fit
(Ullman, 2001). With a ratio of 1.67 then, the above chi-square statistics suggested an
acceptable fit. This conclusion was supported by a root mean square error of
approximation lower than 0.10 (RMSEA = 0.073, 90% confidence interval = 0.063 -
0.082). While the (commonly reported) comparative fit index of 0.83 was lower than
the value of 0.90 considered acceptable, RMSEA is the favored index in
personality-oriented CFA studies (Raykov, 1998).
Overall then, it can be concluded that, although highly related, the CCS Autonomy
and CAAS-R Comfort subscales are factorially distinct.
3.3.2 Correlations with the Internality, Powerful Others and Chance Scales
As far as correlations between the CCS subscales and the IPC locus of control
subscales are concerned, in general moderate correlations would be expected between
scores on a domain-specific scale and a general locus of control scale. However,
because items tapping attributions to internality, powerful others and chance/luck/fate
were removed during analysis of the CCS data, the rationale for including this
Cooper’s DC Scale (Burger, 1984, 1992) analysis of the relationships between scores
for the two CCS subscales and Levenson’s scales is presented. It will be remembered
from the Introduction that a positive correlation was expected between NControl
scores and Levenson Internality scores, with correlations between NControl and both
externality scores (Powerful Others and Chance) being expected to be lower in
absolute magnitude and negative. Given the material in the Introduction suggesting
that internals are more likely to master their environment and thereby develop greater
computing confidence, a positive correlation was also expected between CCS
Autonomy scores and Internality scores. No hypotheses were forwarded with respect
to Autonomy and the two external IPC scales.
Consistent with the validation hypothesis, Table 2 shows a significant positive
relationship between CCS NControl scores and Internality scores, this being the only
significant correlation between NControl and the Levenson subscales. However,
contrary to hypothesis, there was no significant correlation between CCS Autonomy
scores and Internality scores, the coefficient approaching zero.
3.3.3 Correlations with Desirability of Control
As a domain-specific subscale aimed at tapping a broadly similar construct to that
tapped by the global DC scale, it was expected that scores on the CCS NControl
subscale should exhibit a reasonable correlation with DC scores, and Table 2 supports
this hypothesis. As would be expected, the table also shows that NControl scores were
contrary to the ideal situation, the NControl – DC and Autonomy – DC coefficients
were not significantly different (t(58)= 0.85, P > .05, one-tailed).
3.3.4 Socially desirable responding
The minimal correlations between scores on the two CCS subscales and
Marlowe-Crowne scores in Table 2 indicate that the CCS does not have a tendency to induce
socially desirable responding.
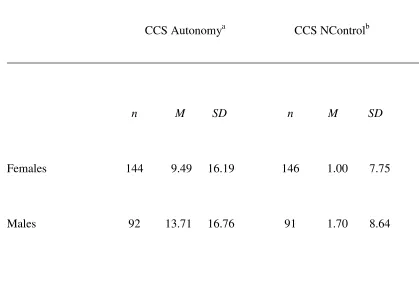
3.4 Subscale descriptive statistics for different sexes and occupational groups
Because of the general thrust of the literature showing greater male computing
involvement, it is useful to present some information on sex differences for the two
presently developed indices. Table 3 contains descriptive statistics for the
development sample. Two independent samples t-tests on the means in Table 3
showed males as having significantly greater computing autonomy (t(234)= 1.93, P <
.05, one-tailed), but not significantly greater computing need for control (t(235) =
0.65, P > .05, one-tailed).
---
Insert Table 3 about here
Finally, to facilitate comparisons that future researchers might wish to make, Table
4 gives descriptive statistics for different vocational groups. Note that if elimination of
negative scores from a data set is considered desirable (e.g. for the purposes of
dissemination to respondents), this can be done by adding a constant of 42 to
Autonomy scores and 21 to NControl scores.
---
Insert Table 4 about here
---
4. Discussion
In its final version, the CCS consists of Computing Autonomy and Computing
Need for Control subscales. The factor structure of the CCS has been shown to be
robust, its subscales to be internally consistent and scores on them to be temporally
stable. Some initial evidence in support of the subscales’ validity has also been
presented. As would be expected, computing autonomy bore a greater relationship
with computer comfort than computing need for control did, but, again as expected,
the computing need for control – computer addiction relationship was greater than the
autonomy – addiction relationship. Nevertheless, as one would expect intuitively,
there was a reasonably sized relationship for this latter pair of variables. The pattern
whereby the Levenson Internality subscale exhibited a greater relationship with Need
slightly larger (negative) correlations with the other two Levenson scales, than the
null correlations in the present study. While computing need for control exhibited a
higher correlation with Burger and Cooper’s (1979) global desirability of control than
computing autonomy did, the difference in magnitude of the two coefficients was
non-significant. Recalling that factor analysis of the DC scale has revealed an
Avoidance of Dependence factor (Burger, 1992), on reflection perhaps the
non-significance of this difference is not surprising.
Analysis of sex differences showed that males scored significantly higher on the
Autonomy subscale. This is consistent with the general thrust of the previous
literature showing greater male involvement in computing, in the form of, for
example, lesser male computer anxiety and greater male computer self-efficacy (see
Brosnan, 1998 and Durndell & Haag, 2002 for recent reviews). The non-significantly
greater Computing Need for Control score of males was consistent with the small
effect sizes found in domain-specific research where a slight, but often
non-significant, tendency for males to exhibit greater desire for control exists (Burger,
1992).
4.1 The constructs of computing need for control and autonomy
Computing need for control represents a domain-specific analog of Burger’s global
desire for control construct. If observations relating to the global construct generalize
to the computing domain, people high in computing need for control would be
success. However, there is also likely to be a negative side in that such individuals
would be expected to exhibit signs of unease and / or stress when faced with
uncontrollable computing situations. The present validation efforts also supported the
idea that a greater need for control might be a risk factor in the development of
addiction to certain computing activities as speculated by Weizenbaum (1984),
Shotton (1989) and Levy (1994).
The newly developed notion of computing autonomy is a hybrid construct
involving confidence in controlling computers (a construct similar to perceived
self-efficacy in controlling computers) and the extent to which people display self-reliance
in their interactions with computers. The merging of the two types of item into a
single factor is a robust phenomenon in that it was replicated across factor analyses
for both the development and cross-validation samples. It is also useful to note that an
(unreported) analysis imposing a three factor solution on the data for the development
sample still resulted in a first factor consisting of a mixture of self-reliance and
confidence items, rather than the autonomy factor splitting into distinct self-reliance
and confidence factors. There is an obvious logical connection between the two facets
involved in the autonomy construct in that people who perceive that they have
difficulties in controlling computers will tend to feel reliant upon others in situations
where they find control difficult. For the most part, high computing autonomy can be
viewed as a positive attribute since it represents a willingness to explore computing
environments and the functioning of software packages to exert control when faced
with computing problems. This should lead to greater knowledge of, and comfort
within, computing environments, which in turn should lead to even greater autonomy,
encouraging to find that confirmatory factor analysis showed that computer comfort
(the opposite of computer anxiety) and computer autonomy are distinguishable. It is
necessary to note though that not all validation hypotheses involving the Autonomy
subscale were supported. In particular, although there is much previous evidence
suggesting that people with an internal locus of control are more likely to master their
environment and therefore one validation hypothesis proposed a positive relationship
between autonomy and internality, such a relationship was not observed. The reason
for this is unclear.
A small relationship exists between computing need for control and computing
autonomy, the factors in the analysis for the development sample exhibiting an
absolute correlation of 0.34. This indicates that responses on the two scales have
around 12% of their variance in common. This correlation is reasonable given that
people with a high need for control would be expected to be autonomous in their
interactions with computers because their high motivation to control computers
should result in a greater amount of time spent using computers. This greater
experience would be expected to result in higher computing proficiency and thereby
greater autonomy. However, from a psychometric perspective the correlation is low
enough to allow use of the two subscales as independent predictors in statistical
analyses.
4.2 Problems in measuring computing locus of control
were highly skewed, hardly anyone agreeing or disagreeing with certain types of
statement. These observations have implications for both theory and future scaling
efforts in the area of computing locus of control. For example, few people (less than
10%) expressed disagreement with statements such as ‘My being able to use
computers is not just a matter of chance’, and agreement with statements such as ‘I
attribute most of my failures when computing to bad luck’ and ‘A lot of my success
when computing just depends upon whether I am having a lucky day’. It seems then
that most people accept that chance and luck play little part in the outcomes of their
interactions with computers. Also, most people have an internal orientation towards
computing, accepting that they can influence the outcomes of their interactions with
computers by their own efforts. Few people agreed with statements such as
‘Increasing the amount of time I spend learning about computers would not make me
any better at using them’ (only 12% agreement) and ‘It is no use me trying to be good
at computing’ (only 7% agreement), or disagreed with a statement such as ‘I can have
a great influence upon whether I am good at computing’ (only 9% disagreement).
Thus, from the present results it appears that attempts to construct computing-specific
scales measuring locus of control dimensions such as internality, luck and chance is
likely to be difficult using factor analytic methods. Nevertheless, the present data
shows that a small proportion of people might still be at an educational or vocational
disadvantage because of low internality and / or high externality with respect to
computing situations. Therefore future attempts to develop an instrument using other
methods, such as criterion-keying, would be worthwhile.
Because previous research has used general locus of control measures rather than
away from externality. Certainly, the almost universal adoption of graphical user
interfaces such as Windows over the past decade is likely to have bolstered such an
expectancy pattern, since these interfaces make human-computer interaction easier
and altogether more intuitive than was previously possible. Whatever the case may be,
experience appears to have taught most people that computing outcomes are usually
controllable if one has a deep enough knowledge of computers, despite the fact that
they may sometimes be faced with uncontrollable events such as crashing or hanging.
Another reason for the present observations concerning computing locus of control
items might be that, similar to cars, video recorders etc., computers are objects upon
which physical actions (e.g. pressing buttons and keys) usually have a demonstrable
effect, and therefore if one knows which actions to perform one will be largely
successful. This contrasts with the situation regarding life occurrences such as health,
occupational progression etc. Here, the factors that influence outcomes can be
unpredictable and unknown, are often demonstrably so, and experience and
observation often tells people that, despite their best efforts at control, certain
outcomes might occur.
4.3 Failure to develop autonomy
The present findings imply that although most people agree that in principle
computing outcomes are within their control, many people’s feelings of control over
computers are so fragile that they feel a need to rely upon others in difficult
people lacking the confidence in their ability to control computers to the extent that
they need to rely upon others in difficult computing situations. Equating confidence
with self-efficacy (Ajzen, 2002), this supports Bandura’s (1997) observation that
locus of control and self-efficacy beliefs are largely independent of each other. On the
question of why some people fail to develop autonomy in their use of computers
despite a belief that outcomes are fundamentally controllable, one possibility is that
many people accumulate years of computing experience without ever really
developing a sense of mastery over computers, because of a reluctance to go beyond
the necessary basics in their interactions with computers. For such people, the
increase in confidence / self-efficacy in controlling computers which would generally
be expected to be a concomitant of increasing experience might never materialize.
This is supported by findings that computing experience does not always alleviate
computer anxiety or increase computer self-efficacy (Marcoulides, 1988; Cassidy and
Eachus, 2000). In explaining such findings, Cassidy and Eachus (2002) suggest that it
is ‘…quality not quantity…’ of experience that determines computing self-efficacy
beliefs: it is perhaps not simply number of hours of computing experience
accumulated that is important, but experience in terms of depth of use of packages and
in the range of applications used that fosters a sense of self-efficacy / confidence in
controlling computers. Reasons why certain people may be reluctant to go beyond the
basics in their interactions with computers are likely to include some of those
discussed by Brosnan (1998) in relation to technophobia. For example, historically
computers have been portrayed as highly masculine objects, making them respectively
more and less appealing to individuals characterized by masculine and feminine
autonomy). Also, the analytical approach represented by a field independent cognitive
style has been said to make an individual more suited to interactions with computers
than has the more holistic field dependent cognitive style.
4.4 Conclusions
From an applied perspective, the development of the CCS is particularly important
because it opens the way for research into need for control in the field of
human-computer interaction. For example, studies of the extent to which a high need for
control plays an important part in mediating stress associated with non-optimally
responding computers and slow Internet download times might be fruitful, as might
studies examining need for control’s role in explaining computer-related addictions.
Also, it might be expected that employees and students who are high in computing
need for control would perform best in situations where computing environments
allow them a lot of scope for individual control, perhaps with less automation,
whereas those lower in need for control might prefer environments which include a
greater number of automated features. Thus, individual differences in need for control
might be one reason why meta-analysis shows that the effects of giving learners
greater control over the learning process in computer assisted instruction programs are
small but negative, students on the whole being shown to learn slightly better without
such control (Niemiec, Sikorski & Walberg, 1996). It is possible that studies mix
students who might be expected to benefit from such environments (high need for
With the introduction of intelligent agents on the horizon, it is probable that
individual differences in need for control over computers will become of even greater
significance than they are at present. Intelligent agents are computer software and / or
systems that operate autonomously once a task has been defined. Their use will
require computer users to relinquish control over tasks, and individuals with a high
need for control over computers are likely to find this uncomfortable. It will therefore
be important for organizations to consider the extent to which individual differences
in need for control will make the introduction of such technology into the working
environment desirable.
Further investigation of the construct measured by the CCS Autonomy subscale
could consist of assessing whether it is a better predictor of the degree to which
people exhibit autonomous computing behavior than measures of constructs such as
computer anxiety. An obvious use of the Autonomy subscale would be to measure the
success of educational courses in terms of their fostering of the ability to use
computers autonomously.
To conclude, evidence has been presented that the factor structure of the CCS is
replicable and that its subscales are reliable. Initial studies also suggest that the
subscales are valid measures of computing need for control and autonomy. It is
considered that the CCS has the potential to be a useful addition to the tools available
Acknowledgements
The author would like to thank Rob Ranyard and two anonymous reviewers for their
comments on an initial version of this article.
References
Ajzen, I. (2002). Perceived behavioral control, self-efficacy, locus of control, and the
theory of planned behavior. Journal of Applied Social Psychology, 32, 665-683.
Anderson, M.D., & Hornby, P.A. (1996). Computer attitudes and the use of
computers in Psychology courses. Behavior Research Methods, Instruments &
Computers, 28, 341-346.
Bandura, A. (1991). Self-regulation of emotion through anticipatory and self reactive
mechanisms. In R.A. Dienstbier (Ed.), Perspectives on motivation. Nebraska
Symposium on Motivation (pp.69-162). Lincoln: University of Nebraska Press.
Bandura, A. (1997). Self-efficacy. New York: Freeman.
Bentler, P.M. (1995). EQS Structural Equations Program Manual. Encino:
Multivariate Software Inc.
Brosnan, M. (1998). Technophobia. London: Routledge.
Burger, J.M. (1984). Desire for control, locus of control, and proneness to depression.
Journal of Personality, 52, 71-89.
Burger, J.M. (1992). Desire for control. New York: Plenum.
Burger, J.M., & Cooper, H.M. (1979). The desirability of control. Motivation and
Emotion, 3, 381-393.
Cassidy, S., & Eachus, P. (2000). The role of computer training in determining levels
of computer self-efficacy in students. Proceedings of Computers in Psychology
(CiP), University of York.
Cassidy, S., & Eachus, P. (2002). Developing the Computer User Self-Efficacy
(CUSE) Scale: investigating the relationship between computer self-efficacy,
gender and experience with computers. Journal of Educational Computing
Research, 26, 133-153.
Charlton, J.P. (1999). Biological sex, sex-role identity and the spectrum of computing
orientations: a re-appraisal at the end of the 90s. Journal of Educational Computing
Research, 21, 393-412.
Charlton, J.P. (2002). A factor analytic investigation of computer ‘addiction’ and
engagement. British Journal of Psychology, 93, 329-344.
Charlton, J.P., & Birkett, P.E. (1995). The development and validation of the
Computer Apathy and Anxiety Scale. Journal of Educational Computing Research,
13, 41-59.
Coovert, M.D., & Goldstein, M. (1980). Locus of control as a predictor of users’
attitude toward computers. Psychological Reports, 47, 1167-1173.
Crable, E.A., Brodzinski, J.D., Scherer, R.F., & Jones, P.D. (1994). The impact of
cognitive appraisal, locus of control, and level of exposure on the computer anxiety
of novice users. Journal of Educational Computing Research, 10, 329-340.
Crowne, D.P., & Marlowe, D. (1960). A new scale of social desirability independent
Durndell, A., & Haag, Z. (2002). Computer self efficacy, computer anxiety, attitudes
towards the Internet and reported experience with the Internet, by gender, in an East
European sample. Computers in Human Behavior, 18, 521-535.
Franken, R.E. (1998). Human motivation. Pacific Grove, CA: Brooks/Cole.
Hawk, S.R. (1989). Locus of control and computer attitude: the effect of user
involvement. Computers in Human Behavior, 5, 199-206.
Hill, T., Smith, N.D., & Mann, M.F. (1987). Role of efficacy expectations in
predicting the decision to use advanced technologies: the case of computers.
Journal of Applied Psychology, 72, 307-313.
Hoffman, D.L., Novak, T.P., & Schlosser, A. (2002). Locus of control, web use, and
consumer attitudes toward Internet regulation. Unpublished manuscript, Owen
Graduate School of Management, Vanderbilt University.
Howard, G.S., & Smith, R.D. (1986). Computer anxiety in management: myth or
reality? Communications of the ACM, 29, 611-615.
Igbaria, M., & Parasuraman, S. (1989). A path analytic study of individual
characteristics, computer anxiety and attitudes toward microcomputers. Journal of
Management, 15, 373-388.
Kline, P. (2000). Handbook of psychological testing. London: Routledge.
Lefcourt, H.M. (Ed.). (1981). Research with the locus of control construct (Vol. 1).
New York: Academic Press.
Lefcourt, H.M. (1991). Locus of control. In J.P. Robertson, P.R. Shaver & L.S.
Wrightsman (Eds.), Measures of personality and social psychological attitudes