Evaluation of basic properties of soil and major nutrient in
soils of jhabua district of madhya pradesh
Narendra Kumar Patidar
*1, Rohit Kumar Patidar
2, Archana Rajput
2, S.K. Sharma
1and
Rahul Thakur
1*1R.V.S.K.V.V., College of Agriculture, Indore, Madhya Pradesh, India 2Deprtment of Soil Science, IISS, Bhopal, Madhya Pradesh, India
*Corresponding author e-mail: [email protected]
Paper No. 552 Received: 17-03-2016 Accepted: 22-02-2017
Abstract
An experiment was conducted during the kharif seasons of 2014-15 under All India Coordinated Research Project for Dry land Agriculture at College of Agriculture, Indore Madhya Pradesh to study the major nutrient and other chemical properties of sampled vertisols and associated soils of Ralyawan village of Jhabua district of western Madhya Pradesh. Results showed that the Soils of Ralyawan village in Jhabua district of Madhya Pradesh were low in available nitrogen, low to medium available phosphorous and medium to high level in available potassium. Available nitrogen content in soils of Ralyawan village ranged from 152 to 298 kg ha1 with an average of 236 kg ha Nutrient index values was in low fertility class in soil of village. Thus, the overall poor and or low status of available nitrogen was observed in this soil. The status of available phosphorous varied from 7.15 to 38.8 kg ha1 with a mean value of 16.4 kg ha1. The 22.47% village soil samples from the study area can be classified as low fertility class and 64.84 % in medium fertility class. The nutrient index value for P was in medium fertility class of village. The status of available potassium varied from 179 to 826 kg ha1 with a mean value of 418 kg ha1. The 0% village soil samples under the study were classified as low fertility class, 2.30% as medium and 97.69% as high fertility class. The pH of varied from 7 to 8 with the mean value of 7.5. The electrical conductivity of soil water suspension ranged from 0.17 to 0.86 dSm1 with a mean value of 0.37 dSm1. The variation in organic carbon content in this soil was from 0.23% to 0.80% with a mean value of 0.53%. In general, the organic carbon status of Ralyawan village soils of was low to medium.
Highlights
• The Soils of Ralyawan village in Jhabua district of Madhya Pradesh were low in available N, low to medium available P and medium to high level in available K.
• Nutrient index values were in low fertility class in soil of village. Thus, the overall poor and or low status of available nitrogen was observed in this soil.
• The nutrient index value for P was in medium fertility class of village. The status of available potassium 0% for village soil samples under the study were classified as low fertility class, 2.30% as medium and 97.69% as high fertility class.
Keywords: Electrical conductivity, Nutrient index, Organic carbon, Nitrogen, Phosphorous, Potassium, pH and Soil
At present, the greatest challenge before Indian agriculture is to boost food production and productivity as well as sustainability of agriculture as a whole. There are problems that impose limits on these objectives or goals which raise serious concerns about national food security. Soil fertility
is one of the major constraints in achieving high productivity goals. In both rain-fed and irrigated systems, nutrient replenishment through fertilizers and manures remains far below the crop removal, thus causing mining of native reserves over the years. Soil test-based fertility management is SOIL SCIENCE
DOI: 10.5958/2230-732X.2017.00008.0
an effective tool for increasing productivity of agricultural soils that have a high degree of spatial variability.
However, major constraints impede wide scale adoption of soil testing in most developing countries. In India, these include the prevalence of small holding systems of farming as well as lack of infrastructural facilities for extensive soil testing. This study presents the soil spatial variability maps for soil pH, EC, organic carbon, available nitrogen, available phosphorous and available potassium along with multi nutrient deficiency maps. Soil fertility is an important factor, which determines the growth of plant. In general soil chemical fertility and in particular lack of nutrient inputs is a major factor in soil degradation (Hartemink et al. 2010). The available nitrogen was measured by Jain and Singh 2014 from Madhya Pradesh, India its value ranges from 172 ±2.1 to 193.3Kgha-1 for red, and brown soil and 197±4.9 to 215±21 Kgha-1 for black soil, 183±19 Kgha-1 nitrogen investigate in yellow soil (Jain and Singh, 2014).
Phosphorus is a part of every living cell in plant. It is one of the most important micronutrient essential for plant growth. Phosphorus is most often limiting nutrients remains present in plant nuclei and act as a energy storage. It helps in transfer of energy (Jain et al. 2014). Adequate phosphorus availability for plants stimulates early plant growth and hastens maturity. The soil with minimum leaching are known to contain high amount of phosphorus as compared to the soil with maximum leaching (Ashraf et al. 2012). Potassium is not an integral part of any major plant component but it plays a key role in a vast array of physiological process vital to plant growth from protein synthesis to maintenance of plant water balance (Sumithra et al. 2013). overall this physico-chemical study of soil is based on various parameters like pH, electrical
conductivity, soil organic matter, available nitrogen,
phosphorus and potassium. This knowledge will create awareness among the farmers about economic productivity.
Materials and methods
The experiment was conducted during kharif seasons of 2014-15 under All India Coordinated Research Project for Dry land Agriculture at College of Agriculture, Indore Madhya Pradesh. Jhabua
is situated at an altitude of 428 meters above the mean sea level with latitude of 21030’-22055’N and longitude of 73o30’-75001’E and Ralyawan is located in Jhabua district lying between 21o30’N latitude and 73o30’E longitude. Soil samples (0-15 cm) at random were collected during May 2014 in the help of soil augar.
Processed soil samples were analysed for nutrient availability by following standard analytical techniques. Total 250 soil samples covering all soil types. These samples were analyzed for pH, EC, OC, and available N, P, K of soil. Available Nitrogen was determined by alkaline permanganate method (Subbiah and Asija, 1956). The electrical conductivity (dSm1) and pH analysis soil suspension used for pH determination was allowed to settle down and
conductivity of supernatant liquid was determined by using conductivity meter (Jackson, 1967). The results are expressed in dSm1 at 25oC. Organic carbon content in soil was determined by Walkley and Black’s rapid titration method (1934). Available phosphorus was determined by using Olsen’s extractant (0.5 N sodium bicarbonate solution of pH 8.5, Olsen et al. 1954). Available potassium was
determined by flame photometer as described by
Jackson (1967). General statistics was calculated by Pearson correlation and one-way analysis of variance using SPSS Software 16.0.
Result and discussion
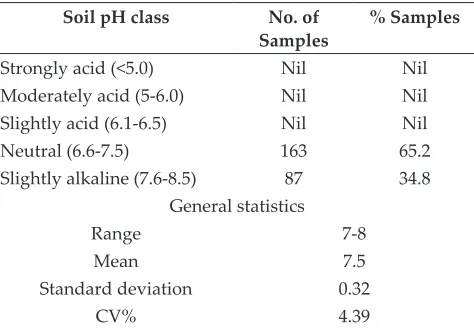
The pH of Soils of Ralyawan village varied from 7 to 8 with the mean value of 7.5 (Table 1).
Table 1: Soil reaction (pH) of soils of Ralyawan village
Soil pH class No. of
Samples % Samples
Strongly acid (<5.0) Nil Nil
Moderately acid (5-6.0) Nil Nil
Slightly acid (6.1-6.5) Nil Nil
Neutral (6.6-7.5) 163 65.2
Slightly alkaline (7.6-8.5) 87 34.8
General statistics
Range 7-8
Mean 7.5
Standard deviation 0.32
Soil pH class No. of
Samples % Samples
Strongly acid (<5.0) Nil Nil
Moderately acid (5-6.0) Nil Nil
Slightly acid (6.1-6.5) Nil Nil
Neutral (6.6-7.5) 163 65.2
Slightly alkaline (7.6-8.5) 87 34.8 General statistics
Range 7-8
Mean 7.5
Standard deviation 0.32
CV% 4.39
Table 2: Electrical Conductivity of surface soils of Ralyawan village
EC dsm-1 No. of Samples % Samples
<0.1 Nil Nil
0.1-0.2 4 1.6
0.2-0.3 108 43.2
>0.3 138 55.2
General statistics
Range 0.17-0.86
Mean 0.37
Standard deviation 0.12
CV% 32.79
The electrical conductivity of soil water suspension ranged from 0.17 to 0.86 ds m1 with a mean value of 0.37 dS m1 (Table 2). The variation in organic carbon content in this soil was from 0.23% to 0.80% with a mean value of 0.53%. In general, the organic carbon status of Ralyawan village soils of was low to medium. Organic carbon content of Ralyawan soils ranged from 0.29 to 0.85% respectively, which in general accumulated in surface layers (Table 3 & 4).
Table 3: Distribution of available OC status in the soils of Ralyawan village
Available-OC (%) No. of Samples % Samples
Very Low (<0.25) NIL NIL
Low (0.25-0.50) 24 9.6
Medium (0.50-0.75) 180 72
High(>0.75) 46 18.4
General statistics
Range (%) 0.29-0.85
Mean (%) 0.59
Standard deviation (%) 0.10
Coefficient of variation
(%) 17.52
Table 4: Different organic Carbon availability classes
of the soils of Ralyawan village
OC- availability Class Available-OC%
I <0.40
II >=0.40 to < 0.45 III >=0.45 to < 0.50 IV >=0.50 to < 0.55
V >=0.55 to <0.60
VI >=0.60 to < 0.65 VII >=0.65 to <0.70
VIII >=0.70
The lower contents of organic carbon apparently resulted because of high temperature which induced
rapid rate of organic matter oxidation, while the
declining trend towards to accumulation of crop residues every year, without substantial downward movement. Observations in the line with the present
findings have been reported in Nazif et al. (2006) showed that majority of the soil sites were medium
amount of organic matter. The OC content ranged
from 0.65 to 2.07 % (average 1.18 %) in the soils of District Bhimber (Azad Jammu and Kashmir) at 30
different locations. The organic carbon content of
surface soil was greater than the sub-surface soils
in most of the pedons due to high amount of litter
and the crop residues at the surface. Organic carbon content of the soils followed by decreasing trend
with depth in all the pedons. Its eflects the rapid rate of organic matter mineralization in these soils.
Out of 180.57 ha area about 180 ha area falls under low to medium (34.29% samples Low and 61.95% medium) status of available OC. Deshmukh (2012) also reported that the Organic carbon ranges from 0.165 to 1.575% in the soils. 29.03% and 48.38% of soils showed low and medium status of organic carbon respectively. Low status of organic carbon in some soils of the area is indicating that adequate nitrogen fertilization through organic manure, FYN etc are required.
Similar findings were reported by Lathwal (2006)
in district Kurukshetra, Haryana and Sharma et al. (2008) in soils of Amritsar District. The major proportion of the study area was low to medium in organic carbon (180 ha) (Fig. 4.) Low organic carbon in the soil is due to low input of FYM and crop residues as well as rapid rate of decomposition due
to high temperature. The organic matter degradation
of accumulation of organic matter in the soil. High
temperature and good aeration in the soil increased
the rate of oxidation of organic matter resulting
reduction of organic carbon content. The high temperature prevailing in the area is responsible for
the rapid burning of organic matter, thus resulting
in medium organic carbon content of these soils.
Table 5 : Distribution of available nitrogen status in the soils of Ralyawan village
Available -N (kg ha-1) No. of Samples % Samples
Low(<250) 138 55.2
Medium(250-400) 112 44.8
High (>400) NIL
General statistics:
Range (kgha-1) 152-298
Mean (kgha-1) 236
Standard deviation
(kgha-1) 31.02
Coefficient of Variation
(%) 13.14
Similar results were also noted by Sharma et al. (2008) in soil of Amritsar district and Lathwal (2006) in soil of Shahbad & Thaneshwar block. An average value of OC of the soil was found minimum i.e. 0.23%, in the village and maximum i.e. 0.80% in village of Ralyawan village.
Table 6: Different N availability classes of the soils of
Ralyawan village
N- availability Class Available-N , kgha-1
I <180
II >= 180 to <200
III >=200 to <210
IV >=210 to <220
V >=220 to <230
VI >=230 to <240
VII >=240 to <250
VIII >=250 to <280
IX >=280 to <300
X >=300
Shivanna and Nagendrappa ( 2014) reported that the pH of the soil samples ranged from 7.07 to 7.87 and was on slightly alkaline side but within the limit of 6.5-8.5 which is optimum for crops. EC values ranged from 0.26dSm-1 to 0.485dSm-1 and were within the limit of 0.8dSm-1 indicating low salinity status of the soils.
OC content ranged from 0.50% to 0.67% and all the samples were of medium rating. Kumar et al. (2014) also showed that the these soil samples were analyzed for electrical conductivity exhibited
significant and positive relationship with available
N, P, K and organic C showed significant and positive correlation with available N and K.
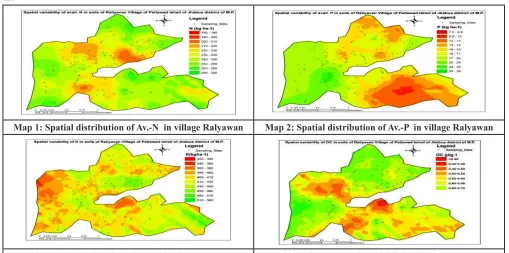
Map 1: Spatial distribution of Av.-N in village Ralyawan Map 2: Spatial distribution of Av.-P in village Ralyawan
Available major nutrients
Available nitrogen
Available N content in soils of Ralyawan village ranged from 152 to 298 kg ha-1 with an average of 236 kg ha-1. Nutrient index values was in low fertility class in soil of village.
Table 7 : Distribution of available phosphorus status in the soils of Ralyawan village
Available-P (kg ha-1) No. of Samples % Samples
Low(<12.5) 30 12
Medium (12.5-25) 168 67.2
High (>25) 52 20.8
General statistics Range (kgha-1) 7.15-38.8
Mean (kgha-1) 16.4
Standard deviation
(kgha-1) 6.29
Coefficient of variation
(%) 38.44
Table 8: Different P availability classes of the soils of
Ralyawan village
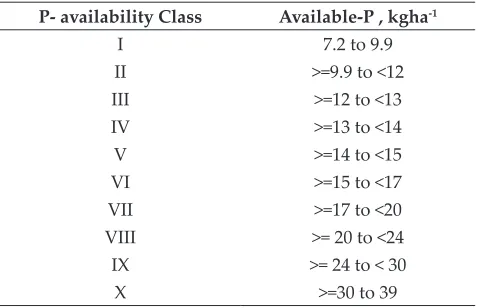
P- availability Class Available-P , kgha-1
I 7.2 to 9.9
II >=9.9 to <12
III >=12 to <13
IV >=13 to <14
V >=14 to <15
VI >=15 to <17
VII >=17 to <20
VIII >= 20 to <24
IX >= 24 to < 30
X >=30 to 39
Thus, the overall poor and or low status of available nitrogen was observed in this soil. The available Nitrogen content was low in major portion of the study area 97.11% samples which might be due
to low organic matter content in these soils. The
total nitrogen content in the soils is dependent on temperature, rainfall and altitude. Another possible reason may also be due to low organic matter content in these areas due to low rainfall and low vegetation facilitate faster degradation and removal
of organic matter leading to nitrogen deficiency. The
medium nitrogen status was noticed in some area may be due to application of N fertilizer coupled with high vegetative cover. Kumar et al. (2009) in
Dumka and Lachimpur series, Ashok et al. (2006) in Auraiya district of Uttar Pradesh observed a similar trend of nutrient status in study area soils. Shivanna and Nagendrappa (2014) also showed available nitrogen ranged from 54.825kg/ha to 85.72kg/ha; available phosphorous ranged from 5.33kg/ha to 10.79kg/ha and samples were nitrogen
and phosphorous deficient. Kumar et al. (2014) also showed that these soil samples were analyzed for N categorized as low as per criteria fallowed in the soil testing laboratory.
Available N status of the soils of Ralyawan village
Considering the soil test rating for available N (<250 as low, 250-400 as medium and >400 as high in the status of N) the soils of Ralyawan fall under low status (<250 kg ha-1) in available N content. In general out of 250 samples, 55.2% fall under low status and 44.8% samples were categorized under medium N status. The general statistics calculated from 250 soil samples revealed that the available N content ranged from 152–298 kg ha-1 (Table 5) with a mean value of 236 kg ha-1, standard deviation 31.02 kg ha-1 and Coefficient of Variation (CV) 13.14 %.
Spatial distribution of available –N in the village soils
Spatial variability map of available N of the village soils is presented in map 1. To prepare the N variability map soils were divided in to ten categories (Table 6). The spatial variability map of available N of Ralyawan village (Map 1) showed that in whole village the available N content varies from < 150 to > 310 kg ha-1. This kind of map will help the farmers for site specific nutrient management
on the basis of soil test values (Table 2).
Available phosphorus
The status of available phosphorous varied from 7.15 to 38.8 kg ha-1 with a mean value of 16.4 kg ha-1. The 22.47% village soil samples from the study area
can be classified as low fertility class and 64.84 %
soil as solid phase with varying degree of solubility. When water soluble P is added to the soil, it is converted very quickly to insoluble solid phase by reacting with soil constituents. These reactions
affect the availability of P and as a result of these
reactions, a very small amount of total P is present
in soil solution at any time reflected by soil testing.
However, a low to medium range of soil available
P under study area may be mostly affected by past fertilization, pH, organic matter content, texture
various soil management and agronomic practices (Verma et al. 2005). Nirawar et al. (2009) and Kumar et al. (2009) in Dumka and Lachimpur series of Jharkhand were medium in phosphorus content. Kumar et al. (2014) also showed that the these soil samples were analyzed for P categorized as medium as per criteria fallowed in the soil testing laboratory.
Available P status of the soils of Ralyawan village
The available P content (Table 3) of the soils of Ralyawan village ranged from 7.15 to 38.8 kg ha-1 with an average value of 16.4 kg ha-1. Considering the soil test rating for available P (< 12.5 kgha-1 as low, 12.5 – 25.0 kgha-1 as medium and >25.0 kgha-1 as high in the status of P) the soils of Ralyawan fall under low, medium and high status in available P content. In general out of 250 samples, 12 % samples fall under low status, 67.2% samples under medium P status and 20.8% samples were high in P status. The general statistics calculated from 250 soil samples revealed that the available P content ranged from 7.5– 38.80 kg ha-1 with a mean value of 16.4 kg ha-1, standard deviation 6.29 kg ha-1 and Coefficient of Variation (CV) 38.44%. The variation in available P is quite large which might be due to variation in soil properties viz., pH, organic matter content and
various soil management and agronomic practices adopted by the farmers of the region.
Spatial distribution of available–P in the village soils
Spatial variability map of available P of the village soils is presented in map 2. To prepare the P variability map soils were divided in to ten categories (Table 7) The spatial variability map of available P of Ralyawan village (Map 2) showed that in the whole village the available P content varies from < 7.2 to 39 kg ha-1.
Available potassium
The status of available potassium varied from 179 to 826 kg ha-1 with a mean value of 418 kg ha-1. The 0% village soil samples under the study were
classified as low fertility class, 2.30% as medium
and 97.69% as high fertility class. The available potassium content in major portion of the study area was under high category (180 ha) out of 181.57 ha total area of the village respectively. In general out of 250 samples, 97.69 % fall under high status were categorized under Ralyawan soils .show higher values due to predominance of K rich micaceous and feldspars minerals in parent material. Similar results were observed by Verma et al.(2005) in soils of Sardulgarh, Bhikhi and Budhlada blocksand Nirawar et al. (2009) in soils of Ahemedpurtahsil of Latur district. Major portion of areaunder high (180 ha) were seen in study soils, because these soils
have less finer fractions in their soil. In addition
Kaolinite type of clay mineralogy are the causes for their medium and low rating. Adequate (medium or
high) available K in these soils may be attributed to
the prevalence of potassium-rich minerals like Illite and Feldspars (Sharma et al. 2008). Shivanna and Nagendrappa ( 2014) also showed Potassium ranged from 156.18kg/ha to 434.38kg/ha and samples were of medium rating except one sample of high rating with respect to potassium. The highest and lowest mean values of available potassium were recorded 826 and 197 kg ha-1 K in village respectively, of Ralyawan. Kumar et al. (2014) also showed that the these soil samples were analyzed for K categorized as high as per criteria fallowed in the soil testing laboratory.
Available K status of the soils of Ralyawan village
value of 418 kg ha-1, standard deviation 66.25 kg ha-1 and Coefficient of Variation (CV) 15.84%.
Table 9: Distribution of available potassium status in the soils of Ralyawan village
Available-K (kg ha-1) No. of Samples % Samples
Low (<135) -
-Medium (135-335) 16 6.4
High (>335) 234 93.6
General statistics: Range (kgha-1) 179-826
Mean (kgha-1) 418
Standard deviation (kgha-1)
66.25
Coefficient of variation
(%) 15.84
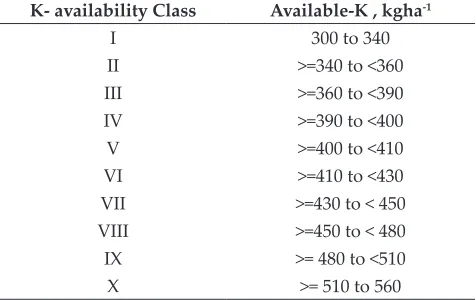
Table 10: Different K availability classes of the soils of
Ralyawan village
K- availability Class Available-K , kgha-1
I 300 to 340
II >=340 to <360
III >=360 to <390
IV >=390 to <400
V >=400 to <410
VI >=410 to <430
VII >=430 to < 450
VIII >=450 to < 480
IX >= 480 to <510
X >= 510 to 560
Spatial distribution of available–K in the village soils
Spatial variability map of Av-K of the village soils is presented in map 3. To prepare the K variability map soils were divided in to ten categories (Table 10) The spatial variability map of available-K of Ralyawan village (map 3) showed that in the whole village the Av-K content varies from < 300 to >=560 kg ha-1 .
Conclusion
The Soils of Ralyawan village in Jhabua district of Madhya Pradesh were low in available N, low to medium available P and medium to high level in available K. Nutrient index values was in low fertility class in soil of village. Thus, the overall poor and or low status of available nitrogen was observed in this soil. The status of available phosphorous
for village soil samples from the study area can
be classified as low fertility class and 64.84 % in
medium fertility class. The nutrient index value for P was in medium fertility class of village. The status of available potassium 0% for village soil samples
under the study were classified as low fertility class,
2.30% as medium and 97.69% as high fertility class.
References
Ashok, G., Singh, R., Aggarwal, S. and Kumar, P. 2006. NPK status of wheat growing soils in Auraiya district of Uttar Pradesh International J.Agric. Sci., 2(1): 286-287.
Ashraf, M., Bhat, G.A., Dar, I.D. and Ali, M. 2012. Physico-Chemical Characteristics of the Grassland Soils of Yusmarg Hill Resort (Kashmir, India) Eco. Balkanica4(1): 31-38
Deshmukh, K. K.2012. Evaluation of soil fertility status from Sangamner area, Ahmednagar district, Maharashtra, India Rasayan, J. Chem., 5 (3): 398-406.
Hartemink, E. 2010. Land use change in the tropics and its effect on soil fertility, 19th World Congress of Soil Science, Soil Solutions for a Changing World 1 – 6 August 2010, Brisbane, Australia. Published on DVD.
Jackson, M.L.1973. Soil chemical analysis prentice hall of India Private Limited New Delhi.
Jackson, M.L. 1967. Soil Chemical analysis. Prentice Hall of India, Pvt. Ltd., New Delhi : 498
Jain, P. and Singh, D. 2014. Analysis the Physico-Chemical and Microbial Diversity of Different Variety of Soil Collected From Madhya Pradesh, India Scholarly Journal of Agricultural Science, 4(2): 103-108
Jain, S.A., Jagtap, M.S. and Patel, K.P. 2014. Physico-Chemical Characterization of farmland Soil used in some villages of Lunawada Taluka, Dist : Mahisagar (Gujarat) India Int. J. of Sci. and Res. Publi. 4(3): 1-5.
Kumar, A., Mishra,V.N., Srivastav, L.K. and Banwasi, R. 2014. Evaluations of soil Fertility Status of Available Major Nutrients (N, P & K) and Micro Nutrients (Fe, Mn, Cu & Zn) in Vertisol of Kabeerdham District of Chhattisgarh, India International Journal of Interdisciplinary and Multidisciplinary Studies (IJIMS) 1(10): 72-79.
Kumar, R., Sarkar, A.S., Singh, K.P., Agarwal, B.K. and Karmakar, S. 2009. Appraisal of available nutrients status in Santhal Paraganas region of Jharkhand. J. Indian Soc. Soil Sci., 57(3): 366-369.
Lathwal, O.P. 2006. Soil fertility status of district Kurukshetra (Haryana) Haryana J. Agron. 22(1): 74-76.
Nazif, W. Perveen, S. and Saleem, I. 2006. Status of micronutrients in soils of district bhimber (Azad Jammu and Kashmir). J. Agric. & Biological Sci. 1(2): 35-40 Nirawar, G.V., Mali C.V. and Waghmare M.S. 2009. Physico
Olsen, S.P., Cole, C.V., Watanable, F.S. and Dean, L.A. 1954. Estimation of available phosphorus in soil by extraction with sodium bi carbonate USDA Circular: Pp. 939. Rajeswar, M., Rao, C.S., Balaguravaiah, D. and Khan, M.A.A.
2009. Distribution of Available Macro and Micronutrients in Soils Garikapadu of Krishna District of Andhra Pradesh. J. Indian Soc. Soil Sci. 57(2): 210-213.
Sarkar, D., Meena,V.S., Haldar, A and A Rakshit 2017 Site-Specific Nutrient Management (SSNM): A Unique Approach Towards Maintaining Soil Health In A.Rakshit et al. (eds.) Adaptive Soil Management : From Theory to Practices pp 69-88 Springer-Singapore ISBN: 978-981-10-3637-8 (Print) 978-981-10-3638-5 (Online)
Sharma, P.K., Sood, A., Setia, R.K., Tur, N.S., Mehra, D. and Singh, H. 2008. Mapping of macronutrients in soils of Amritsar district (Punjab) A GIS approach. J. Indian Soc. Soil Sci. 56(1): 34-41.
Shivanna, A.M. and Nagendrappa, G. 2014. Chemical Analysis of Soil Samples to Evaluate the Soil Fertility
Status of Selected Command Areas of Three Tanks in Tiptur Taluk of Karnataka, India IOSR Journal of Applied Chemistry (IOSR-JAC) 7(11): 01-05.
Subbiah, B.V. and Asija, C.L. 1956. A rapid method for the estimation of available nitrogen in soil. Current Science 25: 259-260.
Sumithra S., Ankalaiah, C., Rao, D. and Yamuna, R.T. 2013. A case study on physico–chemical characteristics of soil around industrial and agricultural area of yerraguntla, Kadapa district, A.P, india Int. J. Geo. Earth and Environ. Sci., 3(2): 28-34.
Verma, V.K., Setia, R.K., Sharma, P.K., Singh, C. and Kumar, A. 2005. Pedospheric variations in distribution of DTPA-extractable micronutrients in soils developed on different physiographic units in central parts of Punjab, India International J. Agric. and Biology 7: 243-246.