Enhancing the Classification Accuracy of SSVEP based BCI
using CWT method along with ANN
Mamta kumari
1, S.B Somani
2Department of Electronics & Telecommunication M.I.T. College of Engineering, University of Pune. India
I. INTRODUCTION
Brain-computer interface (BCI) are communication system that translate brain electrical activity typically measured by electroencephalogram (EEG) into computer command, and hence assist to reconstruct communicative and environmental control abilities for severely disabled people and can be used for industrial / robotic applications. Event –related potential (ERP), steady-state visual evoked potential (SSVEP) and event– related (de)synchronization (ERD/ERS)) are usually adapted for development of BCIs [4]. In recent years, SSVEP-based BCI has been increasingly studied. Since it requires less training to the user and provides relatively higher information rate (ITR).When subject focuses attention on the repetitive flicker of a visual stimulus, SSVEP is elicited at the same frequency as the flicker frequency, and also it‟s harmonics over occipital scalp areas [1]. Accordingly, SSVEP based BCI is designed to detect the desired commands through recognizing the SSVEP frequency in EEG. Although original SSVEP responses present relatively stable spectrums over time, they are likely to be contaminated by ongoing EEG activities and other background noises. Therefore, the development of an effective algorithm to recognize the SSVEP frequency with a high accuracy and a short time window length (TW) is considerably important for development of an SSVEP-based BCI with high performance.Various approaches have been proposed to recognize SSVEP frequency for BCI applications. In this research work, we are going to use CWT method to extract the features from the SSVEP signals and after that ANN is applied for the classification and command generation for the desired purpose. EEG signals are non-stationary whose frequency components vary as a function of time. The analysis of such signals can be
Abstract—
This paper reviews the application of continuous wavelet transform (CWT) with artificial neural network (ANN) for the neurological waveform detection and pattern analysis. A brain-computer interface (BCI) is a promising communication channel used to connect the brain to external electronics devices. SSVEP signals are used as basis for BCI because of its reliability, high information transfer rate, minimum training and flexibility. The continuous wavelet transform (CWT) offers a valuable tool for the analysis of the signals as it provides precise location in term of high frequency components. The selection of mother wavelet having high correlation with the signal under study provides a more accurate time frequency analysis. This paper reviews the application of the artificial neural network (ANN) along with the CWT method to the waveform detection and pattern analysis of the SSVEP signal. ANN methods are shown to be an excellent way of incorporating expert knowledge about the brain into a mathematical framework with minimal assumptions about the statistics of signals and noise.International
Journal
Of Advanced Research in Engineering & Management (IJAREM)
knowledge about the brain into a mathematical framework with minimal assumptions about the statistics of signals and noise [9].
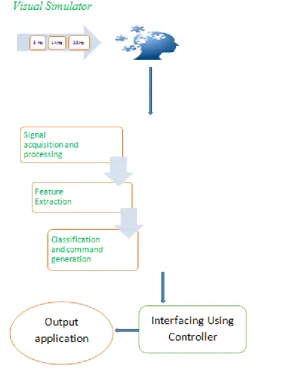
II. SYSTEM ARCHITECTURE
TheEEG database used for this study includes EEG signals recorded from the range of 5 Hz to 30 Hz, in which we specifically use 8 Hz, 14 Hz, and 28 Hz for the study. In this research project a combination of software and hardware platform is setup to support the BCI application that performs the implementation of signal acquisition, signal processing, classification, and generation of command signals had interfacing with the device.
The system architecture consists of mainly four components:-
1.) SSVEP signals acquisition and de-noisingit.
2.) Extract features from the SSVEP signals by CWT method andClassification of the features and generation of the command signals for the predefined task is done by ANN.
3.) Develop a prototype and demonstrate the device interface.
1) SSVEP Signal Acquisition
The database used in this study is obtained from the given reference [11]. These signals are in .mat format. This EEG-SSVEP database consists
ofthree databases having five trails of each 8 Hz,14 Hz and 28 Hz signals. The data are sampled at the rate of 256 Hz.
Fig 1: Block diagram of the system
2)
CWT-Based SSVEP Feature Extraction And Classification
A. Continuous wavelet transform :
The wavelet theory, originally proposed in the field of mathematics, was introduced into the field of signal analysis by Goupillaud , Grossman and Morlet in 1984.
Wavelet transform has its flexibility in the choice of analyzing functions, which overcomes the shortage of traditional Fourier transform method.
International
Journal
Of Advanced Research in Engineering & Management (IJAREM)
The formula of continuous wavelet transform (CWT) is
---(2)
Where, f(x) is the time domain limited signal.Ψ(x) is the energy limited wavelet function or mother wavelet. a is the scale factor, b is the shift factor and * means complex conjugation. The adjustment 1/√a is intended to normalize the energy content of each wavelet that goes into the reconstructing the original signal [4] [5]. A set of wavelet coefficient w(a,b) actually denote the extent of correlation between the scaled , shifted wavelet transform and one segment of the signal. Through wavelet transform, the signal x(t) is broken up into the shifted and scaled versions of the mother wavelet.
In this presented SSVEP-based BCI system, the Morlet wavelet transform is employed for feature extraction. To make wavelet co-efficient w(a,b) more easily interpretable, the scale factor „a‟ has to be transformed into the frequency f.
Wk(a,b) = WK(f,t)│f =fs-fo/a, t = b
Where „f‟s denotes the samplingfrequency and „fo‟ is the central frequency of the morlet wavelet spectrum in
Hz, and k represents the EEG trial number. ThusWk(f,t) denotes the time-frequency co-efficient at frequency f and time t of kth EEG trial data.
B. Artificial Neural Network:
Fig 2: Artificial Neural Network for classification
1)
Interfacing
Interfacing can be done by controller through serial port by the development of prototype using 8051 controller and the dc motor. The classification results are sent from MATLAB to controller through serial port as the input. The controller is programmed through the Keil software and output is shown by the rotation of DC motor.
III. IMPLEMENTATION AND RESULTS
In the first stage of this work reference signals for four subjects were loaded in MATLAB. After that in the second stage the CWT method is used for the feature extraction and ANN is used for the classification. In the last stage interfacing is done by using microcontroller IC, a LED display and DC motor.
Phase 1:
International
Journal
Of Advanced Research in Engineering & Management (IJAREM)
Fig 4: SSVEP Signal of 14 Hz
Phase 2:
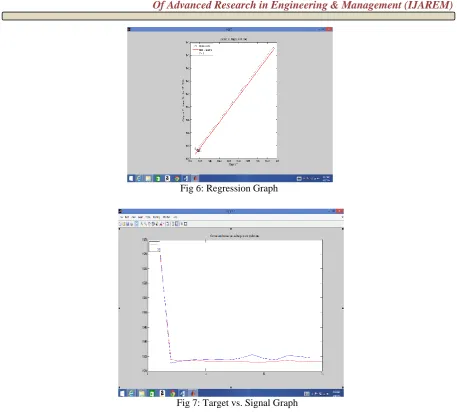
Now we have to apply CWT method between the stimulus signals and the generated SSVEP signals. Here we will use the 14Hz frequency signal as a target/stimulus frequency for the subject one and SSVEP signals of 14 Hz signal which is generated. After that we will use 8 Hz as a target/stimulus frequency for the subject two, three and four and SSVEP signal of 8 Hz is generated. With the help of MATLAB tool we get the CWT co-efficient. The CWTco-efficient are used as the input for the ANN. Artificial Neural Network classify the features and generates the commands for the pre-defined task.
Fig 6: Regression Graph
Fig 7: Target vs. Signal Graph
Phase 3:
International
Journal
Of Advanced Research in Engineering & Management (IJAREM)
RESULTS:
Subject
One
8 Hz
Non-8
Hz
Performance
in
percentage
Trial 1
0.80424
0.90978 90.978
Trial 2
0.83279
0.90883 90.883
Trial 3
0.81826
0.93054 93.054
Trial 4
0.76184
0.97955 97.955
Subject
Two
8 Hz
Non-8
Hz
Performance
in
Percentage
Trial 1
0.99723
0.88221
99.723
Trial 2
0.98221
0.88678
98.221
Trial 3
0.99341
0.89704
99.341
Trial 4
0.99626
0.88468
99.626
Subject
Three
8 Hz
Non-8
Hz
Performance
in
Percentage
Trial 1
0.90237
0.73817
90.237
Trial 2
0.88221
0.84357
88.221
Trial 3
0.90838
0.86018
90.838
Trial 4
0.94407
0.90069
94.407
Subject
Four
8 Hz
Non-8
Hz
Performance
in
Percentage
Trial 1
0.98842
0.94205
98.842
Trial 2
0.94058
0.89045
94.058
Trial 3
0.94059
0.95183
94.059
Trial 4
0.99391
0.94571
99.391
IV.CONCLUSION
In this project work, the features of SSVEP signals are extracted successfully by CWT and classified them with good accuracy by ANN method. After that we have generated control signals from classified data and developed a prototype using a microcontroller as an input datafor the desired output applications .It ismore user friendly and compatible for working in real time environment. The algorithm is the more efficient, accurate and easy method for processing of EEG signals used as the command for output applications. The CWT method is used for the feature extraction of the signal in terms of wavelet co-efficient. A set of wavelet co-efficient actually denotes the extent of correlation between the scaled, shifted wavelet transform and one segment of signal. The wavelet co-efficient are used as the input for the ANN. The ANN‟s are considered to be good classifier due to their inherent features such as adaptive learning, robustness, and self-organization and generalization ability. The result from the above table shows very good performance of the proposed system.
REFERENCES
[1]. Zimu Zhang, Xiuquan Li, and Zhidong Deng, “A CWT-based SSVEP Classification Method for Brain-Computer Interface System,” International conference on Intelligent control and Information Processing, August 13-15, 2010-Dalian, China.
[2]. A. Nijholt, D.Tan, G. pfurtscheller, C. Brunner, R. M. J.del, B.Graimann, F. popescu, B. Blankertz and K. R.Muller, “Brain-computer interfacing for intelligent system,”IEEE Intell. Syst. Vol. 23,pp72-79,2008. [3]. M. Middendorf, G. McMillan, G. Calhoun and K. Jones, ”Brain-computer interface,” IEEE Trans.
Rehabil. Eng, vol.8 pp 234-239,2006.
[4]. C.S. Herrmann, M. Grigutsch, and N.A. Busch, “EEG Oscillation and Wavelet Analysis,” in Handy , T.(eds.): Event –related potentials: A Methods Handbook, MIT press Cambridge, PP 229-259,2005. [5]. Wei Wu , “ Extracting Signal Frequency information in time/frequency domain by means of continuous
wavelet transform” International Conference on Control, Automation and Systems 2007 oct. 17-20 2007 in COEX, Seoul, Korea.
[6]. Zhang tong , Yang Fusheng, Tang Qingyu, “A Fast Algorithm Continuous Wavelet Transform Based on Mellin Transform With Biomedical Application,” proceedings of the 20th Annual International conference of the IEEE Engineering in Medicine and Biology Society, Vol. 20, no 3,1998.
[7]. Sam Darvishi and Ahmed A-Ani, “Brain-Computer Interface Analysis using Continuous Wavelet Transform and Adaptive Neuro-Fuzzy Classifier.” Proceedings of the 29th Annual international Conference of the IEEE EMBS France, August 23-26, 2007.
[8]. J-S, R. Jang, C-T. Sun and E. Mizutani,” Neuro-fuzzy and soft-computing: a computational approach to learning and machine intelligence, Prentice Hall , 1997.
[9]. Alen S. Gevins and Nelson H. Morgan “Application of neural-network(NN) signal processing in brain research.” IEEE Transactions on Acoustics, Speech and Signal processing, vol. 36. No.-7, July 1988. [10]. Elliott M. Forney and Charles w. Anderson “Classification of EEG during Imagined mental tasks by
forecasting with Elman Recurrent Neural Networks.” Proceeding of International Joint conference on Neural Networks, San Jose, California, USA, July 31-August 5, 2011.

