Is glaucoma comprehension associated
with psychological disturbance and
vision-related quality of life for patients
with glaucoma? A cross-sectional study
Xiang Mei Kong,1,2 Wen Qing Zhu,1,2Jia Xu Hong,1,2Xing Huai Sun1,2,3
To cite:Kong XM, Zhu WQ, Hong JX,et al. Is glaucoma comprehension associated with psychological disturbance and vision-related quality of life for patients with glaucoma? A cross-sectional study.BMJ Open2014;4:e004632. doi:10.1136/bmjopen-2013-004632
▸ Prepublication history for this paper is available online. To view these files please visit the journal online (http://dx.doi.org/10.1136/ bmjopen-2013-004632).
Received 6 December 2013 Revised 8 May 2014 Accepted 9 May 2014
1Department of
Ophthalmology and Vision Science, Eye and ENT Hospital, Shanghai Medical College, Fudan University, Shanghai, China
2Shanghai Key Laboratory of Visual Impairment and Restoration, Shanghai, China 3State Key Laboratory of Medical Neurobiology, Institutes of Brain Science, Fudan University, Shanghai, China
Correspondence to Dr Xing Huai Sun; xinghuaisun@gmail.com
ABSTRACT
Objective:To investigate whether understanding of glaucoma is associated with psychological disturbance and vision-related quality of life (QoL) in patients with glaucoma.
Design:A prospective, hospital-based, cross-sectional study.
Setting:Shanghai, China.
Participants:Five hundred patients with glaucoma were included in the study. Participants were asked to complete the glaucoma comprehension questionnaire, the Hospital Anxiety and Depression Scale (HADS) questionnaire, and the 25-item National Eye Institute Visual Functioning Questionnaire (NEI VFQ-25).
Outcome measures:Sociodemographic data and clinical data were collected. Multivariate adjusted linear regression analyses were performed to examine factors related to psychological disorder and QoL. The relationship between understanding of glaucoma and psychological status or QoL was analysed.
Results:The mean age of patients was 56.5
±17.2 years, and the mean duration of glaucoma was 4.6 ±6.3 years. About half (54.2%) of the patients had primary open angle glaucoma, 37.2% had primary angle closure glaucoma, and 8.6% had secondary glaucoma. The total score and the subscores of knowledge of glaucoma, compliance and habits were all negatively correlated with the HADS-Depression and HADS scores. For NEI VFQ-25, the total comprehension score was positively related to general vision, near activity, distance activity, social function, colour vision and the composite score. Habits had a significant influence on both HADS-Depression and the composite score of NEI VFQ-25.
Conclusions:The level of understanding about glaucoma is an independent factor negatively associated with psychological disturbance and positively associated with QoL in patients with glaucoma. However, it is a subjective factor which can be regulated, so imparting knowledge about glaucoma and establishing appropriate habits might help patients alleviate psychological disturbance and enhance their QoL.
INTRODUCTION
Glaucoma is the second leading cause of blindness globally, after cataracts. However,
because the blindness it causes is irreversible, glaucoma presents perhaps an even greater public health challenge than cataracts.1 Due to its asymptomatic, lifelong, chronic nature and potential outcome of blindness, it can often impose a psychological burden on patients.2 3 Anxiety and depression are two common forms of psychological disturbance and previous studies have shown that patients with glaucoma have a greater likelihood of having these conditions.4–6 Younger age, being female and having a moderate or heavy economic burden are risk factors for anxiety, while older age, increasing severity and duration of glaucoma are risk factors for depression.7 8 However, all these factors are objective and/or slow to change. Until now, to the best of our knowledge, few subjective factors have been shown to be associated with psychological disturbance in patients with glaucoma. In contrast to objective factors, subjective factors can change or be regulated. Thus, addressing subjective factors might alleviate the anxiety and depression of patients with glaucoma.
The term ‘quality of life’ (QoL) is a broad concept incorporating the patient’s perspec-tive of his or her health; it also reflects the gap between a person’s expectations and their present status.9QoL was introduced to ophthalmology in the 1980s as an evaluation
Strengths and limitations of this study
▪ This study for the first time highlights a novel factor which can be altered or improved so as to relieve psychological disturbance and improve the quality of life of patients with glaucoma.
▪ Strengths of the study include the large sample with a high participation rate, control of con-founding variables, and the use of several questionnaires.
▪ The main weakness of the study is that it is hospital-based rather than population-based.
on September 22, 2020 by guest. Protected by copyright.
indicator. Compared with the general QoL evaluation tools, vision-related QoL measurements have been widely accepted as specifically reflecting the impact of visual function impairment on the individual.10 Maximising a patient’s QoL has been one of the main goals of glaucoma treatment,11 since vision-related QoL is reduced by the condition.12 13Previous studies on the factors influencing vision-related QoL among patients with glaucoma have focused mainly on clinical types, visual function,14 15 treatment regimen and self-management.16However, there have been no studies on how to improve QoL among patients with glaucoma, and many unknown factors have yet to be explored.
Ignorance of the nature of illness can delay or prevent compliance with the treatment of many diseases includ-ing glaucoma,17–19 and poor adherence to treatment may lead to preventable vision loss. It has been reported that over half of the undiagnosed cases of glaucoma in the general population occur in regions with high medical standards.20 For those who had been diagnosed with glaucoma, over a third did not know or were not sure of their glaucoma type.21 Thus, it is important to improve understanding of glaucoma in patients with the condition. However, how to increase the understanding
and knowledge of patients remains a problem.
Education of patients might be an easy and effective solution. The Shanghai Glaucoma Club (SGC) has attempted to educate patients for more than 16 years.21 22 A previous study showed that club members had a better understanding of glaucoma and looked
‘happier’ than general patients.21 This suggests possible relationships between understanding of glaucoma and anxiety, depression and QoL. Therefore, this study aims to determine if level of understanding of glaucoma is associated with psychological disturbance and vision-related QoL in patients with glaucoma. Evidence of such relationships might suggest a way to alleviate psycho-logical disturbance and enhance QoL among patients with glaucoma, which would be of great significance in the treatment of glaucoma.
METHODS Subjects
This prospective study enrolled patients with clinically diagnosed glaucoma who were scheduled for vision care at the Department of Ophthalmology of the Shanghai Eye, Ear, Nose, and Throat Hospital of Fudan University from July 2012 to November 2012. The inclusion criteria were Chinese-speaking adult patients (18 years old and above) with a glaucoma diagnosis based on typical glau-comatous cupping of the optic disc with compatible visual field defects detected by automated static perim-etry (Humphrey Visual Field Analyzer 30-2; Humphrey Instruments, San Leandro, California, USA) in one or both eyes. This study included patients with primary open angle glaucoma (POAG), primary angle closure glaucoma (PACG) and secondary glaucoma (SG). The
exclusion criteria were as follows: (1) any other coexist-ing ocular condition that could impair visual function (eg, a visually significant cataract, retinal or neural path-ology); (2) incisional ocular surgery in the past 3 months or laser treatment in the past 1 month; (3) current use of a medicine that might cause psycho-logical disturbance, such as oral β-blockers; and (4) dis-ability in a visualfield test due to cognitive impairment.
The study was approved by the ethics committee of the hospital and was conducted according to the tenets of the Declaration of Helsinki. All participants gave their written informed consent. The data were labelled with serial numbers and analysed in a manner that protected patient privacy.
Clinical assessment
All patients underwent a complete ophthalmologic examination including best-corrected visual acuity (BCVA), slit lamp biomicroscopy, tonometry, indirect ophthalmoscopy and visual field examination. BCVA was evaluated with Snellen equivalents, based on a standard refraction and testing protocol at a starting distance of 5 m. Intraocular pressure was measured using a Goldmann applanation tonometer (Haag-Streit 900; Haag Streit, Koeniz, Switzerland). Visual field analysis was performed with automated perimetry (Humphrey Instruments) using a 30-2 threshold program (HFA30-2) with the SITA Standard strategy. The mean deviation (MD) in the last HFA30-2 taken within 3 months of enrolment in this study was used to evaluate visual field loss.
General information including age, gender, educa-tional level, living status and marital status, together with clinical information including the duration of glaucoma, type of glaucoma, length of membership of the SGC, glaucoma medication, previous laser treatment and pre-vious surgical treatment were all recorded on a checklist. Three questionnaires were administered to all subjects: a glaucoma comprehension questionnaire, a Chinese version of the Hospital Anxiety and Depression Scale (HADS), and the 25-item National Eye Institute Visual Function Questionnaire (NEI VFQ-25). The subjects were requested to answer the questionnaire by them-selves. The research staff explained the questionnaire to them and provided assistance when required. For partici-pants who could not read due to poor eyesight, a research staff member read the questionnaire to them in a neutral and uniform manner and recorded their choices.
Evaluation of comprehension and understanding of glaucoma
The glaucoma comprehension questionnaire consisted of 20 questions pertaining to three categories: the level of knowledge about glaucoma, compliance with medica-tion usage and follow-up, and life style and habits. Answers to each question were scored, and the scores were summed for each section (0–12, 0–12 and 0–7,
on September 22, 2020 by guest. Protected by copyright.
respectively) and as a total (0–31). Higher scores meant better understanding of glaucoma. This questionnaire was introduced and used in our previous study and pub-lished with it.21
Evaluation of psychological disturbance
The HADS questionnaire was developed by Zigmond and Snaith23 to identify and quantify the two most common forms of psychological disturbance in physic-ally ill patients: anxiety and depression. The original HADS was translated into Chinese Mandarin and has been validated in many studies.24 25 The HADS scale contains 14 questions graded on a four-point Likert scale (0–3). It consists of two subscales: HADS-anxiety (HADS-A) and HADS-depression (HADS-D). In each of the seven-item subscales, the minimum sum score is 0 and the maximum is 21. Higher scores indicate a higher level of depression and anxiety. In this study, patients with scores above 10 on the HADS-A and HADS-D were
diagnosed as having anxiety and depression,
respectively.4 7
25-item National Eye Institute Visual Function Questionnaire
The NEI VFQ-25 is a vision-related QoL instrument for patients, and the present study used the Chinese version of NEI VFQ-25 with an additional question.26 27 Since the response rate of item no. 14 was shown to be rather low in the Chinese population,26 according to the instructions in the manual we chose item A8 from the NEI VFQ-39 to serve as an appendix to item no. 14. If the statistical analysis showed a low response rate for item no. 14, the results of the appendix would be used to alleviate the impact of a high miss rate for item no. 14 on the validity and reliability of the entire questionnaire.
Twelve subscales were included in the questionnaire: general health, general vision, ocular pain, near activ-ities, distance activactiv-ities, social functioning, mental health, role difficulties, dependency, driving, colour vision and peripheral vision. Guidelines published by the NEI were followed in calculating the scale conver-sions and subscale scores. The subscales were scored on a range from 0 to 100. Higher NEI VFQ-25 scores indi-cated better QoL and less impairment.
Statistical analysis
Data were analysed using SPSS for Windows, V.17.0 (SPSS, Chicago, Illinois, USA). The mean scores and SDs together with the range of the scores were calculated for each subscale and composite score of the glaucoma com-prehension questionnaire, HADS and NEI VFQ-25. To determine the relationship between comprehension and HADS and between comprehension and NEI VFQ-25, multiple linear regression analysis was carried out with HADS and NEI VFQ-25 subscores as dependent variables and cognitive level as the independent variable, adjusted with or without demographic and clinical features. For the
comparison between different levels of comprehension, three categories were formed based on the scores: low (0– 18), moderate (19–25) and high (26–31). ANOVA and the Bonferroni test were used to detect differences. We divided the samples into 10 dB cohorts of the MD of the HFA30-2 test. The vision level of eyes that could not be examined by the HFA30-2 test because of poor visual func-tion was assigned an MD value of−34.0 dB. For statistical analysis, vision levels of counting fingers, hand motion, light perception and no light perception were assigned visual acuity values of 1/200, 0.5/200, 0.25/200 and 0.125/200, respectively, and visual acuity was converted into a logarithm of minimum angular resolution (logMAR) visual acuity. A p value of <0.05 was considered statistically significant.
RESULTS
A total of 508 patients were enrolled in this study; as eight patients were excluded because of incomplete data, 500 patients with glaucoma were chosen as study participants. The proportion of valid data was 98.43%.
Table 1 shows the demographic characteristics of these subjects. The sample consisted of 266 males and 234 females. The mean age of the included subjects was 56.46±17.22 years and 92.6% had reached a middle school or higher educational level. Most (93.8%) of the subjects were living with family, and 87.4% were married. The mean duration of glaucoma for all subjects was 4.64±6.30 years; 54.2% had POAG, 37.2% had PACG and 8.6% had SG. Regarding treatment, 85.4% had one or more types of medication, 15.8% had undergone laser treatment, and 44.8% had undergone surgical treatment.
Mean scores for glaucoma comprehension, HADS and vision-related QoL
The mean score of total glaucoma comprehension was 21.30±5.78. For the subgroups, it was 7.30±3.27 for knowledge of glaucoma, 9.21±2.10 for compliance, and 4.79±1.48 for habits.
The mean scores of total HADS, HADS-A and HADS-D were 13.41±6.59, 6.12±3.64 and 7.29±4.18, respectively. The prevalence of patients with glaucoma experiencing anxiety and depression was 11.2% and 26.0%, respectively.
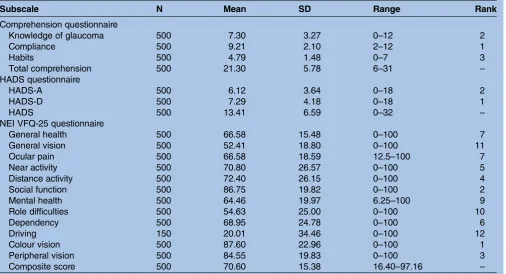
For NEI VFQ-25 subscales, the scores ranged from 20.01 for driving to 87.60 for colour vision, and the com-posite score was 70.60±15.38. Since the driving subscale had a high rate of missing data (350/500, 70.0%), we omitted this subscale in the calculation of the composite score and in further analysis, as suggested by previous research (seetable 2).
Regression analysis of psychological disturbance and vision-related QoL by glaucoma comprehension
The analyses showed that many of the variables such as age, gender, educational level, visual acuity, severity and
on September 22, 2020 by guest. Protected by copyright.
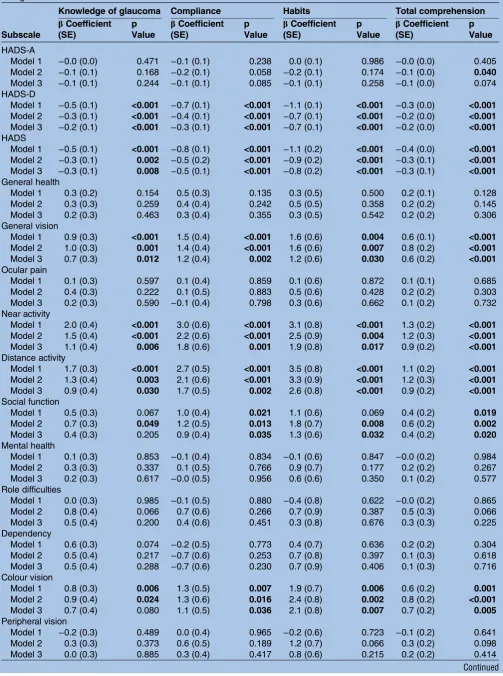
duration of glaucoma showed relationships with HADS scores and NEI VFQ-25 scores, so other variables were controlled in order to investigate the relationship between glaucoma comprehension and HADS and NEI VFQ-25. Table 3 showed the complete result with or without adjustments for other variables. Total glaucoma comprehension and its three subtypes (knowledge of glaucoma, compliance and habits) were negatively corre-lated with HADS-D and total HADS. The higher the level of comprehension, the lower the level of depres-sion. However, the level of comprehension showed no correlation with HADS-A. For NEI VFQ-25, the level of comprehension was positively correlated with general vision, near activity, distance activity, social function, colour vision and the composite score. The higher the level of comprehension, the higher the scores for these items. Understanding of glaucoma was not correlated with general health, ocular pain, mental health, role dif-ficulties, dependency or peripheral vision.
Comparison of depression and the NEI VFQ-25 composite score by different levels of glaucoma comprehension As the level of comprehension increased from low to high, the scores of HADS-D ( p<0.001) and total HADS ( p<0.001) decreased significantly ( p<0.001), while the subscores of general vision ( p<0.001), near activity ( p<0.001), far activity ( p<0.001) and the composite score ( p<0.05) of NEI VFQ-25 increased dramatically (figures 1and2). The subtypes of comprehension were also categorised into low, moderate and high levels: knowledge of glaucoma (0–7, 8–10, 11–12), compliance (0–7, 8–10, 11–12) and habits (0–4, 5, 6–7). The differ-ences among the three levels, between low versus moder-ate, between low versus high, and between moderate versus high, were analysed. Only compliance had a Table 1 Sociodemographic and clinical characteristics of
subjects
Variable Mean±SD, range N=500
Age, years 56.46±17.22 (18–91)
18–40 96
41–60 148
>60 256
Gender
Male 266
Female 234
Educational level
Primary school 37
Middle school 260
University and above
203
Living status
Living alone 31
Living with family 469
Marital status
Unmarried 45
Married 437
Divorced 2
Single 16
Duration of glaucoma, years
4.64±6.30 (0.10–37.00)
<1 132
1–5 203
>5 165
Type of glaucoma
POAG 271
PACG 186
SG 43
Medication
0 73
1 type 174
2 types 166
3 or more types 87
Laser treatment
No 421
Yes 79
Surgical treatment
No 276
Yes 224
SGC member
No 319
Yes 181
BCVA of
better-seeing eye
0.21±0.34 (−1.30 to 2.60)
>20/40 343
20/200–20/40 140
<20/200 17
BCVA of
worse-seeing eye
0.80±0.94 (0.18–3.20)
>20/40 176
20/200–20/40 183
<20/200 141
Lower IOP in both eyes, mm Hg
15.93±5.33 (5.00–53.70)
<18 346
18–30 141
>30 13
Continued
Table 1 Continued
Variable Mean±SD, range N=500
Higher IOP in both eyes, mm Hg
20.65±9.43 (7.00–65.00)
<18 225
18–30 206
>30 69
MD of less-damaged eye, dB
−7.73±6.27 (−30.52 to 2.70)
>−10 370
−10 to−20 97
<−20 33
MD of most-damaged eye, dB
−15.01±9.40 (−34.00 to 0.70)
>−10 197
−10 to−20 145
<−20 158
BCVA, best corrected visual acuity; IOP, intraocular pressure; MD, mean deviation; PACG, primary angle closure glaucoma; POAG, primary open angle glaucoma; SG, secondary glaucoma; SGC, Shanghai Glaucoma Club.
on September 22, 2020 by guest. Protected by copyright.
significant influence on the level of depression of the groups being compared. Knowledge and habits had a significantly different effect on depression in the low versus moderate and low versus high groups. Only habits had a statistically significant effect on the composite score in the low versus moderate groups (table 4).
Factors influencing the comprehension of patients with glaucoma
The level of comprehension of patients with glaucoma was positively related to the duration of their glaucoma. The scores of all subtypes (knowledge of glaucoma, compliance and habits) and of total comprehension sig-nificantly increased as the duration of glaucoma increased (F=46.160, p<0.001). The comprehension score of SGC members was 25.34±3.73, much higher than that of non-SGC members, which was 19.01±5.48 ( p<0.001). Being an SGC member had a significant effect on the level of comprehension of patients with glaucoma. The longer the membership of the SGC, the higher the comprehension score (F=39.676, p<0.001).
DISCUSSION
This study demonstrated that the level of understanding of glaucoma is an independent factor for psychological disturbance and QoL among patients with glaucoma. The level of comprehension is negatively correlated with depression and positively correlated with QoL, which
means the higher the level of comprehension, the lower the level of depression and the higher the QoL. Among the subtypes of comprehension, habits significantly influenced depression and the QoL composite score, while knowledge of glaucoma and compliance only influenced depression.
Patients with glaucoma may experience lack of glau-coma knowledge and psychological disturbance.4–6 21 However, few studies have investigated the relationship between glaucoma comprehension and psychological dis-turbance. Strykeret al28studied the relationship between adherence and psychological status and found that non-adherent participants were more fatalistic and less opti-mistic than adherent participants. However, the authors only examined adherence. In this study, we focused on patients with glaucoma and studied glaucoma compre-hension, psychological disturbance and relationships. The glaucoma comprehension questionnaire showed a mean score of total comprehension of 21.30±5.78 (ranging from 6 to 31). A total of 178 cases (35.6%) belonged to the group with a low level of comprehension. As the level of comprehension increased, the subscores of HADS-D and HADS significantly decreased (from 9.74 to 5.03 and from 15.88 to 10.90, respectively). Our study suggests that improving the comprehension of patients with glaucoma, for instance by educating them about the slow progression of glaucoma and the effectiveness of treatments to delay progression, could alleviate their psy-chological disturbance, especially depression.
Table 2 Scores for each subscale and total scale of the comprehension questionnaire, HADS and NEI VFQ-25 in all subjects
Subscale N Mean SD Range Rank
Comprehension questionnaire
Knowledge of glaucoma 500 7.30 3.27 0–12 2
Compliance 500 9.21 2.10 2–12 1
Habits 500 4.79 1.48 0–7 3
Total comprehension 500 21.30 5.78 6–31 –
HADS questionnaire
HADS-A 500 6.12 3.64 0–18 2
HADS-D 500 7.29 4.18 0–18 1
HADS 500 13.41 6.59 0–32 –
NEI VFQ-25 questionnaire
General health 500 66.58 15.48 0–100 7
General vision 500 52.41 18.80 0–100 11
Ocular pain 500 66.58 18.59 12.5–100 7
Near activity 500 70.80 26.57 0–100 5
Distance activity 500 72.40 26.15 0–100 4
Social function 500 86.75 19.82 0–100 2
Mental health 500 64.46 19.97 6.25–100 9
Role difficulties 500 54.63 25.00 0–100 10
Dependency 500 68.95 24.78 0–100 6
Driving 150 20.01 34.46 0–100 12
Colour vision 500 87.60 22.96 0–100 1
Peripheral vision 500 84.55 19.83 0–100 3
Composite score 500 70.60 15.38 16.40–97.16 –
HADS, Hospital Anxiety and Depression Scale; HADS-A, Hospital Anxiety and Depression Scale-Anxiety; HADS-D, Hospital Anxiety and Depression Scale-Depression; NEI VFQ-25, 25-item National Eye Institute Visual Function Questionnaire.
on September 22, 2020 by guest. Protected by copyright.
Table 3 Multivariate linear regression of subscales of HADS and NEI VFQ-25 according to the comprehension of patients with glaucoma
Knowledge of glaucoma Compliance Habits Total comprehension
Subscale
βCoefficient (SE)
p Value
βCoefficient (SE)
p Value
βCoefficient (SE)
p Value
βCoefficient (SE)
p Value
HADS-A
Model 1 −0.0 (0.0) 0.471 −0.1 (0.1) 0.238 0.0 (0.1) 0.986 −0.0 (0.0) 0.405 Model 2 −0.1 (0.1) 0.168 −0.2 (0.1) 0.058 −0.2 (0.1) 0.174 −0.1 (0.0) 0.040 Model 3 −0.1 (0.1) 0.244 −0.1 (0.1) 0.085 −0.1 (0.1) 0.258 −0.1 (0.0) 0.074 HADS-D
Model 1 −0.5 (0.1) <0.001 −0.7 (0.1) <0.001 −1.1 (0.1) <0.001 −0.3 (0.0) <0.001 Model 2 −0.3 (0.1) <0.001 −0.4 (0.1) <0.001 −0.7 (0.1) <0.001 −0.2 (0.0) <0.001 Model 3 −0.2 (0.1) <0.001 −0.3 (0.1) <0.001 −0.7 (0.1) <0.001 −0.2 (0.0) <0.001 HADS
Model 1 −0.5 (0.1) <0.001 −0.8 (0.1) <0.001 −1.1 (0.2) <0.001 −0.4 (0.0) <0.001 Model 2 −0.3 (0.1) 0.002 −0.5 (0.2) <0.001 −0.9 (0.2) <0.001 −0.3 (0.1) <0.001 Model 3 −0.3 (0.1) 0.008 −0.5 (0.1) <0.001 −0.8 (0.2) <0.001 −0.3 (0.1) <0.001 General health
Model 1 0.3 (0.2) 0.154 0.5 (0.3) 0.135 0.3 (0.5) 0.500 0.2 (0.1) 0.128 Model 2 0.3 (0.3) 0.259 0.4 (0.4) 0.242 0.5 (0.5) 0.358 0.2 (0.2) 0.145 Model 3 0.2 (0.3) 0.463 0.3 (0.4) 0.355 0.3 (0.5) 0.542 0.2 (0.2) 0.306 General vision
Model 1 0.9 (0.3) <0.001 1.5 (0.4) <0.001 1.6 (0.6) 0.004 0.6 (0.1) <0.001 Model 2 1.0 (0.3) 0.001 1.4 (0.4) <0.001 1.6 (0.6) 0.007 0.8 (0.2) <0.001 Model 3 0.7 (0.3) 0.012 1.2 (0.4) 0.002 1.2 (0.6) 0.030 0.6 (0.2) <0.001 Ocular pain
Model 1 0.1 (0.3) 0.597 0.1 (0.4) 0.859 0.1 (0.6) 0.872 0.1 (0.1) 0.685 Model 2 0.4 (0.3) 0.222 0.1 (0.5) 0.883 0.5 (0.6) 0.428 0.2 (0.2) 0.303 Model 3 0.2 (0.3) 0.590 −0.1 (0.4) 0.798 0.3 (0.6) 0.662 0.1 (0.2) 0.732 Near activity
Model 1 2.0 (0.4) <0.001 3.0 (0.6) <0.001 3.1 (0.8) <0.001 1.3 (0.2) <0.001 Model 2 1.5 (0.4) <0.001 2.2 (0.6) <0.001 2.5 (0.9) 0.004 1.2 (0.3) <0.001 Model 3 1.1 (0.4) 0.006 1.8 (0.6) 0.001 1.9 (0.8) 0.017 0.9 (0.2) <0.001 Distance activity
Model 1 1.7 (0.3) <0.001 2.7 (0.5) <0.001 3.5 (0.8) <0.001 1.1 (0.2) <0.001 Model 2 1.3 (0.4) 0.003 2.1 (0.6) <0.001 3.3 (0.9) <0.001 1.2 (0.3) <0.001 Model 3 0.9 (0.4) 0.030 1.7 (0.5) 0.002 2.6 (0.8) <0.001 0.9 (0.2) <0.001 Social function
Model 1 0.5 (0.3) 0.067 1.0 (0.4) 0.021 1.1 (0.6) 0.069 0.4 (0.2) 0.019 Model 2 0.7 (0.3) 0.049 1.2 (0.5) 0.013 1.8 (0.7) 0.008 0.6 (0.2) 0.002 Model 3 0.4 (0.3) 0.205 0.9 (0.4) 0.035 1.3 (0.6) 0.032 0.4 (0.2) 0.020 Mental health
Model 1 0.1 (0.3) 0.853 −0.1 (0.4) 0.834 −0.1 (0.6) 0.847 −0.0 (0.2) 0.984 Model 2 0.3 (0.3) 0.337 0.1 (0.5) 0.766 0.9 (0.7) 0.177 0.2 (0.2) 0.267 Model 3 0.2 (0.3) 0.617 −0.0 (0.5) 0.956 0.6 (0.6) 0.350 0.1 (0.2) 0.577 Role difficulties
Model 1 0.0 (0.3) 0.985 −0.1 (0.5) 0.880 −0.4 (0.8) 0.622 −0.0 (0.2) 0.865 Model 2 0.8 (0.4) 0.066 0.7 (0.6) 0.266 0.7 (0.9) 0.387 0.5 (0.3) 0.066 Model 3 0.5 (0.4) 0.200 0.4 (0.6) 0.451 0.3 (0.8) 0.676 0.3 (0.3) 0.225 Dependency
Model 1 0.6 (0.3) 0.074 −0.2 (0.5) 0.773 0.4 (0.7) 0.636 0.2 (0.2) 0.304 Model 2 0.5 (0.4) 0.217 −0.7 (0.6) 0.253 0.7 (0.8) 0.397 0.1 (0.3) 0.618 Model 3 0.5 (0.4) 0.288 −0.7 (0.6) 0.230 0.7 (0.9) 0.406 0.1 (0.3) 0.716 Colour vision
Model 1 0.8 (0.3) 0.006 1.3 (0.5) 0.007 1.9 (0.7) 0.006 0.6 (0.2) 0.001 Model 2 0.9 (0.4) 0.024 1.3 (0.6) 0.016 2.4 (0.8) 0.002 0.8 (0.2) <0.001 Model 3 0.7 (0.4) 0.080 1.1 (0.5) 0.036 2.1 (0.8) 0.007 0.7 (0.2) 0.005 Peripheral vision
Model 1 −0.2 (0.3) 0.489 0.0 (0.4) 0.965 −0.2 (0.6) 0.723 −0.1 (0.2) 0.641 Model 2 0.3 (0.3) 0.373 0.6 (0.5) 0.189 1.2 (0.7) 0.066 0.3 (0.2) 0.098 Model 3 0.0 (0.3) 0.885 0.3 (0.4) 0.417 0.8 (0.6) 0.215 0.2 (0.2) 0.414
Continued
on September 22, 2020 by guest. Protected by copyright.
In recent years, increasing attention has been paid to QoL. Because a human being is a whole unit, for life-long chronic diseases such as glaucoma, we cannot focus only on the eyes and neglect the rest of the body. Glaucoma may affect a patient’s QoL in several ways, through the psychological effects of diagnosis (eg, anxiety, depression, fear of blindness, fear of effects on other family members), the visual effects of glaucoma (eg, decreased visual field), the potential side effects of treatment (medical or surgical), and the financial effects (eg, cost of visits and treatment, loss of income because of absenteeism from work). The vision-related QoL of patients with glaucoma in different countries can be compared by using NEI VFQ-25. The composite score of Mandarin Chinese subjects in our study was
70.6±15.4, slightly higher than that of Taiwan Chinese (69.2±20.4)29and Japanese participants (69.8±1.9),30but lower than that of Greek (81.7±14.7)31 and Nigerian individuals (85.2±16.1).32 This indicates that, in China, patients with glaucoma have a moderate vision-related QoL. Moreover, the extent of visual field damage could influence QoL. In the present study, the NEI VFQ-25 composite scores in the mild, moderate and severe groups were 76.1±12.8, 69.5±14.1 and 64.6±17.2, respect-ively. In a Nigerian population, the corresponding scores were 92.0±6.8, 89.3±10.4 and 74.3±21.1.32 A study in Belgium found that the global NEI VFQ-25 score dropped from 90.7±8.1 to 86.1±8.7 to 71.5±19.3 in early, moderate and advanced POAG groups.33 Thesefindings demonstrate that vision-related QoL decreases with Table 3 Continued
Knowledge of glaucoma Compliance Habits Total comprehension
Subscale
βCoefficient (SE)
p Value
βCoefficient (SE)
p Value
βCoefficient (SE)
p Value
βCoefficient (SE)
p Value
Composite score
Model 1 0.6 (0.2) 0.003 0.9 (0.3) 0.008 1.0 (0.5) 0.032 0.4 (0.1) 0.002 Model 2 0.7 (0.3) 0.005 0.8 (0.3) 0.016 1.4 (0.5) 0.004 0.5 (0.1) <0.001 Model 3 0.5 (0.2) 0.045 0.6 (0.3) 0.051 1.1 (0.5) 0.019 0.4 (0.1) 0.006
Comprehension of glaucoma, compliance, habits and total comprehension were independent variables in the models. Model 1: crude; model 2: adjustment for age, gender, educational level, living status, marital status, duration of glaucoma, type of glaucoma, medication, past laser treatment and past surgical treatment; model 3: further adjustment for best corrected visual acuity of worse-seeing eye, higher intraocular pressure in both eyes, and mean deviation of visual field in worse-seeing eye based on model 2.
HADS, Hospital Anxiety and Depression Scale; HADS-A, Hospital Anxiety and Depression Scale-Anxiety; HADS-D, Hospital Anxiety and Depression Scale-Depression; NEI VFQ-25, 25-item National Eye Institute Visual Function Questionnaire.
Figure 1 The association between level of comprehension and the subscores of the Hospital Anxiety and Depression Scale (HADS), HADS-Anxiety (HADS-A) and
HADS-Depression (HADS-D) in Chinese patients with glaucoma. As the level of comprehension increased, the scores of HADS-D and total HADS decreased significantly (F=65.371, p<0.001; F=25.302, p<0.001, respectively), while the change in HADS-A was not significant (F=0.638, p=0.529).
Figure 2 The association between level of comprehension and four of the subscores of the 25-item National Eye Institute Visual Function Questionnaire (NEI VFQ-25) in Chinese patients with glaucoma. As the level of comprehension increased, the subscores of general vision (F=8.372, p<0.001), near activity (F=16.607, p<0.001), far activity (F=12.884, p<0.001) and the NEI VFQ-25 composite score (F=3.821, p<0.05) increased dramatically.
on September 22, 2020 by guest. Protected by copyright.
visualfield progression. In the current study, after differ-ent levels were adjusted for variables, the extdiffer-ent of com-prehension was always an independent factor positively related to the NEI VFQ-25 composite score (β=0.4, p=0.002; β=0.5, p<0.001; β=0.4, p=0.006). This score increased from 68.52 in the low comprehension group to 73.20 in the high comprehension group. Our results suggest that early diagnosis and intervention is essential for patients with glaucoma, and that educating patients can help them establish good habits that might benefit their QoL.
After being told of their glaucoma diagnosis, 34% of patients reported at least a moderate fear of blindness.2 It has been suggested that more attention should be given to reducing fear of blindness in patients with glau-coma at diagnosis and over time.2 Our results showed that glaucoma comprehension was lowest at the early stage of diagnosis. Also, habits had the lowest score among the three subtypes, which significantly correlated with both HADS-D and the NEI VFQ-25 composite score. Thus, instead of merely informing the patients of their diagnosis, clinicians should enhance patients’ knowledge of this disease and thereby reduce undue worry and concern over the glaucoma diagnosis,34 and help them to establish appropriate habits. Various styles of health education could have a positive effect on relieving the fear of patients.34 In existence for over 17 years, the SGC is a successful model for the education of patients with glaucoma.22 Our previous report and the current study demonstrated significant differences in basic glaucoma knowledge between SGC members and general patients with glaucoma; SGC members had much better comprehension of glaucoma and self-management.21 It may be that people who joined the SGC had a more positive outlook on life and were more motivated to manage their condition. Nevertheless, in
the absence of other methods, the SGC might be an effective model for improving patients’knowledge of the disease and compliance with treatment.
Our findings also provided epidemiological data on anxiety and depression in Chinese patients with glau-coma. The prevalence of anxiety in Chinese patients with glaucoma (11.2%) was comparable to that of Japan (13.0%)4 and Turkey (9.6–14.0%).6 35 However, the prevalence of depression in our study (26.0%) was higher than that of Japan (10.9%)4 and Turkey (24.7%),35 and lower than that found in another study from Turkey (57.0%).6
This study was an initial exploration of the psycho-logical status and QoL of Chinese patients with glaucoma and the potential ways to improve them. Caution should be exercised when interpreting thefindings because of a number of limitations. First, this was a cross-sectional rather than a longitudinal study. Although the conclu-sions drawn were based on multivariate linear regression with adjustment for possible confounding factors, further large-scale studies with long-term follow-up should be performed to confirm these findings of associations between glaucoma comprehension, depression and QoL. Second, all patients in this study were recruited from a single academic eye institute, and all were of Chinese Han ethnicity. This might have caused selection bias and our results might not be generalisable to the entire adult Chinese population with glaucoma. Third, to further investigate the influence of comprehension, we cate-gorised the comprehension scores into three levels. This artificial classification might have led to bias. In addition, although this study examined several factors that might affect psychological status and QoL, by no means were all potential variables included. In an effort to address these limitations, the study covered a relatively large, homoge-neous sample with a broad age range and applied Table 4 Comparison of the HADS-D score and NEI VFQ-25 composite score by different levels of the subtypes of
comprehension
Subtype of
comprehension N HADS-D p Value
p1 Value
p2 Value
p3 Value
NEI VFQ-25 composite score
p Value
p1 Value
p2 Value
p3 Value
Knowledge of glaucoma
0.000 0.000 0.000 1.000 0.292 1.000 0.363 1.000
Low 234 9.06±4.00 69.64±15.85
Moderate 169 5.89±3.72 70.83±15.23
High 97 5.48±3.67 72.52±14.40
Compliance 0.000 0.001 0.000 0.000 0.139 0.527 0.142 1.000
Low 105 9.31±4.11 68.21±15.59
Moderate 230 7.61±4.18 70.66±14.92
High 165 5.56±3.52 72.02±15.77
Habits 0.000 0.000 0.000 0.327 0.001 0.000 0.066 0.276
Low 175 9.38±4.18 67.40±16.54
Moderate 140 6.56±3.81 73.95±13.82
High 185 5.86±3.65 71.08±14.82
p Value: ANOVA; further compared by Bonferroni: p1: low versus moderate; p2: low versus high; p3: moderate versus high.
HADS-D, Hospital Anxiety and Depression Scale-Depression; NEI VFQ-25, 25-item National Eye Institute Visual Function Questionnaire.
on September 22, 2020 by guest. Protected by copyright.
rigorous quality control procedures to ensure high par-ticipant response rates and quality data.
In summary, for a typical physical disease such as glau-coma, patients’ comprehension and understanding of their condition might be independently associated with psychological disturbance and vision-related QoL. Comprehension of glaucoma could be improved by educa-tion, which would help patients alleviate their psycho-logical disturbance and enhance their vision-related QoL. Doctors should also pay attention to the patients’ compre-hension of glaucoma through better education and com-munication with patients regarding their disease and effective guidance over the course of their treatment.
AcknowledgementsThe authors wish to thank Dr Jian Gao for his valuable help with data statistics and interpretation.
Contributors XMK: collection and analysis of data, drafting the manuscript and final approval of the version to be published. WQZ: collection and interpretation of data and final approval of the version to be published. JH: interpretation of data and final approval of the version to be published. XHS: conception and design of the study, revising the article critically for important intellectual content and final approval of the version to be published.
Funding The authors were supported by the National Science and Technology Infrastructure Program (No. 2012YQ12008003) and Shanghai Health Systems Appropriate Technology Projects (2013SY058).
Competing interests None.
Ethics approval The ethics committee of the Eye and ENT Hospital, Shanghai Medical College approved this study.
Provenance and peer review Not commissioned; externally peer reviewed.
Data sharing statement No additional data are available.
Open Access This is an Open Access article distributed in accordance with the Creative Commons Attribution Non Commercial (CC BY-NC 3.0) license, which permits others to distribute, remix, adapt, build upon this work non-commercially, and license their derivative works on different terms, provided the original work is properly cited and the use is non-commercial. See: http:// creativecommons.org/licenses/by-nc/3.0/
REFERENCES
1. Kingman S. Glaucoma is second leading cause of blindness globally.Bull World Health Organ2004;82:887–8.
2. Janz NK, Wren PA, Guire KE,et al. Fear of blindness in the Collaborative Initial Glaucoma Treatment Study: patterns and correlates over time.Ophthalmology2007;114:2213–20. 3. Jampel HD, Frick KD, Janz NK,et al. Depression and mood
indicators in newly diagnosed glaucoma patients.Am J Ophthalmol
2007;144:238–44.
4. Mabuchi F, Yoshimura K, Kashiwagi K,et al. High prevalence of anxiety and depression in patients with primary open-angle glaucoma.J Glaucoma2008;17:552–7.
5. Wang SY, Singh K, Lin SC. Prevalence and predictors of depression among participants with glaucoma in a nationally representative population sample.Am J Ophthalmol2012;154:436–44.e2. 6. Tastan S, Iyigun E, Bayer A,et al. Anxiety, depression, and quality
of life in Turkish patients with glaucoma.Psychol Rep
2010;106:343–57.
7. Mabuchi F, Yoshimura K, Kashiwagi K,et al. Risk factors for anxiety and depression in patients with glaucoma.Br J Ophthalmol
2012;96:821–5.
8. Zhou C, Qian S, Wu P,et al. Anxiety and depression in Chinese patients with glaucoma: sociodemographic, clinical, and self-reported correlates.J Psychosom Res2013;75:75–82.
9. WHOQOL group. Study protocol for the World Health Organization project to develop a Quality of Life assessment instrument (WHOQOL).Qual Life Res1993;2:153–9.
10. Spaeth G, Walt J, Keener J. Evaluation of quality of life for patients with glaucoma.Am J Ophthalmol2006;141:S3–14.
11. Lee BL, Wilson MR. Health-related quality of life in patients with cataract and glaucoma.J Glaucoma2000;9:87–94.
12. Sherwood MB, Garcia-Siekavizza A, Meltzer MI,et al. Glaucoma’s impact on quality of life and its relation to clinical indicators. A pilot study.Ophthalmology1998;105:561–6.
13. Wilson MR, Coleman AL, Yu F,et al. Functional status and well-being in patients with glaucoma as measured by the Medical Outcomes Study Short Form-36 questionnaire.Ophthalmology
1998;105:2112–16.
14. Gutierrez P, Wilson MR, Johnson C,et al. Influence of
glaucomatous visual field loss on health-related quality of life.Arch Ophthalmol1997;115:777–84.
15. Nelson P, Aspinall P, Papasouliotis O,et al. Quality of life in glaucoma and its relationship with visual function.J Glaucoma
2003;12:139–50.
16. Wu P, Xi S, Xia H,et al. Survey on vision-related quality of life and self-management among patients with glaucoma.J Glaucoma
2014;23:75–80.
17. Ibrahim NA, Oludara MA. Socio-demographic factors and reasons associated with delay in breast cancer presentation: a study in Nigerian women.Breast2012;21:416–18.
18. Das BC, Khan ZR. Periampullary carcinoma: better prognosis with early pre-stenting referral to surgery.Mymensingh Med J
2013;22:110–15.
19. Renault NK, Howell RE, Robinson KS,et al. Qualitative assessment of the emotional and behavioural responses of haemophilia A carriers to negative experiences in their medical care.Haemophilia
2011;17:237–45.
20. Bettin P, Di Matteo F. Glaucoma: present challenges and future trends.Ophthalmic Res2013;50:197–208.
21. Chen X, Chen Y, Sun X. Notable role of glaucoma club on patients’ knowledge of glaucoma.Clin Experiment Ophthalmol2009;37:590–4. 22. Kong X, Chen X, Sun X,et al. Glaucoma club: a successful model
to educate glaucoma patients.Clin Experiment Ophthalmol
2009;37:634–6.
23. Zigmond AS, Snaith RP. The hospital anxiety and depression scale.
Acta Psychiatr Scand1983;67:361–70.
24. Wang W, Chair SY, Thompson DR,et al. A psychometric evaluation of the Chinese version of the Hospital Anxiety and Depression Scale in patients with coronary heart disease.J Clin Nurs2009;
18:1908–15.
25. Martin CR, Thompson DR, Chan DS. An examination of the psychometric properties of the Hospital Anxiety and Depression Scale in Chinese patients with acute coronary syndrome.Psychiatry Res2004;129:279–88.
26. Chan CW, Wong D, Lam CL,et al. Development of a Chinese version of the National Eye Institute Visual Function Questionnaire (CHI-VFQ-25) as a tool to study patients with eye diseases in Hong Kong.Br J Ophthalmol2009;93:1431–6.
27. Wang CW, Chan CL, Jin HY. Psychometric properties of the Chinese version of the 25-item National Eye Institute Visual Function Questionnaire.Optom Vis Sci2008;85:1091–9.
28. Stryker JE, Beck AD, Primo SA,et al. An exploratory study of factors influencing glaucoma treatment adherence.J Glaucoma
2010;19:66–72.
29. Lin JC, Chie WC. Psychometric validation of the Taiwan Chinese version of the 25-Item National Eye Institute Visual Functioning Questionnaire.J Eval Clin Pract2010;16:619–26.
30. Suzukamo Y, Oshika T, Yuzawa M,et al. Psychometric properties of the 25-item National Eye Institute Visual Function Questionnaire (NEI VFQ-25), Japanese version.Health Qual Life Outcomes
2005;3:65.
31. Labiris G, Katsanos A, Fanariotis M,et al. Vision-specific quality of life in Greek glaucoma patients.J Glaucoma2010;
19:39–43.
32. Onakoya AO, Mbadugha CA, Aribaba OT,et al. Quality of life of primary open angle glaucoma patients in Lagos, Nigeria: clinical and sociodemographic correlates.J Glaucoma2012;21:287–95. 33. Wolfram C, Lorenz K, Breitscheidel L,et al. Health- and
vision-related quality of life in patients with ocular hypertension or primary open-angle glaucoma.Ophthalmologica2013;229:227–34. 34. Rendell J. Effect of health education on patients’beliefs about
glaucoma and compliance.Insight2000;25:112–18.
35. Cumurcu T, Cumurcu BE, Celikel FC,et al. Depression and anxiety in patients with pseudoexfoliative glaucoma.Gen Hosp Psychiatry
2006;28:509–15.
on September 22, 2020 by guest. Protected by copyright.