On the Use of Discrete Wavelets in Implementing Defect Detection
System for Texture Images
Gintarė Vaidelienė, Jonas Valantinas, Petras Ražanskas
Department of Applied Mathematics, Kaunas University of Technology, Studentu St 50, LT-51368 Kaunas, Lithuania,
e-mail: [email protected], [email protected], [email protected]
http://dx.doi.org/10.5755/j01.itc.45.2.12654
Abstract. In this paper, a novel wavelet-based approach to the detection of defects in grey-level texture images is proposed. This new approach (system) explores specific properties of the discrete wavelet transform (DWT), evaluates the statistical analysis results associated with well-defined and task-oriented subsets of DWT spectral coefficients, and generates defect detection criteria which, in their turn, evaluate many-sided nature of potential defects in texture images and leave space for controlling the risk, i.e. for controlling the percentage of false positives and/or false negatives in a particular class of texture images. The experimental results demonstrating the use of the proposed system for the visual inspection of ceramic tiles, obtained from the real factory environment, and textile fabric scraps are also presented.
Keywords: texture images; defect detection; discrete wavelet transforms; statistical data analysis; automatic visual inspection.
1. Introduction
Without any doubt, visual inspection constitutes a substantial part of quality control in industry. For many decades, this job has been relied upon human inspectors. However, the high cost and low efficiency of human visual inspection has led to the development of online visual-based systems capable to enhance not only the quality control but also the marketing of the products.
Detection of defects in texture surfaces, such as steel plates, weldment, ceramic tiles, fabric, etc., is an important area of automated industrial inspection systems. Numerous methods and approaches have been proposed for performing this task [1-5]. With reference to many texture analysis survey papers, the texture image analysis techniques, used for visual defect inspection, can be categorized as follows: statistical approach, structural approach, filter-based approach and the model-based approach.
The statistical texture analysis methods concen-trate on the spatial distribution values. Quite a number of statistical texture features have been proposed, namely: histogram statistics (mean, standard devia-tion, median, correlation coefficient, various metrics, etc.), co-occurrence matrices, autocorrelation, local binary patterns, etc., [6-10]. The statistical analysis techniques are characterized by low cost, invariance to
translation and rotation. Among the shortcomings of the approach one can mention the great number of grey levels in a texture image and irregular arrangement of textural elements.
In structural texture inspection approach, texture is characterized by texture elements (primitives) and the spatial arrangement of these primitives. Firstly, the texture primitives are extracted, secondly, the so-called spatial placement rules are modelled and generalized. This works well when analysing artificial textures. However, to analyse the images with inconspicuous textural rules, the structural method cannot effectively obtain the textural primaries and describe their arrangement rules. Some interesting results on the matter can be found in [11-13].
above techniques is their high dependence on the repetitive and regular nature of texture images.
The model-based methods include, among many others, fractal models, autoregressive models, random field models, texem models, etc. Despite the novelty and originality of the ideas employed, these methods have limited areas of application. The more detailed information on the latter approach can be found in [20-24].
In the last decade, new achievements in the area distinguish themselves with wide usage of discrete wavelet transforms and application of recently developed image processing techniques (edge and corner detectors, morphological operations, optimal Gabor wavelet filters, artificial neural networks, etc.) [25-30].
In this paper, we present a new defect detection system for grey-level texture images. The characteristic feature of the proposed system is the usage of different scanning filters (two-dimensional Haar wavelets) which are applied in sequence to the texture image under investigation.
The rest of this paper is organized as follows. In Section 2, the necessary theoretical background used to developing the above defect detection system are presented, namely: discrete Haar wavelet transform with its properties and computational schemes, statistical analysis techniques applied to texture images in the Haar wavelet domain and generation of the parameterized defect detection criteria for grey-level texture images. In Section 3, the experimental analysis results, including two classes of texture images (ceramic tiles and fabric scraps, both taken from real industrial environment) are presented and discussed. Some commentary on the applicability and flexibility of the developed defect detection system are given in Section 4.
2. Implementing defect detection system for
texture images
The newly developed defect detection system for texture images explores specific properties of the discrete Haar wavelet transform, not only generates defect detection criteria but also leaves space for ensuring flexibility of these criteria.
The choice of Haar wavelets was governed, mainly, by two factors: firstly, Haar wavelets are “square-shaped”, i.e. are not continuous. This fact is an advantage when analysing signals (images) with sudden transitions (contrast changes), and the defect detection process is the very case; secondly, the discrete Haar wavelet transform is fully localized in space (Subsection 2.2), and this is weighty for locating defects in the defective texture images.
2.1. Computing the discrete Haar wavelet transform
The one-dimensional discrete wavelet transform (DWT) itself represents an iterative procedure, each iteration of the DWT applies the scaling function (the low-frequency filter) and the wavelet function (the high-frequency filter) to the data input. If the original digital signal X( (0)X X(1) X N( 1))T has
N
(N2 ,n nN) values, then, on the i-th ( {1, 2, , }
i n ) iteration, two intermediate data vectors:
( ) ( ) ( ) ( ) ( ) 0 1 2 2 1
( n i ) ,
i i i i i T
S s s s s
( ) ( ) ( ) ( ) ( ) 0 1 2 2 1
( n i ) ,
i i i i i T
D d d d d
representing the result of application of the low-frequency filtering coefficients and the high-low-frequency filtering coefficients to (i1)
S (i{1, 2, , })n , respectively, are obtained (here, (0)
S X , i.e. (0) ( )
k
s X k , for all k0,1, ,N1).
Theoretically, the i-th (i{1, 2, , }n ) iteration of the above computational procedure can be realized using the DWT matrix TDWT of order (n i 1), i.e.
( ) ( 1)
( )
( 1) .
i i
DWT i
S
T n i S
D
(1)
Here we observe that ( ) ( ) 0
( )
n n
S s and
( ) ( ) 0
( )
n n
D d .
The internal structure of the matrix ( 1)
DWT DWT
T T n i , i{1, 2, , }n , depends, mainly, on the coefficient values of scaling and wavelet functions of a particular DWT. For instance, in the case of the discrete Haar wavelet transform (HT), the scaling function coefficients are -
0 1 2
h and h11 2, while the wavelet function
coefficient values are - g0h11 2 and
1 0 1 2
g h . So, the HT matrix of size 2n2n takes the form:
1 1 0 0 0 0 0 0 0 1 1 0 0 0
0 0 0 0 0 1 1 1
( ) ,
1 1 0 0 0 0 0 2
0 0 1 1 0 0 0
0 0 0 0 0 1 1 HT T n
where n1, 2, .
( ) ( ) ( 1) ( 1) ( 2) ( 2) ( 2) ( 2)
0 0 0 1 0 1 2 3
(1) (1) (1)
0 1 2 1
( (0) (1) (2) ( 1))
( ...
) . T
n n n n n n n n
T N
Y Y Y Y Y N
s d d d d d d d
d d d
(2)
The relationship between Y k( ) ( {1, 2, , 1}
k N ) and ( )i j
d ( i{1, 2, , }n , {0,1, , 2n i 1}
j ) is given by: k2n i j ,
provided 1
2n i k 2n i ; in particular, ( ) 0
(0) n Y s . In practice, the discrete HT spectrum Y (expression (2)) of the data vector X of size N2n (
N
n ) is found as follows:
( ) ( 1) ( 1) ( 1) ( 1)
0 2 1 2 1 2 2 1
1
2
i i i i i
k k k k k
s h s h s s s ,
( ) ( 1) ( 1) ( 1) ( 1)
0 2 1 2 1 2 2 1
1
2
i i i i i
k k k k k
d g s g s s s , (3)
for all 0,1, , 2n i 1
k and i{1, 2, , }n . The inverse HT is defined by:
( 1) ( ) ( ) 2
1
2
i i i
k k k
s s d ,
( 1) ( ) ( ) 2 1
1
2
i i i
k k k
s s d , (4)
where k0,1, , 2n i 1 and i{1, 2, , }n .
Also, in order to compute the discrete HT spectrum of a two-dimensional digital image X of size N1N2 ( 2 ,i
n i
N niN,i1, 2) , the one-dimensional HT should be applied N1N2 times, i.e.
2
N times along the first spatial axis and N1 times
along the second spatial axis.
To become familiarized with some other discrete wavelet transforms (Le Gall wavelet transform, Daubechies D4 transform, Cohen-Daubechies-Feauveau (CDF) 9/7, etc.) and their matrices, the reader is referred to (Cohen et al., 1992; Adams and Kossentine, 2000; open internet resources).
2.2. Statistical analysis of defect-free texture images in the Haar spectral domain
Now, let X [ (X m m1, 2)] be a two-dimensional
grey-level texture image of size NN (N2n , N
n ) and let Y [ ( ,Y k k1 2)] be its two-dimensional
discrete HT spectrum.
Consider a wavelet coefficient Y k k( ,1 2) , k1 ,
2 {1, 2, , 1}
k N . Evidently, indices k1 and k2 can
be presented in the form: 1
1 2 1
n i
k j , 2
2 2
n i k
2,
j where i i1, 2{1, 2, , }n ,
1
1 {0,1, , 2 1}
n i
j ,
2
2 {0,1, , 2 1}
n i
j . Also, it can be proved that the coefficient Y k k( ,1 2) is associated with the image
block (1,2)
1 2
[ ( , )] k k
X X m m , where
1 2
1 2
(m m, )Vk Vk
and { 2 ,r 2r 1, , ( 1) 2r 1}
r
i i i
k r r r
V j j j , r1, 2.
In other words, numerical value of Y k k( ,1 2) is
uniquely specified by the pixel values of the block
1 2
(k k, )
X .
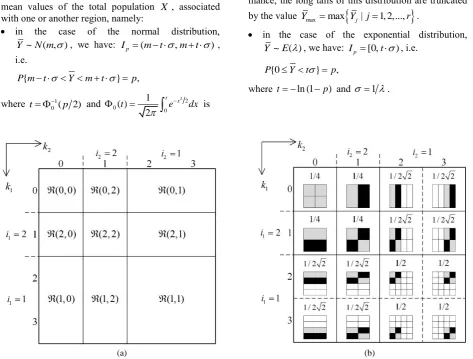
In forming and generating defect detection criteria for texture images, the key point is the partitioning of the whole set of HT spectral coefficients into non-overlapping regions (0, 0) , ( , 0)i1 , (0, )i2 and
1 2
( , )i i
, where i i1, 2{1, 2, , }n (Fig. 1, a).
Numeri-cal values of spectral coefficients Y k k( ,1 2), falling
into a particular region, i.e. characterized by the same index values i1 and i2, are specified uniquely by
non-overlapping image blocks X(k k1,2) which cover the
whole image X [ (X m m1, 2)]. To say more, the
com-putational scheme (“pattern”) for all spectral coeffi-cients, attached to the same region, is one and the same (Fig. 1, b).
Now, suppose {X1,X2, ,Xr} is a collection of defect-free texture images (good samples, randomly selected from some total population X of non-defective texture images) of size NN (N2n ,
N
n ) and { ,Y Y1 2, ,Yr} is the corresponding set of their discrete HT spectra. In implementing the defect detection criteria for texture images, the following algorithmic steps should be realized:
1. For all s1, 2, ,r, compute the mean value of HT spectral coefficients falling into the regions
(0, 0)
, ( , 0)i1 , (0, )i2 and ( , )i i1 2
1 2
( ,i i {1, 2, , })n :
(0, 0) | (0, 0) |
s s
Y Y ,
1
1 1
2 1
1 2 1
0
1
( , 0) | ( , 0) |, 2
n i
s n i s
j
Y i Y k
2 2 2 2 12 2 2
0
1
(0, ) | (0, ) |, 2
n i
s n i s
j
Y i Y k
2 1 1 2 2 12 1 2 1
1 2 2 1 2
0 0
1
( , ) | ( , ) |.
2
n i n i
s n i i s
j j
Y i i Y k k
2. For each region (0, 0), ( , 0)i1 , (0, )i2 and
1 2
( , )i i
( i i1, 2{1, 2, , }n ), using the simple
samples:
1 2
( (0, 0),Y Y(0, 0), ,Yr(0, 0)),
1 1 2 1 1
( ( , 0),Y i Y i( , 0), ,Y ir( , 0)),
1 2 2 2 2
( (0, ),Y i Y(0, ),i ,Yr(0, )),i
1 1 2 2 1 2 1 2
( ( , ),Y i i Y i i( , ), ,Y i ir( , )),
values (random variables) (0,0)Y , Y i( , 0)1 , Y(0, )i2 and Y i i( , )1 2 , representing the same regions of the
total population X.
3. Depending on the type of the distribution (Step 2) and a priori prescribed probability p (
[0.1, 0.99]
p ), evaluate the so-called -intervals (0, 0)
p
I , I ip( , 0)1 , Ip(0, )i2 and I i ip( , )1 2 , for the mean values of the total population X , associated with one or another region, namely:
in the case of the normal distribution, ~ ( , )
Y N m , we have: Ip(m t ,m t ), i.e.
{ } ,
P m t Y m t p
where 1 0( 2)
t p and 0 22 0
1 ( )
2 t
x
t e dx
isthe Laplace function;
in the case of the lognormal distribution, ~ ln ( , )
Y N m , we have: ( t, t) p
I m m , i.e.
{ t t} ,
P m Y m p where 1
0( 2)
t p ; in practice, for better perfor-mance, the long tails of this distribution are truncated by the value Ymaxmax
Yj| j1, 2,...,r
. in the case of the exponential distribution, ~ ( )
Y E , we have: Ip [0,t), i.e.
{0 } ,
P Y t p
where t ln (1p) and 1.
(a) (b)
Figure 1.Discrete Haar wavelet transform (N = 4): (a) Regions of Haar spectral coefficients, characterized by the same computational scheme; (b) Evaluating Haar spectral coefficients (pixel
values, falling into the black area of the image block, are subtracted from those falling into the respective grey area; the algebraic sum then
is multiplied by the scalar, located above)
Table 1. Defect detection criterion for a fixed value of probability p
(0, 0) p
I Ip(0, )n Ip(0,n1)) … Ip(0, )i2 … Ip(0,1) ( , 0)
p
I n Ip( , )n n Ip( ,n n1) … I n ip( , )2 … I np( ,1) ( 1, 0)
p
I n Ip(n1, )n I np( 1,n1) … Ip(n1, )i2 … Ip(n1,1)
… … … …
1
( , 0) p
I i I i np( , )1 I i np( ,1 1) … I i ip( , )1 2 … I ip( ,1)1
… … … …
(1, 0) p
2.3. Generating the defect detection criteria for texture images
Using statistical analysis results (Subsection 2.2), the defect detection criteria (for a particular class of texture images of size 𝑁 × 𝑁, 𝑁 = 2𝑛 , 𝑛 ∈ N), corresponding to a priori prescribed values of the probability p, p[0.1, 0.99], are formed (Table 1).
Now, suppose that Xtest is a test texture image of size 𝑁 × 𝑁 (𝑁 = 2𝑛, 𝑛 ∈ N) and 𝑌
𝑡𝑒𝑠𝑡 is its discrete Haar spectrum. Also, suppose that the probability p, minimizing removal of actually defect-free samples, is fixed. Then, the mean values Ytest(0, 0) , Ytest( , 0)i1 ,
2
(0, ) test
Y i and Ytest( , )i i1 2 are calculated, for all regions (0, 0)
, ( , 0)i1 , (0, )i2 and ( , )i i1 2 ( i i1, 2
{1, 2, , }n ), respectively. Finally, the defect detection criterion, corresponding to the probability p , is selected.
The test texture image 𝑋𝑡𝑒𝑠𝑡 is assumed to be defect-free, provided the total number of calculated mean values falling into the due -intervals (Table 1) is not less than 𝑝(𝑛 + 1)2. Otherwise, the test image
𝑋𝑡𝑒𝑠𝑡 is assumed to be defective.
Manipulating between the values of the probability p, we can increase (decrease) the number of false positives (FP), as well as that of false negatives (FN), i.e. we are able to control the risk boundary.
In some cases, the overall performance of the developed defect detection system can be improved by exploring an appropriately chosen subset of -intervals (Table 1). For instance, the usage of -intervals Ip Ip( , )i i1 2 , with i i1,2{0, ,m m1,..., }n
(1 m n) , does not provide comparison (in the defect detection process) of less than 2m neighbouring pixels of the texture image, in both the vertical and the horizontal directions.
3. Experimental analysis results
The proposed defect detection method (system) for texture images was implemented in MatLab. Compu-ter simulation was performed on a PC with CPU Intel Core i5-4200 U [email protected], 8GB of memory.
To test performance of the system, first of all, we used a set of defect-free ceramic tile images of size 256×256 (100 samples) and a set of defective tile images of size 256×256 (100 samples), obtained from the real factory environment. Some typical samples are presented in Fig. 2.
(a) (b)
Figure 2. Typical samples of ceramic tiles: (a) defect-free texture images; (b) defective texture images
To form defect detection criteria for a priori prescribed values of the probability 𝑝 (Subsection 2.3), 50 defect-free texture images (out of 100) were selected at random. Five experiments were carried out to tune the parameters involved in the defect detection procedure and to evaluate the overall performance of the system in terms of the defect detection success rate (accuracy). For each experiment, 50 defect-free ceramic tile images and 50 defective tile images were selected randomly.
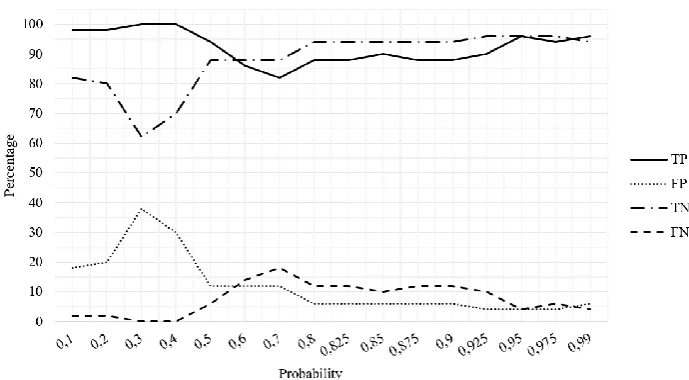
Experimental analysis results, covering the said five experiments and reflecting dependence of the averaged values of the system’s performance parameters TP, FP, TN and FN on the value of probability p ,
[0.1, 0.99]
p , are presented in Fig. 3 (TP – true positives, i.e. the percentage of actually defective images detected as defective; FP – false positives, i.e. the percentage of actually defect-free images detected as defective; TN – true negatives, i.e. the percentage of actually defect-free images detected as defect-free; FN – false negatives, i.e. the percentage of actually defective images detected as defect-free).
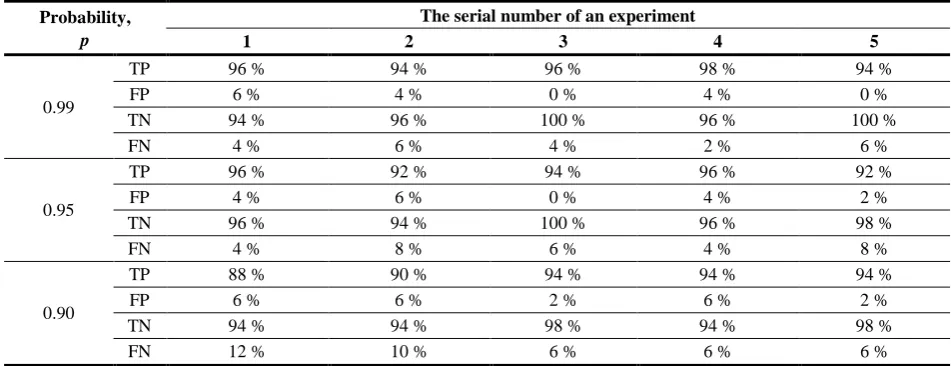
As it can be seen (Fig. 3), the best classification results, in terms of the defect detection success rate (accuracy), are achieved for p[0.95, 0.99] . In particular (Table 2), the accuracy is 0.95-0.98, for p = 0.99, and 0.93-0.98, for p = 0.95.
In Fig. 4, dependence of some secondary performance parameters (specificity = TN/(TN+FP), sensitivity = TP/(TP+FN), accuracy = (TP+TN)/(TP+ TN+FP+FN)) on the value of p, p[0.1, 0.99], is shown. Worth emphasizing, if we are interested in the selection of high quality products (ceramic tiles), i.e. in sorting out all defective tiles, even at the expense of some defect-free tiles, we need to choose the value of p from the interval [0.2, 0.4] , since the corresponding values of sensitivity are close to 1 (Fig. 4).
To illustrate potentiality of the system, a class of textile fabric scraps, from the joint-stock company “Kauno Baltija” (one of the biggest and oldest manufacturers of ladies outwear in Lithuania), has been selected and prepared by hand to obtain texture
Table 2. Classification of ceramic tile images Probability,
p
The serial number of an experiment
1 2 3 4 5
0.99
TP 96 % 94 % 96 % 98 % 94 %
FP 6 % 4 % 0 % 4 % 0 %
TN 94 % 96 % 100 % 96 % 100 %
FN 4 % 6 % 4 % 2 % 6 %
0.95
TP 96 % 92 % 94 % 96 % 92 %
FP 4 % 6 % 0 % 4 % 2 %
TN 96 % 94 % 100 % 96 % 98 %
FN 4 % 8 % 6 % 4 % 8 %
0.90
TP 88 % 90 % 94 % 94 % 94 %
FP 6 % 6 % 2 % 6 % 2 %
TN 94 % 94 % 98 % 94 % 98 %
FN 12 % 10 % 6 % 6 % 6 %
images of size 256×256 (100 defect-free samples and 60 defective samples; Fig. 5). As in the case of ceramic tiles, five experiments were carried out. For each experiment, 30 defect-free fabric images and 30 defective ones were selected randomly. The experimental results (Table 3) were obtained using the criterion values (Section 2.3) IpIp( , )i i1 2 ,
1, 2 {0, 2,3, 4,5, 6, 7,8}
i i . It should be emphasized that, for this particular class of texture images,
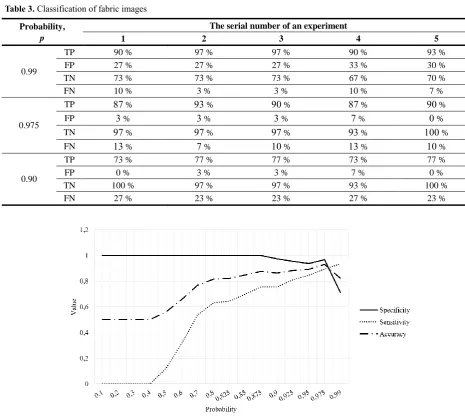
acceptable values of system’s performance parameters (sensitivity, accuracy; Table 3, Fig. 6) are achieved with p[0.975, 0.99]. Also, experimental analysis results show that specificity values remain to be very high for p[0.1, 0.875]. The defect detection rate (accuracy), on an average, equals (Table 3): 0.823, for p = 0.99; 0.931, for p = 0.975; 0.864, for p = 0.90.
(a) (b)
Figure 5. Real fabric samples: (a) defect-free fabric images; (b) defective fabric images
Table 3. Classification of fabric images Probability,
p
The serial number of an experiment
1 2 3 4 5
0.99
TP 90 % 97 % 97 % 90 % 93 %
FP 27 % 27 % 27 % 33 % 30 %
TN 73 % 73 % 73 % 67 % 70 %
FN 10 % 3 % 3 % 10 % 7 %
0.975
TP 87 % 93 % 90 % 87 % 90 %
FP 3 % 3 % 3 % 7 % 0 %
TN 97 % 97 % 97 % 93 % 100 %
FN 13 % 7 % 10 % 13 % 10 %
0.90
TP 73 % 77 % 77 % 73 % 77 %
FP 0 % 3 % 3 % 7 % 0 %
TN 100 % 97 % 97 % 93 % 100 %
FN 27 % 23 % 23 % 27 % 23 %
Finally, we note that comparison of the above results with analogous results obtained using other approaches and other defect detection schemes is complicated enough. The necessary precondition, for the developers, is to explore precisely the same training texture image database. Otherwise, the comparison is of little value. On the other hand, in [31], the defect detection rate (accuracy) in pavement images (using segmentation) is 0.93, in all the samples. The averaged accuracy of recognition algorithms [5], applied to ceramic surface cracks and breaks, equals 0.82 and 0.94, respectively. In [32], the usage of infrared images and artificial neural networks ensures the accuracy of 0.95, for the class of ceramic tile images.
Consequently, the defect detection success rate (accuracy) achieved in our experiments (in the case of ceramic tiles, greater than 0.95, for all experiments; Table 2) allows us to state that the developed Haar wavelet-based defect detection system for texture images is worth attention.
Since the above defect detection system has been developed for real-time applications, the image processing time expenditures cannot be ignored. We have found out that, for both classes of texture images, the time needed to test a single image, for a particular value of the parameter p, equals (on average) 0.028 s. The time is doubled (tripled) if the testing includes two (three) values of p.
These values reflect the computational complexity of the testing process, associated with a single test image 𝑋𝑡𝑒𝑠𝑡 of size NN (N2n, nN), which includes finding the discrete Haar spectrum 𝑋𝑡𝑒𝑠𝑡 of
test
X , computation of averaged values Ytest( , )i i1 2 for each region test( , )i i1 2 (i i1, 2{0,1, , }n ) and testing
averaged values Ytest of falling into corresponding sigma intervals Ip, and turns out to be of the order
O(9𝑁2).
In connection with this, let us note that generation of the defect detection criteria, for a particular class of texture images, is performed at a preliminary stage of the whole defect detection process, and its computa-tional complexity is of little value. In our case (Section 3), the time expenditures, associated with this stage (for a fixed value of probability p ), equal 3.932 s.
4. Conclusion
In this paper, a novel wavelet-based defect detection system for texture images is proposed. The proposed system (approach) explores space localization properties of the two-dimensional discrete Haar wavelet transform. The characteristic feature of the approach is simultaneous application of different scanning (Haar wavelet) filters to texture images. The latter circumstance provides the developer with the possibility to construct parameter dependent decision
criteria. The test texture image, falling into a particular class of texture images, is assumed to be defect-free, for a fixed value of probability (parameter) p, if and only if a priori prescribed percentage of values of the decision criterion are satisfied.
The experimental analysis results, demonstrating the use of the proposed defect detection system for the visual inspection of ceramic tiles obtained from the real factory environment, showed that the detection success rate (accuracy) of the system for this particular class of texture images is 0.95-0.98, provided the value of the probability p equals 0.99. When compared to other approaches, the proposed system outperforms them in more than 4 %. Besides, the single test image processing time, on an average, equals 0.028 s.
In the case of fabric scraps inspection, the defect detection accuracy is quite acceptable and equals 0.931, the value of probability being 0.975.
Finally, let us observe that, for a concrete class of texture images, the task-oriented adaptation of the proposed system is necessary. The nature of texture images, falling into one or the other class, cannot be ignored, i.e. in each case not only numerical values of the parameter p but also the subsets of sigma intervals (criterion for testing) should be selected properly.
In the short term, similar research concerning applicability of discrete wavelet transforms of higher orders (Le Gall, Daubechies, etc.), as well as analysis of defect localization aspects, is supposed.
References
[1] V. Lebrun. Quality Control of Ceramic Tiles By Machine Vision. Flaw Master 3000, Surface Inspection Ltd., 2001.
[2] A. Kumar. Neural network based detection of local textile defects. Pattern Recognition, 2003, Vol. 36, No. 7, 1645-1659.
[3] M. H. Karimi, D. Asemani. Surface defect detection in tiling industries using digital image processing methods: analysis and evaluation. ISA Transactions, 2014, Vol. 53, No. 3, 834-844.
[4] B.-Keun Kwon, J.-S. Won, D.-J. Kang. Fast defect detection for various types of surfaces using random forest with VOV features. International Journal of Precision Engineering and Manufacturing, 2015, Vol. 16, No. 5, 965-970.
[5] S. Chen, B. Lin, X. Han, X. Liang. Automated ins-pection of engineering ceramic grinding surface damage based on image recognition. International Journal of Advanced Manufacturing Technology, 2013, Vol. 66, Issue 1, 431-443.
[6] R. M. Haralick, K. Shanmugam, I. H. Dinstein. Textural features for image classification. IEEE Transaction on Systems, Man, and Cybernetics, 1973, Vol. SMC-3, No. 6, 610-621.
co-occurrence matrices. Image and Vision Computing, 2000, Vol. 18, No. 6, 543-553.
[8] Y. Huang, K. Chan. Texture decomposition by harmonics extraction from higher order statistics. IEEE Transactions on Image Processing, 2004, Vol. 13, No. 1, 1-14.
[9] A. Gururajan, H. Sari-Sarraf, E. F. Hequet. Statis-tical approach to unsupervised defect detection and multiscale localization in two texture images. Optical Engineering, 2008, Vol. 47, No. 2, 027202.
[10] D. Popescu, R. Dobrescu, M. Nicolae. Texture classification and defect detection by statistical feature.
International Journal of Circuits, Systems and Signal Processing, 2007, Vol. 1, No. 1, 79-84.
[11] J. Chen, A. K. Jain. A structural approach to identify defects in textural images. In: Proceedings of IEEE International Conference on Systems, Man and Cyber-netics, Beijing, 1988, pp. 29-32.
[12] W. Wen, A. Xia. Verifying edges for visual inspection purposes. Pattern Recognition Letters, 1999, Vol. 20, No. 3, 315-328.
[13] B. Mallick-Goswami, A. Datta. Detecting defects in fabric with laser-based morphological image process-ing. Textile Research Journal, 2000, Vol. 70, No. 9, 758-762.
[14] A. Kumar, G. Pang. Defect detection in textured ma-terials using optimized filters. IEEE Transactions on System, Man, and Cybernetics-Part B: Cybernetics, 2002, Vol. 32, No. 5, 553-570.
[15] W. Zhijie, C. Junjie, L. Xiuping, Y. Shihui. Fabric defects detection using adaptive wavelets.
Internatio-nal JourInternatio-nal of Clothing Science and Technology, 2014, Vol. 26, No. 3, 202-211.
[16] C. Chan, G. Pang. Fabric defect detection by Fourier analysis. IEEE Transactions on Industry Applications, 2000, Vol. 36, No. 5, 1267-1276.
[17] D. Tsai, T. Huang. Automated surface inspection for statistical textures. Image and Vision Computing, 2003, Vol. 21, 307-323.
[18] A. Kumar, G. Pang. Defect detection in textured materials using Gabor filters. IEEE Transactions on Industry Applications, 2002, Vol. 38, No. 2, 425-440. [19] D. Tsai, C. Lin, K. Huang. Defect detection in
coloured texture surfaces using Gabor filters. Imaging Science Journal, 2005, Vol. 53, No. 1, 27-37.
[20] S. Li. Markov Random Filed Modeling in Image Analysis. Springer, 2001.
[21] X. Xie, M. Mirmehdi. Localising surface defects in random colour textures using multiscale texem
analysis in image eigenchannels. In: Proceedings of the 12th IEEE International Conference on Image Processing, 2005, Vol. 3, pp. 1124-1127.
[22] X. Xie, M. Mirmehdi. TEXEM: Texture exemplars for defect detection on random textured surfaces. IEEE Transactions on Pattern Analysis and Machine Intelligence, 2007, Vol. 29, No. 8, 1454-1464. [23] M. Hanmandlu, D. Choudhury, S. Dash. Detection
of defects in fabrics using topothesy fractal dimension features. Signal, Image and Video Processing, 2015, Vol. 9, No. 7, 1521-1530.
[24] G.-H. Hu, G.-H. Zhang, Q.-H. Wang. Automated defect detection in textured materials using wavelet domain hidden Markov models. Optical Engineering, 2014, Vol. 53, No. 9, 093107.
[25] F. S. Najafabadi, H. Pourghassem. Corner defect detection based on dot product in ceramic tile images. In: IEEE 7th International Colloquium on Signal Processing andits Application, 2011, pp. 293-297. [26] S. C. Kim,T. J. Kang. Texture classification and
seg-mentation using wavelet packet frame and Gaussian mixture model. Pattern Recognition, 2007, Vol. 40, No. 4, 1207-1221.
[27] W. K. Wong, C. W. M. Yuen, D. D. Fan, L. K. Chan, E. H. K. Fung. Stitching defect detection and classification using wavelet transform and BP neural network. Expert Systems with Applications, 2009, Vol. 36, No. 2, 3845-3856.
[28] K. L. Mak, P. Peng, K. F. C. Yiu. Fabric defect detection using morphological filters. Image and Vision Computing, Vol. 27, No. 10, 2009, 1585-1592. [29] Liu Hao, Han Jiuqiang. Defect detection in textiles
using optimal Gabor wavelet filter. In: 6th World Congress on Intelligent Control and Automation, 2006, pp. 10005-10007.
[30] H. Elbehiery, A. Hefnawy, M. Elewa. Surface defects detection for ceramic tiles using image processing and morphological techniques. In: Proceedings of World Academy of Science Engineering and Technology, 2005, Vol. 5, pp. 158-162.
[31] T. S. Nguyen, S. Begot, F. Duculty, M. Avila. Free-form anisotropy: a new method for crack detection on pavement surface images. In: 18th IEEE International Conference on Image Processing, 2011, pp. 1069-1072.
[32] R. M. de Andrade, E. A. Carlos. Methodology for automatic process of the fired ceramic tile‘s internal defect using ir images and artificial neural network.