Information Technology and Control 2017/2/46 194
The Probability of Stability
Estimation of an Arbitrary Order
DPCM Prediction Filter: Comparison
Between the Classical Approach and
the Monte Carlo Method
ITC 2/46
Journal of Information Technology and Control
Vol. 46 / No. 2 / 2017 pp. 194-204
DOI 10.5755/j01.itc.46.2.14038 © Kaunas University of Technology
The Probability of Stability Estimation of an Arbitrary Order DPCM Prediction Filter: Comparison Between the Classical
Approach and the Monte Carlo Method
Received 2016/01/26 Accepted after revision 2017/04/12
http://dx.doi.org/10.5755/j01.itc.46.2.14038
Corresponding author: [email protected]
Nikola B. Danković, Dragan S. Antić, Saša S. Nikolić, Staniša Lj. Perić
University of Niš, Faculty of Electronic Engineering, Department of Control Systems, Aleksandra Medvedeva 14, Niš 18000, Republic of Serbia, e-mail: {nikola.dankovic, dragan.antic, sasa.s.nikolic, stanisa.peric}@elfak.ni.ac.rs
Zoran H. Perić
University of Niš, Faculty of Electronic Engineering, Department of Telecommunications, Aleksandra Medvede-va 14, Niš 18000, Republic of Serbia, e-mail: {zoran.peric}@elfak.ni.ac.rs
Aleksandar V. Jocić
University of Niš, Faculty of Electronic Engineering, Department of Measurements, Aleksandra Medvedeva 14, Niš 18000, Republic of Serbia, e-mail: {aleksandar.jocic}@elfak.ni.ac.rs
This paper presents the stability analysis of the linear recursive (prediction) filters with higher-order predictors in a DPCM (differential pulse-code modulation) system, where traditional methods become too difficult and com-plex. Stability conditions for the third- and fourth-order predictor are given by using the Schur–Cohn stability cri-terion. The probability of stability estimation is performed by using the Monte Carlo method. Verification of the proposed method is performed for lower-order predictors (the first- and second-order). We calculated numerical values of the probability of stability for higher-order predictors and previously experimentally obtained parame-ters. With large enough number of trials (samples) in Monte Carlo simulation, we reach the desired accuracy.
195 Information Technology and Control 2017/2/46
Introduction
For half a century, differential pulse code modula-tion (DPCM) has been one of the most effective tech-niques for signal processing and transmission based on the prediction filter. This technique is widely used in telecommunications, speech [16, 22] and image coding [20, 28], medical research [10, 15, 21], etc. A prediction (recursive) filter is a central part and the basis of each DPCM system. It is located in a negative feedback loop. Because of the negative feedback, al-though basically a telecommunication system, DPCM is also suitable for the analysis in control systems theory. Some traditional stability analyses of DPCM transmission system have been already performed for the first [19], second [24], and higher-order predictors [25]. The stability of the prediction filter (the linear part of DPCM system), is a sufficient condition for stability of the whole system.
Generally, linear prediction is commonly used in vari-ous areas such as adaptive filtering, system identifica-tion, spectral estimaidentifica-tion, and speech [4]. Linear pre-diction, where the prediction of the current sample is calculated as the linear combination of the previous samples, is the basis of the DPCM system. The predic-tion gain significantly increases up to four-order pre-dictors when it gets into saturation [16]. On the other hand, a sensitivity analysis for the prediction filter is performed in [9].
In this paper, we discuss stochastic stability of the prediction filter. In practice, each real system is im-perfect in some way [1, 2, 3, 17]. It means that system parameters are stochastic variables, not determinis-tic. In this case, predictor coefficients have normal distribution around nominal value. Previously per-formed classical methods for stability analysis are not applicable for the systems with stochastic param-eters, because, in this case, we actually estimate only which probability allows the system to be stable. For these reasons, in previous papers we introduced the term “probability of stability” [1, 2, 17]. The great im-portance of the presented method is in its application in practice. The selection of the appropriate parame-ter values, for which the system has the largest prob-ability of stprob-ability, provides the stprob-ability of the system and correctness of its work.
We have already used the method of stability esti-mation for the first- and second-order predictor [8].
For the higher-order predictors, it becomes more and more difficult to use the classical integration method for obtaining desired probability of stability. Despite some attempts, only theoretical approach of stability analysis for higher-order prediction filters has been given till now without adequate numerical results [5, 23]. In this paper we use the Monte Carlo method [11, 12] for numerical integration.
First, we use the Monte Carlo method to verify the re-sults obtained by the classical method for the proba-bility of staproba-bility estimation. We perform experiments for the first- and second-order predictors and compare the obtained results with the results already obtained by using classical integration. Then, we apply the Monte Carlo method to the third- and the fourth-or-der systems and determined numerical values for the probability of stability. In addition, we make a compar-ison with some alternative approximate methods for probability of stability estimation with regard to the error and distinctness of the methods.
Theoretical Background of a
Prediction Filter in the DPCM
Transmission System
The DPCM system is suitable for digitalization and transmission of highly correlated signals. This qual-ity of the system is provided by a prediction filter in the negative feedback loop. The prediction filter esti-mates the actual sample value based on one or more previous samples of input (source) signal. A number of previous samples, which are used for prediction, determines predictor order k.
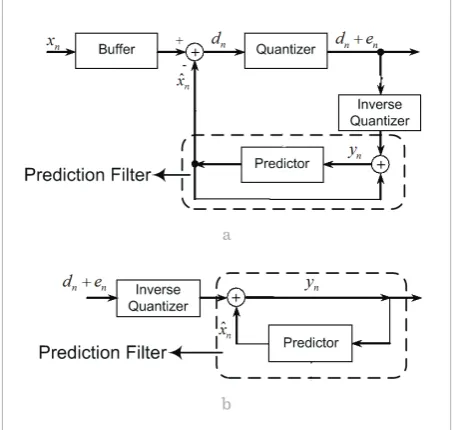
Differential pulse code modulation system is shown in Fig. 1. A DPCM encoder (Fig. 1a) consists of the quantizer, inverse quantizer, and a predictor. Predic-tion filters in the encoder and decoder are marked with dashes.
The difference between input sample xn and its
pre-dicted (estimated) value xˆn is led to quantizer input:
ˆ
n n n
d x x . (1)
n ˆ
n n n n n n
y d e x x e . (2)
1 ˆn k i n i
i
x a y
, (3)(1)
If estimation of xˆn is correct, samples of difference dn
com-Information Technology and Control 2017/2/46 196
parison with xn. In this way, quantization of a
differ-ence signal can be performed by a smaller number of amplitude levels which provides bit-rate saving, i.e., the prediction gain [16].
Figure 1
Block scheme of a DPCM system, a) Encoder b) Decoder
a
b
The difference (1) is quantized and a quantization er-ror en occurs due to quantization of the difference dn. Finally, the quantized difference is encoded and the digital value is formed. Reconstructed sample yn is actually a source signal sample with the quantization error en added:
ˆ n n n
d x x . (1)
ˆ
n n n n n n
y d e x x e . (2)
1
ˆn k i n i i x a y
, (3)(2)
For the linear predictor, the predicted (estimated) value xˆn is calculated as a linear combination of the
previouslyquantized reconstructed samples yn i− :
ˆ
n n n
d x x . (1)
ˆ
n n n n n n
y d e x x e . (2)
1 ˆn k i n i
i
x a y
, (3) (3)where a ii, =1,2,...,k are predictor coefficients. From the equations above we can see that estimation accuracy of input signal samples value (3) directly depends on quality selection of predictor coefficients values. This accuracy has a further influence on the quantization error and the prediction gain.
Low-qual-ity selection of predictor coefficients could cause bigger difference signal dn than input signal xn, and also a bigger quantization error. Afterwards, multipli-cation of total error through feedback loop may ap-pear, which finally leads to system failure. Therefore, DPCM stability mostly depends on correct selection of linear predictor coefficients.
According to all the remarks above, linear prediction filters in the encoder (Fig. 1a) and decoder (Fig. 1b), as the main parts of the whole system, are of special interest for the stability estimation.
Relation (3) describes the k-th order linear predictor andit can be rewrittenin z-domain:
^ 1 k i i iX z a z Y z
. (4)
^ 1 k i P i i X zW z a z
Y z
. (5)
11 1
1 1
k k
P i i
R i i
i i
P
W z
W z a z a z
W z
.(6)
11 1 1 1 k D i R i i P
W z a z
W z
. (7)1
1 k i 0
i i a z
, (8)1
0 k
k k i
i i
z a z
. (9)
1, , ,2
1 2k k k
S
P
f a a a da da da , (10)(4)
The transfer function of the predictor is:
^ 1 k i i iX z a z Y z
. (4)
^ 1 k i P i i X zW z a z
Y z
. (5)
11 1 1
1
k k
P i i
R i i
i i
P W z
W z a z a z
W z
.(6)
11 1 1 1 k D i R i i P
W z a z
W z
. (7)1
1 k i 0
i i a z
, (8)1 0
k
k k i
i i z a z
. (9)
1, , ,2
1 2k k k
S
P
f a a a da da da , (10) (5)The transfer function of the prediction filter in the encoder has the following form:
^ 1 k i i iX z a z Y z
. (4)
^ 1 k i P i i X zW z a z
Y z
. (5)
11 1
1 1
k k
P i i
R i i
i i
P
W z
W z a z a z
W z
.
11 1 1 1 k D i R i i P
W z a z
W z
. (7)1
1 k i 0
i i
a z
, (8)1
0
k
k k i
i i
z a z
. (9)
1, , ,2
1 2k k k
S
P
f a a a da da da , (10)(6)
The transfer function of the prediction filter in the decoder is:
^ 1 k i i iX z a z Y z
. (4)
^ 1 k i P i i X zW z a z
Y z
. (5)
11 1
1 1
k k
P i i
R i i
i i
P W z
W z a z a z
W z
.
11 1 1 1 k D i R i i P
W z a z
W z
. (7)1
1 k i 0
i
i a z
, (8)1
0 k
k k i
i i
z a z
. (9)
1, , ,2
1 2k k k
S
P
f a a a da da da , (10)(7)
Stability Analysis of the
Linear Prediction Filter
The main goal of prediction filter analysis is to deter-mine the predictor coefficients for which the system has the best performance. Our task is to examine the prediction filter stability depending on different val-ues of predictor coefficients.
197 Information Technology and Control 2017/2/46
stability consideration is very important during the system design process. The basic requirement is that predictor coefficients are located inside the stability region in parametric space or very close to this region. That means that we need to determine predictor pa-rameter values for which the prediction filter is stable or very close to the stability domain.
Prediction filters in the encoder and decoder are sta-ble if all the poles of the transfer functions (6) and (7) lie inside the unit circle, i.e., if the characteristic equation (which is the same for the both filters):
^
1
k i i i
X z a z Y z
. (4)
^1
k i
P i
i
X z
W z a z
Y z
. (5)
11 1
1 1
k k
P i i
R i i
i i
P
W z
W z a z a z
W z
.
11
1 1
1
k
D i
R i
i P
W z a z
W z
. (7)1
1 k i 0
i i
a z
, (8)1
0
k
k k i
i i
z a z
. (9)
1, , ,2
1 2k k k
S
P
f a a a da da da , (10)(8)
has all its zeroes inside the unit circle. The equation (8) can be written as:
^
1 k
i i i
X z a z Y z
. (4)
^
1 k
i
P i
i X z
W z a z
Y z
. (5)
11 1
1 1
k k
P i i
R i i
i i
P W z
W z a z a z
W z
.
11
1 1
1
k
D i
R i
i P
W z a z
W z
. (7)1
1 k i 0
i i
a z
, (8)1
0
k
k k i
i i
z a z
. (9)
1, , ,2
1 2k k k
S
P
f a a a da da da , (10)(9)
Stability conditions of the system described with characteristic equation (9) can be determined with several stability criteria. Thus, in [17] we used the Routh–Hurwitz stability criterion.
Predictor coefficients are not deterministic in prac-tice. That is why a DPCM system is not perfect as any other real system, too. Sometimes, these imperfec-tions do not have any visible effect on the system per-formances, but in many cases this effect cannot be ne-glected. Some system properties, such as stability or dynamical response, are directly dependent on this. Mathematically, the imperfections are variations of system coefficients around the nominal values of the coefficients [1, 2, 17].
In this paper, we consider a type of a real system which is stable with a certain probability. That is the reason why we need to introduce the term probability of stability, instead of traditional stability of the sys-tem. The probability of stability is defined as [17]:
^
1 k
i i i
X z a z Y z
. (4)
^1 k
i
P i
i X z
W z a z
Y z
. (5)
11 1
1 1
k k
P i i
R i i
i i
P W z
W z a z a z
W z
.
11
1 1
1
k
D i
R i
i P
W z a z
W z
. (7)1
1 k i 0
i i a z
, (8)1
0 k
k k i
i i
z a z
. (9)
1, , ,2
1 2k k k
S
P
f a a a da da da , (10) (10)where Sk is the stability region and
(
1 2)
( )
1, , , k k i i
i
f a a a f a
=
=
∏
(
1 2)
( )
1
, , , k k i i
i
f a a a f a
=
=
∏
is the total density function.
Based on these facts, we can estimate the stability of an arbitrary order prediction filter, but some difficul-ties can occur during calculations. Namely, the shapes of the stability regions become too complex and not convex for k≥3 [5, 7, 26]. Some geometric properties of the stability region Sk are given in [23]. The shape of Sk was determined for low-order prediction filters,
and only general properties were given for higher-or-der filters. Keeping in mind that we perform stochas-tic stability [13], not determinisstochas-tic, it is more difficult to obtain the desired numerical results. This is the reason why we propose a new improved method for the probability of stability calculation by using the Monte Carlo integration.
However, we will first verify the accuracy of the Mon-te Carlo method for already performed stability esti-mation for the first- and second-order predictors.
The Monte Carlo Method
The Monte Carlo method provides approximate nu-merical solutions to various problems by performing statistical sampling experiments on a computer. The method is especially useful for mathematical prob-lems which are too complicated to solve analytically [11, 12, 17].
Information Technology and Control 2017/2/46 198
to generate the values of the parameters with normal distribution. The experiments are performed over dif-ferent numbers of samples (trials). The testing of the probability of stability using the Monte Carlo method is much easier, because there is no need for integration over the region of stability [6, 7], but only the limits of the stability region are required. The probability of sta-bility is calculated as the quotient of the number of fa-vourable samples (samples that belong to the region of stability) and the total number of samples.
The probability of Stability
Estimation by Using Clasical
Integration and the Monte Carlo
Method in the case of the First- and
Second-Order Predictors
In the case of the first-order predictor, the stability region is well-known [8] and presented with the fol-lowing condition:
1
1 a 1
. (11)
1 2 1 1 1 1 1 1 1
1 exp 1
2 2 S a a P da
, (12)e N
. (13)
1 2 1 2 2
1 a a 0, 1 a a 0, a 1. (14)
2 1 2
1 2
2 2
1 1 2 2
1 2 1 1 ( , ) 2 2 1 1 exp , 2 2
f a a
a a a a
(15)
2 22 1 2 1 2
2 1 2 1 2
,
( , )
S S
f a a da da P
f a a da da
. (16)
(11)
Let us denote the stability region described by (11) with S1. The probability of stability is given by:
1
1 a 1
. (11)
1 2 1 1 1 1 1 1 1
1 exp 1 2 2
S a a
P da
, (12)e N
. (13)
1 2 1 2 2
1 a a 0, 1 a a 0, a 1. (14)
2 1 2
1 2
2 2
1 1 2 2
1 2 1 1 ( , ) 2 2 1 1 exp , 2 2
f a a
a a a a
(15)
2 22 1 2 1 2
2 1 2 1 2
,
( , )
S S
f a a da da P
f a a da da
. (16)
(12)
where a1 is the mean value of a1, and σ1 is the
stan-dard deviation of parameter a1.
Now, we will test the Monte Carlo method for the probability of stability for the previously calculated values using classical integration.
For a1=0.81 and σ =1 0.2, the obtained value for the
probability of stability using classical integration (12) is 0.8289 (82.89%) [8]. In this paper, we apply the Monte Carlo method to estimate the probability of stability for the same distribution parameters of the predictor coefficient. The random number generator was used to generate the values of the predictor coeffi-cients with normal distribution.
Verification experiment is performed with 10,000
trials. We counted the number of parameter values which satisfy (11) and obtained the probability value of 0.8331 (83.31%). As we can see, the deviation from the value obtained by the classical method is less than 0.005. If we need better accuracy, we can get high-er numbhigh-er of trials. For repeated exphigh-eriment with 100000 trials, we obtained the probability of stability value of 0.8279 (82.79%). In order to obtain the proba-bility of staproba-bility with desired accuracy, we performed two more experiments. With 1,000,000 trials we ob-tain the value of 0.8281 (82.81%). It means that we still did not reach the accuracy to three decimal plac-es. Finally, after we repeat the experiment, this time with 10,000,000 trials, we obtain the value of 0.8290 (82.90%). Thus we reached the desired accuracy. The accuracy of the Monte Carlo Method depends on the number of trials (~ 1
N ), but also on the standard
deviation [14]:
1 1 a 1
. (11)
1 2 1 1 1 1 1 1 1
1 exp 1 2 2
S a a
P da
, (12)e N
. (13)
1 2 1 2 2
1 a a 0, 1 a a 0, a 1. (14)
2 1 2
1 2
2 2
1 1 2 2
1 2 1 1 ( , ) 2 2 1 1 exp , 2 2
f a a
a a a a
(15)
2 22 1 2 1 2
2 1 2 1 2 ,
( , ) S
S
f a a da da P
f a a da da
. (16)
(13)
Detailed error analysis is not necessary for the pur-pose of probability stability estimation of the DPCM prediction filter. We can easily achieve satisfied ac-curacy, but we perform more experiments again for the second-order predictor, because we also know the exact value of the probability of stability, and further-more, for higher-order predictors we adopt a num-ber of trials large enough for our purpose. In order to compare accuracy of different methods, we will show how the errors occur if we use some alternative ap-proximate methods [6, 7, 27].
For the second-order predictor, the stability region
2
S , in the parametric space, a a1, 2, is given with the following conditions:
1
1 a 1
. (11)
1 2 1 1 1 1 1 1 1
1 exp 1
2 2
S a a
P da
, (12)e N
. (13)
1 2 1 2 2
1 a a 0, 1 a a 0, a 1. (14)
2 1 2
1 2
2 2
1 1 2 2
1 2 1 1 ( , ) 2 2 1 1 exp , 2 2
f a a
a a a a
(15)
2 22 1 2 1 2
2 1 2 1 2
,
( , ) S
S
f a a da da P
f a a da da
. (16)
(14)
The probability density function (PDF) for normal distribution has the following form [1, 2, 8, 17]:
1 1 a 1
. (11)
1 2 1 1 1 1 1 1 1
1 exp 1 2 2
S a a
P da
, (12)e N
. (13)
1 2 1 2 2
1 a a 0, 1 a a 0, a 1. (14)
2 1 2
1 2
2 2
1 1 2 2
1 2 1 1 ( , ) 2 2 1 1 exp , 2 2
f a a
a a a a
2 22 1 2 1 2
2 1 2 1 2 ,
( , )
S S
f a a da da P
f a a da da
. (16)
199 Information Technology and Control 2017/2/46
where σ1 and σ2 are standard deviations, while a1 and
2
a are the mean values of predictor coefficients a1 and 2
a, respectively.
The probability of stability is derived from:
1
1 a 1
. (11)
1
2 1
1 1
1 1
1 1
1 exp 1
2 2
S a a
P da
, (12)e N
. (13)
1 2 1 2 2
1 a a 0, 1 a a 0, a 1. (14)
2 1 2
1 2
2 2
1 1 2 2
1 2
1 1
( , )
2 2
1 1
exp ,
2 2
f a a
a a a a
22
2 1 2 1 2
2 1 2 1 2
,
( , )
S
S
f a a da da P
f a a da da
. (16) (16)
Remark 1. The integral in the denominator in (16) presents total probability and is equal to 1.
For the obtained values of predictor coefficients a1
and a2, we calculated the mean value and the
stan-dard deviation for different values of frame length,
M. In the case when M =50 and the following mean (nominal) values of predictor coefficients:
1 1.292, 2 0.410
a = a = − , and standard deviations:
1 0.206, 2 0.205
σ = σ = , respectively, we obtained the value of 0.6556 (65.56%) for probability of stabil-ity of prediction filter, by calculating integral given by (16).
Now, we test the Monte Carlo method for the sec-ond-order predictor. We performed four experiments, also (with 10000, 100000, 1000000 and 10000000 trials). Obtained values for probability of stability are given in Table 1. As we can see, after 107 trials, an
esti-mation error is less than 0.001.
Table 1
Probability of stability using classical integration and the Monte Carlo method for mean values a1=1.292, a2= −0.410, and standard deviations σ1=0.206,σ2=0.205 of the second-order predictor coefficients
Methods Classical Monte Carlo
Trials / 104 105 106 107
Probability
of stability 0.6556 0.6542 0.6545 0.6559 0.6558 Error / 0.0014 0.0011 0.0003 0.0002
According to the previous estimation error analysis, for the higher-order predictor, we perform experi-ments with 107 trials (the accuracy approximately
to three decimal places).
As we have already concluded, for higher-order sys-tems, integration becomes too complicated and the Monte Carlo method, which we tested in this section, can be very good and reliable alternative for the prob-ability stprob-ability estimation.
Application of the Monte Carlo
Method for Stability Estimation of
the Prediction Filter with
Higher-Order Predictors
Generally, for the k–th order prediction filter (k≥3), the probability of stability could be deter-mined using the relations (10), too. However, the calcu-lation is too complex. The limits of the stability region
k
S are usually complex mathematical expressions and it is difficult to determinate the probability of stability because it is necessary to perform integration over the region of stability [7, 26]. That is the reason why we es-timate the probability of stability later on.
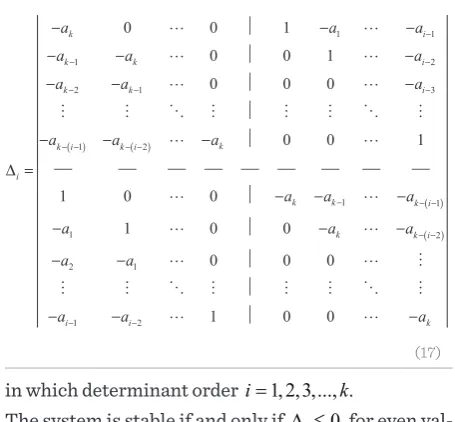
We will use the Schur–Cohn stability criterion [18]. We adapted it to the form of characteristic equation (9) and built appropriate determinants:
1 1
1 2
2 1 3
1 2
1 1
1 2
2 1
1 2
0 0 1
0 0 1 0 0 0
0 0 1
1 0 0
1 0 0
0 0 0
1 0 0
k i
k k i
k k i
k k i k i
i
k k k i k k i
i i k
a a a
a a a
a a a
a a a
a a a
a a a
a a
a a a
(17)
3 1
3
3 1
2 3 2
3 2
1 3
3 1 2
2 3 1
1 2 3 3
3 2 1
1 3 2
2 1 3
1
0,
1
0
1
0
1
0,
1
0
1
0
0
0
1
0
0
1
0
0
1
0.
1
0
0
1
0
0
1
0
0
a
a
a
a
a
a
a
a
a
a
a
a
a
a
a
a
a
a
a
a
a
a
a
a
a
a
a
a
(18)
The stability region
S
3is shown in Fig. 2.
Figure 2. The stability region S3 of the third-order prediction filter
2
3 3
3 1 2 3
1 1
1
1
( , , )
exp
2
2
i i
i
i i i
a a
f a a a
.(19)
3 3
3 1 2 3 1 2 3
3 1 2 3 1 2 3
, ,
( , , )
SS
f a a a da da da
P
f a a a da da da
.
(20)
(17)
in which determinant order i=1,2,3,...,k.
The system is stable if and only if ∆ ≤i 0 for even val-ues of i,and ∆ ≥i 0 for odd values of i.
Information Technology and Control 2017/2/46 200 1 1 1 2
2 1 3
1 2
1 1
1 2
2 1
1 2
0 0 1
0 0 1
0 0 0
0 0 1
1 0 0
1 0 0
0 0 0
1 0 0
k i
k k i
k k i
k k i k i
i
k k k i
k k i
i i k
a a a
a a a
a a a
a a a
a a a
a a a
a a
a a a
(17) 3 1 3 3 1 2 3 2 3 2 1 3
3 1 2
2 3 1
1 2 3
3
3 2 1
1 3 2
2 1 3
1 0, 1 0 1 0 1 0, 1 0 1 0
0 0 1
0 0 1
0 0 1
0.
1 0 0
1 0 0
1 0 0
a a a a a a a a a a
a a a
a a a
a a a
a a a
a a a
a a a
The stability region S3 is shown in Fig. 2.
Figure 2. The stability region S3 of the third-order prediction filter
2
3 3
3 1 2 3
1 1
1 1
( , , ) exp
2
2 i i i
i i i
a a f a a a
.(19)
3 33 1 2 3 1 2 3
3 1 2 3 1 2 3
, ,
( , , )
S S
f a a a da da da P
f a a a da da da
. (20)(18)
The stability region S3is shown in Fig. 2.
Figure 2
The stability region S3 of the third-order prediction filter
1 1 1 2
2 1 3
1 2
1 1
1 2
2 1
1 2
0 0 1
0 0 1
0 0 0
0 0 1
1 0 0
1 0 0
0 0 0
1 0 0
k i
k k i
k k i
k k i k i
i
k k k i
k k i
i i k
a a a
a a a
a a a
a a a
a a a
a a a
a a
a a a
(17) 3 1 3 3 1 2 3 2 3 2 1 3
3 1 2
2 3 1
1 2 3
3
3 2 1
1 3 2
2 1 3
1 0, 1 0 1 0 1 0, 1 0 1 0
0 0 1
0 0 1
0 0 1
0.
1 0 0
1 0 0
1 0 0
a a a a a a a a a a
a a a
a a a
a a a
a a a
a a a
a a a
(18)
The stability region S3 is shown in Fig. 2.
Figure 2. The stability region S3 of the third-order prediction filter
2
3 3
3 1 2 3
1 1
1 1
( , , ) exp
2 2
i i
i
i i i
a a f a a a
.(19)
3 33 1 2 3 1 2 3
3 1 2 3 1 2 3
, , ( , , )
S S
f a a a da da da P
f a a a da da da
. (20)
The probability density function is:
1 1 1 2
2 1 3
1 2
1 1
1 2
2 1
1 2
0 0 1
0 0 1
0 0 0
0 0 1
1 0 0
1 0 0
0 0 0
1 0 0
k i
k k i
k k i
k k i k i
i
k k k i
k k i
i i k
a a a
a a a
a a a
a a a
a a a
a a a
a a
a a a
(17) 3 1 3 3 1 2 3 2 3 2 1 3
3 1 2
2 3 1
1 2 3
3
3 2 1
1 3 2
2 1 3
1 0, 1 0 1 0 1 0, 1 0 1 0
0 0 1
0 0 1
0 0 1
0.
1 0 0
1 0 0
1 0 0
a a a a a a a a a a
a a a
a a a
a a a
a a a
a a a
a a a
(18)
The stability region S3 is shown in Fig. 2.
Figure 2. The stability region S3 of the third-order prediction filter
2
3 3
3 1 2 3
1 1
1 1
( , , ) exp
2
2 i i i
i i i
a a f a a a
.(19)
3 33 1 2 3 1 2 3
3 1 2 3 1 2 3
, ,
( , , ) S
S
f a a a da da da P
f a a a da da da
. (20)(19)
Theoretical value for the probability of stability is giv-en by: 1 1 1 2
2 1 3
1 2
1 1
1 2
2 1
1 2
0 0 1
0 0 1
0 0 0
0 0 1
1 0 0
1 0 0
0 0 0
1 0 0
k i
k k i
k k i
k
k i k i
i
k k k i
k k i
i i k
a a a
a a a
a a a
a a a
a a a
a a a
a a
a a a
(17) 3 1 3 3 1 2 3 2 3 2 1 3
3 1 2
2 3 1
1 2 3
3
3 2 1
1 3 2
2 1 3
1 0, 1 0 1 0 1 0, 1 0 1 0
0 0 1
0 0 1
0 0 1
0.
1 0 0
1 0 0
1 0 0
a a a a a a a a a a
a a a
a a a
a a a
a a a
a a a
a a a
(18)
The stability region S3 is shown in Fig. 2.
Figure 2. The stability region S3 of the third-order prediction filter
2
3 3
3 1 2 3
1 1
1 1
( , , ) exp
2 2
i i
i
i i i
a a f a a a
.(19)
3 33 1 2 3 1 2 3
3 1 2 3 1 2 3
, ,
( , , )
S
S
f a a a da da da P
f a a a da da da
. (20) (20)
Hence, we can see that already for the third order, cal-culation of the probability of stability becomes very complex. This is the reason why we use the Monte Carlo method for this purpose.
An experiment for obtaining predictor coefficients values was performed for recorded speech signal of 10200 samples with sampling frequency of 8KHz and resolution 16 bit/sample. The available signal was di-vided into frames of length M , and for each frame, op-timal values of predictor coefficients were calculated using the adaptive differential pulse code modulation (ADPCM) method [16]. The experiment was repeated for each frame length and the PDF of predictor coeffi-cients ai, mean values ai, and standard deviations σi
( i=1,2,3), were calculated.
Now, we can perform stability estimation of the third-order prediction filter. According to the results in the previous section (related to the accuracy of the Monte Carlo method), we perform all Monte Carlo simulation experiments with 7
3 10
N = trials. We gen-erated a simple code in the Matlab software package for Monte Carlo 3D numerical integration. We calcu-late the ratio between favourable cases (the predictor coefficients values which satisfy (18)) and the total number of trials, in order to obtain the desired values. These values of the probability of stability for five dif-ferent frame lengths are given in Table 2.
Table 2
Probabilities of stability of the third-order prediction filter for different values of frame length M
M [samples] 10 20 50 100 150
ā1 0.983 1.138 1.316 1.444 1.510
σ1 0.237 0.246 0.258 0.254 0.260
ā2 -0.191 -0.289 -0.462 -0.635 -0.718
σ2 0.276 0.338 0.385 0.392 0.410
ā3 -0.037 -0.003 0.042 0.103 0.126
σ3 0.156 0.179 0.192 0.199 0.205
201 Information Technology and Control 2017/2/46
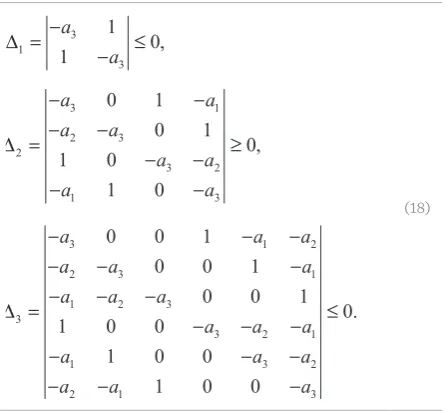
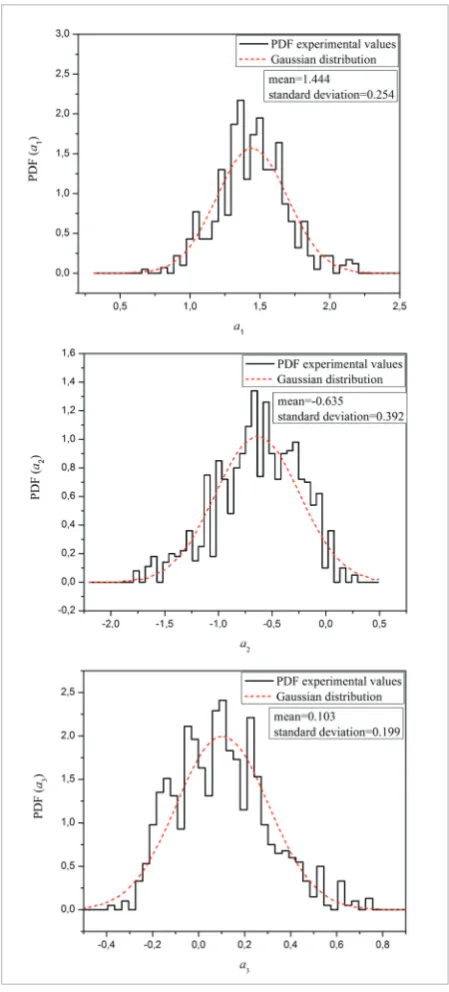
Distributions of coefficients a1, a2, and a3 for M =20,
are shown in Fig. 3 for the illustrative purpose. Normal (Gaussian) distribution with the same mean and stan-dard deviations is also shown for comparison.
Figure 3
The probability density function of predictor coefficients 1
a , a2, and a3, respectively (for M=20)
Figure 3. The probability density function of predictor coefficients
1
a , a2, and a3, respectively (for M20)
1
1
2 2 2
k
k k i i
S
i i i
k k
a a
i i
P
,(21)1
1 1
1
2 2 2
k
k k i i
S
i i i
a a
n n
P
,(22)Figure 3. The probability density function of predictor coefficients
1
a , a2, and a3, respectively (for M20)
1 1
2 2 2
k
k k i i
S
i i i
k k
a a
i i
P
,(21)1
1 1 1
2 2 2
k
k k i i
S
i i i
a a n n P
,(22)Now, in order to demonstrate the effectiveness of the proposed method, we perform some experiments with approximate method for probability of stability esti-mation given in [6, 7, 27]. By using two theorems given and proven in [7, 27], two stability regions, Sk and Sk ,
described with appropriate relations are given. The stability region Sk is limited above and below with
these two regions, i.e. Sk∈Sk∈Sk . It means that we can calculate upper and lower limit values of proba-bility of staproba-bility. In this paper, we calculate stochastic stability, so application of this approximate method can also become complex although the regions which bound Sk are much easier for integration. Because of that, the following expressions are given in [27]:
Figure 3. The probability density function of predictor coefficients
1
a , a2, and a3, respectively (for M20)
1
1
2 2 2
k
k k i i S
i i i
k k
a a
i i
P
,(21)1
1 1
1
2 2 2
k
k k i i S
i i i
a a
n n
P
,(22)(21)
Figure 3. The probability density function of predictor coefficients
1
a , a2, and a3, respectively (for M20)
1
1
2 2 2
k
k k i i
S
i i i
k k
a a
i i
P
,(21)1
1 1
1
2 2 2
k
k k i i
S
i i i
a a
n n
P
,(22) (22)where
( )
( )
2 02 expz
z z dz
π
Φ =
∫
− is the Laplace func-tion, andk
S
P and PSk are the probabilities of the upper and lower bounds of the stability region Sk,
respec-tively, i.e.: k k
k
S S S
P ≤P ≤P .
In [6, 7], the value for probability of stability is ap-proximated with the upper bound, i.e.: k
k
S S
P ≈P . Now, we can calculate the approximate values for probabil-ities using these relations. For M =20, e.g., and giv-en parameters (see Table 2), we obtain the following probabilities:
3 0.785
S
P = and 3 2 104
S
P = ⋅ − . Hence,
using the proposed method [27] we do not have enough information about the exact value of proba-bility, but we only know that it is between 0.0002 and 0.785. The range is very wide, unfortunately. For oth-er frame lengths, the proposed approximation is also very rough and conclusion is the same.
Remark 2. Despite the fact that there is no need for alternative methods in the case of the lower-order prediction filters, a comparison can be made, too. In the case of the second-order predictor and previously given values, we obtain
2 0.8842
S
Information Technology and Control 2017/2/46 202
by using approximations (21) and (22). The range is too wide again. For the second-order prediction filter we have exact value for probability of stability 0.6556. If we approximate probability with upper value 0.8842 as it is proposed in [6, 7], the error is 0.2286, i.e. much larger than using the Monte Carlo method (Table 1). In the case of the prediction filter with the fourth-or-der predictor, the probability of stability estimation is performed in the similar way. The experiments were performed for the same signal sample and the same frame lengths (M =10, 20, 50, 100, 150).
We also use the Schur–Cohn stability criterion to ob-tain the stability region for the fourth-order predic-tor, S4 (17).
The probability density function for the fourth-order system is:
4
4 1 2 3 4
1
2 4
1
1 ( , , , )
2 1 exp
2
i i
i i
i i
f a a a a
a a
. (23)
4 4
4 1 2 3 4 1 2 3 4
4 1 2 3 4 1 2 3 4
, , ,
( , , , )
S S
f a a a a da da da da P
f a a a a da da da da
.(24)
(23)
Theoretical value for probability of stability is given by:
4
4 1 2 3 4 1
2 4
1 1 ( , , , )
2 1 exp
2
i i
i i
i i
f a a a a
a a
. (23)
4 4
4 1 2 3 4 1 2 3 4
4 1 2 3 4 1 2 3 4 , , ,
( , , , ) S
S
f a a a a da da da da P
f a a a a da da da da
.(24) (24)By using the Monte Carlo simulation experiment with the same number of trials ( 7
4 10
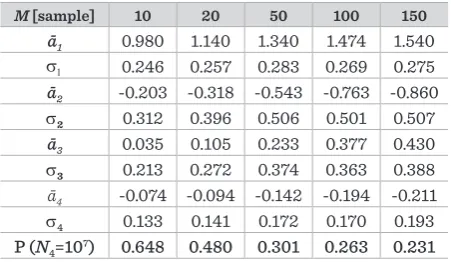
N = ), we obtain values for the probability of stability given in Table 3.
Table 3
Probabilities of stability of the fourth-order prediction filter for different values of frame length M
M [sample] 10 20 50 100 150
ā1 0.980 1.140 1.340 1.474 1.540
σ1 0.246 0.257 0.283 0.269 0.275
ā2 -0.203 -0.318 -0.543 -0.763 -0.860
σ2 0.312 0.396 0.506 0.501 0.507
ā3 0.035 0.105 0.233 0.377 0.430
σ3 0.213 0.272 0.374 0.363 0.388
ā4 -0.074 -0.094 -0.142 -0.194 -0.211
σ4 0.133 0.141 0.172 0.170 0.193
P (N4=107) 0.648 0.480 0.301 0.263 0.231
Remark 3. Using approximations (21) and (22), we
obtain upper and lower bounds for probability (e.g. for
20
M = ) 0.69604 and 0.00003, respectively.
The proposed method can be easily applicable for any higher-order predictor, where classical integration cannot be applied and other methods give much big-ger errors than the Monte Carlo method.
Conclusion
In this paper, we performed the stability analysis of DPCM prediction filters with the higher-order pre-dictors. We calculated the probability of stability values. Because of very complex classical numeri-cal integration, we proposed the Monte Carlo inte-gration.
We used the method, which was previously verified (for the first and second order), for the probability of stability estimation for the third- and fourth-order prediction filters.
The proposed method can be applied in the same way to the higher-order predictors, where classical meth-ods become more and more complex. Experiments were performed for different number of trials for bet-ter accuracy.
Hence, the Monte Carlo method allows us to easily determine the probability of stability of the predic-tion filter with arbitrary order predictor, even when the classical integration method is not applicable. A problem with the error which occurs during the Monte Carlo integration is solved by increasing the number of trials in experiments, depending on the required accuracy set in advance. This is not possible for already developed methods for higher-order sys-tems.
Acknowledgment
203 Information Technology and Control 2017/2/46
References
1. Antić, D., Jovanović, Z., Danković, N., Spasić, M., Stan-kov, S. Probability estimation of certain properties of the imperfect systems. Proceedings of IEEE 7th In-ternational Symposium on Applied Computational Intelligence and Informatics, (SACI 2012), Timiso-ara, Romania, May 24-26, 2012, 213-216. http://dx.doi. org/10.1109/SACI.2012.6250004
2. Antić, D., Jovanović, Z., Danković, N., Spasić, M., Stan-kov, S. Probability estimation of defined properties of the real technical systems with stochastic parameters. Scientific Bulletin of the “Politehnica” University of Timişoara, Romania, Transactions on Automatic Con-trol and Computer Science, 2012, 57(71-2), 67-74. 3. Antić, D., Nikolić, S., Milojković, M., Danković, N.,
Jova-nović, Z., Perić S. Sensitivity analysis of imperfect sys-tems using almost orthogonal filters. Acta Polytechnica Hungarica, 2011, 8(6), 79-94.
4. Benesty, J., Sondhy, M., Huang, Y. Introduction to speech processing. In: Springer Handbook of Speech Processing, Eds. Benesty, J., Mohan Sondhi, M., Huan, Y. A., Springer, Chapter 7, 2008. http://dx.doi. org/10.1007/978-3-540-49127-9_7
5. Combettes, P. L., Trussell, H. J. Stability of the linear prediction filters: A set theoretic approach. IEEE Inter-national Conference on Acoustics, Speech, and Signal Processing, New York, USA, April 11-14, 1988, 4, 2288-2291. http://dx.doi.org/10.1109/ICASSP.1988.197094 6. Danković, B., Jovanović, Z. On the reliability of
dis-crete-time control systems with random parameters. Quality technology and Quantitative Management, 2005, 2(1), 53-63. http://dx.doi.org/10.1080/16843703. 2005.11673080
7. Danković, B., Vidojković, B. M., Vidojković, B. The prob-ability stprob-ability estimation of discrete-time systems with random parameters. Control and Intelligent Sys-tems, 2007, 35(2), 134-139. http://dx.doi.org/10.2316/ Journal.201.2007.2.201-1618
8. Danković, N. B., Perić, Z. H. A probability of stability estimation of DPCM system with the first order predi-ctor. Facta Universitatis, Series: Automatic Control and Robotics, 2013, 12(2), 131-138.
9. Danković, N., Perić, Z., Antić, D., Mitić, D., Spasić, M. On the sensitivity of the recursive filter with arbitrary order predictor in DPCM system, Serbian Journal of Electrical Engineering, 2014, 11(4), 609-616. http://dx-.doi.org/10.2298/SJEE1404609D
10. Fira, C., Goras, L. An ECG signals compression meth-od and its validation using NNs. IEEE Transac-tions on Biomedical Engineering, 2008, 55(4), 1319-1326. [Online]. Available: http://dx.doi.org/10.1109/ TBME.2008.918465
11. Fishman, G. S. Monte Carlo: Concepts, algorithms, and applications. Springer, New York, 1996. http://dx.doi. org/10.1007/978-1-4757-2553-7
12. Gentle, J. E. Random Number Generation and Monte Carlo Methods. Statistics and Computing, 2nd edition, Springer, New York, 1998. http://dx.doi.org/10.1007/ b97336
13. Goldstein, L. H., Liu, B. Deterministic and stochastic stability of adaptive differential pulse code modulation. IEEE Transactions on Information Theory, 1977, 23(4), 445-453. http://dx.doi.org/10.1109/TIT.1977.1055754 14. Gould, H., Tobochnik, J., Christian, W. An Introduction
to Computer Simulation Methods, 3rd edition. Chapter 12, 2011.
15. Jalaleddine, S. M. S., Hutchens, C. G., Strattan, R. D., Coberly, W. ECG data compression techniques-a unified approach. IEEE Transactions on Biomedi-cal Engineering, 1990, 37(4), 329-343. http://dx.doi. org/10.1109/10.52340
16. Jayant, N. S., Noll, P. Digital Coding of Waveforms, Prin-ciples and Applications to Speech and Video. Prentice Hall, Chapter 6, 1984.
17. Jovanović, Z., Danković, N., Spasić, M., Stankov, S., Icić, Z. Practical testing of the probability of stability of the discrete system with random parameters. In: Proceed-ings of 10th International Conference on Applied Elec-tromagnetics, (ПЕС 2011), Niš, Serbia, Sept. 25-29, 2011. 18. Kailath, T. A Theorem of I. Schur and its impact on mod-ern signal processing, operator theory: Advances and applications. In: I. Schur Methods in Operator Theory and Signal Processing, Ed. I. Gohberg, 1986, Birkhäuser Basel, 18, 9-30. http://dx.doi.org/ 10.1007/978-3-0348-5483-2_2
19. Macchi, O., Uhl, C. The stability of DPCM transmission system. IEEE Transactions on Circuits and Systems II: Analog and Digital Signal Processing, 1992, 39(10), 705-722. http://dx.doi.org/10.1109/82.199897