Copyright © 2016 IJECCE, All right reserved
Design of Decision Support System for Loans Based on
Data Mining Techniques
Ahmed A. Saleh
Hazem M. El-Bakry
Mohammed K. Kolkas
Information System Dept.,
Faculty of Computer & Information Sciences, Mansoura University,
Mansoura, Egypt
Information System Dept., Faculty of Computer & Information
Sciences, Mansoura University, Mansoura, Egypt
Information System Dept., Faculty of Computer & Information
Sciences, Mansoura University, Mansoura, Egypt
Abstract – Decision Support Systems (DSS) is a particular
type of computerized information system that support business and organizational decision making activities. on the other hand, Data Mining (DM) expand the potentials for decision support by finding styles and connections hidden in the data and in this way enabling an inductive way to deal with data analysis. Data is analyzed through a mechanized process, known as Knowledge Discovery in data mining techniques. Data mining can be characterized as a process of browsing and analysis for large amounts of data with a particular focus on discovering significantly important patterns and rules. Data mining helps discovering knowledge from raw, not equipped data. Utilizing data mining techniques permits extracting knowledge from data mart, data warehouse and, specifically cases, even from operational databases.
In this paper a methodology is introduced to integrate the DSS with DM for loans to the Real Estate developments fund (REDF) Customers. It causes to cooperative interaction of DSS, through getting more options to analysis, utilizing expert's data, and improving assessment process. So I will talk about the function of data mining to simplify decision support, the utilization of data mining methods in decision support systems, talking about applied approaches and present a data mining decision support system called DMDSS – (Data Mining Decision Support System). We also present some obtained results and plans for future development.
Keywords – Decision Support Systems, Data Mining,
Knowledge Discovery, Data Warehouse, Statistical Analysis, The Real Estate Developments Fund (REDF).
I.
I
NTRODUCTIONThe Decision Support System concept returns a long time, the definition differs relying upon the development of information technologies and, obviously, on the perspective of those who issues such a definition. Looking through various definition we can find that Moore and Chang characterized the DSS as "an extensible system, capable of ad-hoc analysis and decision modeling, focused on future planning and used at unplanned and irregular timestamps". Likewise Carlson and Sprague define decision support systems as being "interactive systems that help decedent makers use data and models in resolving unstructured and semi-structured economical problems". In 1998 Turban defines a decision support system as "an interactive, flexible and adaptable system, exclusively designed to offer support in solving unstructured or semi-structured managerial problems, aiming to improve the decisional process. The system uses data (internal and external) and models, providing a simple and easy-to-use
interface, thus, allowing the decision maker control over the decision process. The DDS offers support in all decision process’s stages". In this context, studies demonstrate that the process of characterizing a Decision Support System has begun from the thought of how the objectives of a DDS can be accomplished, how a DDS's components can be distinguished, the features that are given to the end user and from the understanding of what such a system is capable of doing (offering support in decision making processes, in solving structured and unstructured issues) [6-24].
II.
P
ROBLEMS
TATEMENTFirstly, let’s see what is a problem that we are decided to solve according to some techniques of data mining. The real estate development fund (REDF) is a place that is resident on Saudi Arabia Especially the head department in Riyadh city which have a lot of branches all over the Kingdom of Saudi Arabia in every Region. These Regions will be mentioned in details during writing the research later. The main work of the Real Estate Development Fund (REDF) is providing the mortgage loans to Saudi citizens in order to help them in building their houses or owning them. Riyadh Bank is one of the main providers for the REDF service through its Teller System.
Copyright © 2016 IJECCE, All right reserved wreaks to take all of this point in mind in the future the
REDF will apply new Loans to a citizen in the mentioned regions and the decision maker will decide to increase the loans or decrease it depending on the study.
III.
C
ONTRIBUTIONThis paper represents a contribution of applying DM and DSS on the REDF especially in investment which has been rarely addressed before. DMDSS is a new proposed system which is simple, straightforward with low computation needs. The proposed preprocessing component is an aggregation of several known steps. The post processing component is an optional one that eases the interpretation of the investment results. While designing and developing DMDSS and monitoring its use by the business users we have been considering and exploring the semantic contribution of the use of a data mining application system like DMDSS in a decision process and performing any kind of business analysis. For that reason one of our goals of the project was also to illustrate the semantic contribution of the use of DMDSS in decision processes. We decided to use the concept of data-model for that purpose.
IV.
P
REVIOUSS
TUDIESIn this section we will present the related works according to data mining in loans from the researchers views, the methodology that they were used during their thesis and the algorithm that they were chose during the mining process and the strong and weak points of them if found. during the research process i was found that every researcher choose an algorithm that is suitable and convey their mining data.
4.1 Assessing Loan Risks
In [4], the author said that "If your financial clients could predict which applicants would repay their loans then Data mining has come out of the research lab and into the real world to do just such tasks".
In [4], the author defined Data mining as " The nontrivial process of identifying valid, novel, potentially useful, and ultimately understandable patterns in data". In [4], the author was made his research on the USDA’s Rural Housing Service that manage a loan program that lends or guarantees mortgage loans to people living in rural areas. Housing Service manage about 600,000 loans, so the department maintains extensive information about each one in its data warehouse. As with most lending programs, some USDA loans perform better than others. The USDA chose data mining to help it better comprehend these loans, enhance the administration of its lending program, and decrease the incidence of problem loans. The department needs data mining to discover patterns that recognize borrowers who reimburse immediately from the individuals who don't. The trust is that such patterns could foresee when a borrower is heading for trouble.
The USDA retained Rob Gerritsen organization to supply it with data mining training. As a major aspect of that training exercise, In [4], the author and his colleagues
performed a preparatory study with data extracted from the USDA data warehouse. The data, a little sample of current home loans for single-family homes, contains around 12,000 records, approximately 2 percent of the USDA's present database.
4.2 Data Mining in Financial Application
In [5], the second thesis that taking a bout data mining in loans or financial application is produced. In [5], the author said that the classification of data mining depend on the type of knowledge that is mined. So the data mining can be mainly classified into the following categories Association rule mining, Classification and prediction and Clustering analysis. In [5], the author was focused only on four commonly used techniques that deal with data mining in financials, these five selected techniques as in [5] are neural networks, genetic algorithms, statistical inference, rule induction, and data visualization. These five techniques are Neural Networks, Genetic Algorithms, Statistical Inference and Rule Induction.
4.3 Applying Data Mining Techniques to Evaluate Applications for Agricultural Loans. In [6], a study was constructed to analyzes the performance of three estimation techniques decision tree, logistic regression and neural networks as far as their misclassification rates of credit default. The study utilizes 17,328 loans of grain makers for the time of 2006 - 2010.
Copyright © 2016 IJECCE, All right reserved
V.
D
ATAP
REPARATIONToday's real-world databases are highly exposed to noisy, missing, and conflicting data thanks to their commonly huge size (often several gigabytes or more) and their probable root from various, heterogeneous sources. Low-quality data will lead to low-quality mining results. See Figure (1). “How can the data be preprocessed in order to help improve the quality of the data and, consequently, of the mining outputs? How can the data be preprocessed so as to improve the efficiency and simplicity of the mining process?”
There are various data preprocessing techniques. Data cleaning can be implemented to erase noise and correct irregularities in the data. Data integration combines data from various sources into a solid data store, for example, a data warehouse. Data transformations, for example, normalization, may be implemented. For instance normalization get the accuracy and efficiency better of mining algorithms including distance estimations. Data reduction can decrease the data size by aggregating, removing repetitive features, or grouping, for instance. These strategies are not mutually exclusive; they may co-operate. For instance, data cleaning can include changes to correct wrong data, for example, by changing all inputs for a date field to a typical organization. Data processing techniques, when implemented before mining, can basically enhance the overall quality of the patterns mined and/or the time needed for the actual mining.
Data comes in, perhaps from numerous sources. It is incorporated and put in some basic data store. A piece of it is then taken and pre-prepared into a standard format. This ‘prepared data’ is then passed to a data mining algorithm which delivers an output in the form of rules or some other kind of ‘patterns’.
Thus, we will interest in details the Phase of data processing as the critical piece of data mining. any error or miss processing in data will deliver unparticular knowledge of statistics so this will influence the decision which the decision maker will take.
VI.
D
ATAM
ININGT
ECHNIQUES6.1.
Classification
Classification is a task that happens as often as possible in everybody life. Basically it includes partitioning up objects so that each is assigned to one of a number of mutually exhaustive and exclusive classifications known as classes.
6.1.1. Naïve Bayes Classifiers
Bayesian classifiers are statistical classifiers, and are based on Bayes theorem. They classify by calculating the probability that a given sample belongs to a particular class. Bayesian learning algorithms are among the most practical approaches to certain types of learning problems.
6.1.2. K-Nearest Neighbor
Nearest Neighbor classification is fundamentally utilized when all attribute values are continuous, and sometimes may be modified to work under categorical attributes. the main idea arise to estimate the classification
of an unseen instance by depending on using the classification of the instance or instances that are closest to it, in some sense that we need to define. If we have an categorical data set, then we must calculate its similarity with the training samples to determine its neighbors as :
Sim(X, S1) = 2, Sim(X, S2) = 2,Sim(X, S3) = 3, Sim(X, S4) = 1 until we reach Sim(X, Sn) = 1 where X is a test data set and Sn is the sample number in training set. Then we check the three largest values (Assume K=3) and check their class, and we take the class of the majority of them. we have the following neighbours of the test sample: S3, S13, and S14. The Class label of all these samples is “Cotton = No”. Thus, we assign this class label to our test sample(X). If the Dataset is Numerical data, then we will use Euclidean distance to determine neighbors by using the following Equation.
To determine class labels(that are also numerical) we will take the mean of class labels of k nearest neighbors but to determine class labels (that are nominal/categorical) we use the majority voting criterion.
6.1.3. Decision Tree
Decision Tree is defined a s" a Set of conditions organized hierarchically in such a way that the final decision can be determined following the conditions that are fulfilled from the root of the tree to one of its leaves". Decision Tree build a model (made up by rules) easy to understand for the user. Decision Tree only work over a single table, and over a single attribute at a time.
Most algorithms for growing decision trees are variants of a basic top-down-induction-of-decision-trees (TDIDT) algorithm, An example of this core algorithm is the ID3algorithm developed by Quinlan (1986),It employs a top-down, greedy search through the space of possible decision trees.
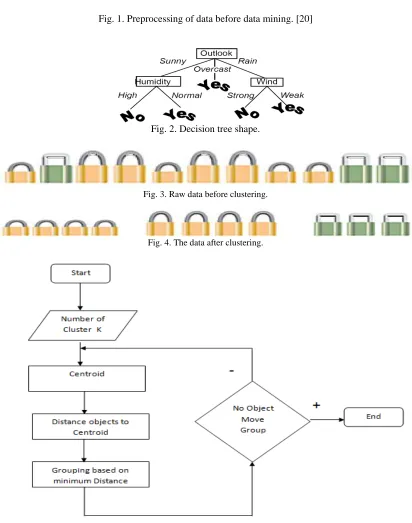
The final shape of Decision tree as in the following Figure (2)
After making the decision tree, we trace each path from the root node to leaf node, recording the test outcomes as antecedents and the leaf node classification as the consequent, So The Decision tree can be rewrite as an (IF... THEN...) rule, the Figure 3.23 can be write as follow:
- IF Outlook =Sunny and Humidity=High THEN Play is "No".
- IF Outlook =Sunny and Humidity=Normal THEN Play is "Yes".
- IF Outlook =Overcast THEN Play is "Yes".
- IF Outlook =Rain and Wind=Strong THEN Play is "No". - IF Outlook =Rain and Wind=Weak THEN Play is "Yes".
6.2.Clustering
Copyright © 2016 IJECCE, All right reserved The clustering technique use two clustering methods,
one of them is called "Partitioning" and the other is called "Hierarchical".
6.2.1 Partitioning Methods
These methods create “k” partitions in the data space, on the basis of a partitioning criterion where each partition represents a cluster. The number of partitions “k” is user given and the most commonly used partitioning method is means. The Lloyd's algorithm, mostly known as k-means algorithm, is used to solve the k-k-means clustering problem and works as follows. First, decide the number of clusters k. Then:
A-Initialization: set seed points
B-Assign each object to the cluster with the nearest seed point
C-Compute seed points as the Centroid of the clusters of the current partition (the Centroid is the centre, i.e., mean point, of the cluster), Go back to Step A, stop when no more new assignment. the K-mean algorithm is shown in figure (5)
6.2.2 Hierarchical Methods
Hierarchical Methods Use distance matrix as clustering criteria. This method does not require the number of clusters k as an input, but needs a termination condition. Hierarchical Algorithm depend on two steps:
A-We start with assuming that each data sample is a cluster.
B-We then repeatedly merge the closest pair of clusters.
VII.
C
LASSIFIERP
ERFORMANCEA classifier performance is a measure that is used to determine which of the previous techniques is a good one. Any algorithm which assigns a classification to unseen or new data samples is called a classifier, We can estimate or predict the performance of a classifier "Classifier Performance by :
7.1 Performance Measures
There are a lot of measures that are used to determine the performance of the classifier, using some of equations that calculate True Positive/Negative Rate, False Positive/Negative Rate and Accuracy, etc.
7.2 ROC Graph
ROC Graph stands for "Receiver Operating Characteristics Graph", which reflects its original uses in signal processing applications. The TP Rate and FP Rate values of different classifiers on the same test set are often represented diagrammatically by a ROC Graph, Each point on the graph is for a different classifier. Each classifier is represented by its FP rate (x value) and TP rate (y value) The points (0,1), (1,0), (1,1) and (0,0) correspond to Four special cases. The point (0,1) is the best possible. The point (1,1) corresponds to a very liberal classifier. This classifier always predicts the class of the test sample as positive. The point (0, 0) corresponds to an ultra-conservative classifier, This classifier always predicts the class of the test sample as negative.
VIII.
R
ESEARCHM
ETHODOLOGYIn this research we will use the Classification technique (Decision tree algorithm) to help in solving our Problem using a mining tool as Oracle Data Miner.
8.1 Suggestion Solution
To solve the problem that we construct a thesis for it, we will extract a great sample of data from a customer site data warehouse, then we will create a special database for this part of data as a data mart database. we will use a database oracle 11g with version 11.2.1.0 64bit production with the partitioning, OLAP, Data Mining and real application testing options. after that I will use an external compatible software that allows managing and browsing data inside the database in an easy manner. This compatible software is called (Toad for Oracle 11.5).
After that I will work on a great and best tool for applying the mining techniques under the specified data which I was extracted from the customer site, this tool is also produced from Oracle Company with the name of Oracle Data Miner. The latest version of Oracle Data Miner is now available in SQL Developer Release 3.2. Oracle Data Miner is comprised of three components that are Oracle 11g Release 2 Database and newer releases, SQL Developer (client) which bundles the Oracle Data Miner workflow GUI, Data Miner Repository - installed in the Oracle Database. then after using this mining tool we will extract a great important knowledge that will be presented to a higher strategic decision maker in REDF (Usually, ahead of REDF).
8.1.1 Sample of Loans Mining Data Base
It is clearly that the Mining database for loans need a lot of works to prepare the target data that i will intend to make a study on it, all of these works will be explained in details at the next chapter when talking about data mining and Environment Framework. The main tables used to make a study of the Saudi Citizen for loan are (Contracts table, Customer Repay table, Customer table and Region table) all of them are mention below in figure (6).
IX.
S
TRATEGY FOR
B
UILDING THE
T
ABLES
We will make a great effort to for building the previous tables. as we mention previously that we will have six main tables, three of them are look up tables. The problem and difficulty raise from the dealing with other three tables, on how to construct of them and how to select and pick the data from a large data ware house. so we will explain in a simplified manner all of these steps that build and fill the mentioned tables as follow.
1- A lot of Oracle SQL/PLSQL statements will be written to extract sample of data from our REDF Data warehouse, because the DW have millions of data that is very difficult to take it and make my study on it.
Copyright © 2016 IJECCE, All right reserved 3- The extracted data that express the period of the past
ten years, will contain the data for Six Regions only, that we will make a study on it. these Six regions are Riyadh, Mecca El Mokarama, Jazan, El Dammam, Asser, and Qassim Regions
4- Because of the available large amount of data and we only want to extract the data that express the past ten years for the mentioned six regions, so we will extract the percentage of contracts for every mentioned six regions according to total numbers of contracts that was issued in every year of the past ten 10 years. according to this percentage we will extract a random numbers of contracts for that region in that year a cording to extracted the percentage.
As that Customer table is an important table that will be used to make a mining algorithm on it is, so we should give a great specific information about its structure and variables values.
Customer table is an important table that contain twenty one (23) variables - eighteen of them are Stored a attributes, and two of them are derived attribute called Age at first repay date and age class variable - and 5,404 observations. Each observation, the information of one Customer/Borrower of the REDF, includes the following attributes as shown in Table (1).
In our study we will consider a “Class” as the target variable. A Class “Risky” or lower of it as “Very Risky “, mean that the borrowers not good in paying back loans moneys back to REDF so that, the Decision maker on REDF or on Ministry of Housing must take attention from borrowers from that region under some circumstance like (Age, Position, Education, Marital status). A Class “Safety” or higher of it as “Very Safety”, mean that borrowers are good in paying back loans moneys to REDF.
The quality of the dataset is not very good, with many missing values and data errors. Therefore, data preprocessing is important to guarantee quality data mining Results. During the study, we find that all the variable that have missing values are ass follow,
(CUST_MAIL with Missing rate 96.6%,
CUST_JOB_NUM with Missing rate 0.9%,
HOUSE_TYPE with Missing rate 0.6%, HOUSE_STATUS
with Missing rate 4.7%, ORG_CODE with Missing rate 28%). By seeing these missing rate for every variable, we will determine the useful and usefulness for every variable, and make a decision to remain it with some pre-processing or omit it directly.
The following features are some interesting findings from the exploratory study of the dataset, which may characterize the features of loan applicants in the Sex Regions of KSA.
1) Majority (about 94%) of loaners are male.
2) More than 82% of loaners are on military status “2” which mean a married.
3) Most of loaners are from Riyadh region 32.5%. 4) Most of loaners (42.4%) are in House type 2 which
means a "Flat".
5) Most of loaners (73.5%) are in House status 2 which means a " Rent house".
6) Most of loaners (63%) are from organization code 62 which means "Ministry of Education'.
7) Most of loaners (54%) are from age class “2” which means Class “young” from age between 36 and 56 years old….
8) Most contracts with loaners was signed in year 1424 with percentage of 9%.
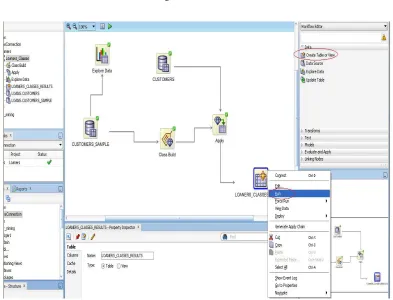
9.1 Build a Data Miner Model
A Data Miner Workflow is a collection of connected nodes that describe a data mining processes. A workflow, Provides directions for the Data Mining server. For example, the workflow says "Build a model with these characteristics." The model is built by the data mining server with the results returned to the workflow. The complete workflow example is as shown in the next Figure (7).
X.
I
NTRODUCE THER
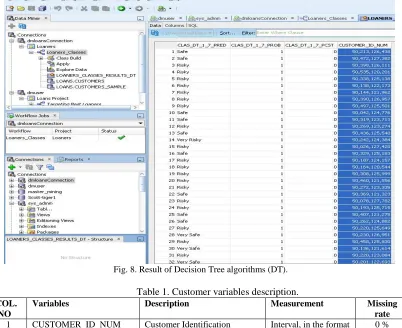
ESULTAfter we have constructed the Data Mining project with the workflow in the right manner, and after the model have been applied, then we can get the result according to the techniques and algorithms that has been used. Figure (8) show the result of Decision Tree algorithms.
As we have seen from the result table generated by Decision tree algorithms, we have realized many of facts that the most of borrowers lie on class "risky" and the lowest classification of them are "very Risk", as evidenced by the following diagram, Figure (9).
When we are looking to the pervious shape we can conclude that most of the borrowers lie on "safe" and "very safe " if we are combine of them together. so, we must look at this shape in many of views by considering the age class, sex type, marital status, house status and job.
XI.
C
ONCLUSIONSCopyright © 2016 IJECCE, All right reserved explicit decision suggestions or solutions. The mission of
DMDSS is to offer an easy-to-use tool which enables business users to exploit data mining models with only a basic level of understanding of the data mining concepts, which enables them to interpret the models correctly.
XII.
F
UTUREW
ORKAt this point we were took a great knowledge about the data mining, its definition and its relationship with the data Base Repository types. After that, we were known all the terminology that is used with data mining, (Training dataset, test dataset, labeled and unlabeled dataset). Then we study the techniques in data mining that we can use to generate the experiment. These techniques as Classification, Clustering and Decision tree. and how we can pick the best a algorithm according to our dataset. After that we were learned how to prepare our data set against missing values and noisy data before mining process. In future if we wish to use a dataset to find any relationship that exists among the values of variables (attributes). These relationships are captured in the form of rules called "Association Rules". Also in the future we can search how to integrate two of mining techniques to work together in the same data set.
R
EFERENCES[1] U. Fayyad, G. Piatetsky-Shapiro, and P. Smyth, “From data mining to knowledge discovery in databases,” AI Mag., vol. 17, pp. 37–54, 1996.
[2] J. Han and M. Kamber, Data Mining: Concepts and Techniques. San Francisco, CA: Morgan Kaufmann, 2001.
[3] W. Dwinnell, “Data visualization tips for data mining: pattern recognition provides data insight,” PC AI Mag., vol. 16.1, pp. 51–57, 2002.
[4] Assessing Loan Risks: A Data Mining Case Study Rob Gerritsen. http://xore.com/casestudies/dm_at_usda_(itpro).pdf [5] Discovering Golden Nuggets: Data Mining in Financial
Application Dongsong Zhang and Lina Zhou.
[6] Applying Data Mining Techniques to Evaluate Applications for Agricultural Loans (Emile Salame,2011) University of Nebraska-Lincoln, [email protected]
[7] Identifying Potential Default Loan Applicants - A Case Study of Consumer Credit Decision for Chinese Commercial Bank1 Qiwei Gan, Binjie Luo Southwestern University of Finance and Economics, Chengdu, Sichuan, China Zhangxi Lin Texas Tech University Lubbock, TX, USA (2008)
[8] S. Taylor, Modeling Financial Time Series. New York: Wiley, 1986.[5] A. N. Refenes, A. D. Zapranis, and Y. Bentz, “Modeling stock returns with neural networks,” presented at the Workshop on Neural Network Applications and Tools, London, U.K., 1993.
[9] Taylor, James (2012). Decision Management Systems: A Practical Guide to Using Business Rules and Predictive Analytics. Boston MA: Pearson Education. ISBN 978-0-13-288438-9.
[10] M. Schumann and T. Lohrbach, “Comparing artificial neural networks with statistical methods within the field of stock market prediction,” presented at the 26th HICSS, Wailea, HI, 1993.
[11] M. Ankerst, “Visual data mining with pixel-oriented visualization techniques,” presented at the ACM SIGKDD Workshop on Visual Data Mining, San Francisco, CA, 2001. [12] LFE, “Financial Visualization,” Lab. Financial Eng., MIT Sloan
Rep., 2003. [26] F. Xiong, E. C. Prakash, and K.W. Ho, “E-R modeling and visualization of large mutual fund data,” J. Visualiz., vol. 5, no. 2, pp. 197–204, 2002.
[13] E. Altman, “Financial ratios, discriminant analysis, and the prediction of corporate bankruptcy,” J. Finance, vol. 23, pp. 589–609, 1968.
[14] B. Back, T. Laitinen, K. Sere, and M. V. Wezel, “Choosing bankruptcy predictors using discriminant analysis, logit analysis, and genetic algorithms,” Turku Center Comput. Sci., Finland, Tech. Rep. 40, Sept. 1996.
[15] K. S. Shin, “A genetic algorithm application in bankruptcy prediction modeling,” Int. J. Expert Syst. With Applic., vol. 23, pp. 321–328, 2002.
[16] B. A. Jain and B. N. Nag, “Performance evaluation of neural network decision models,” J. Manag. Inform. Syst., vol. 14, pp. 201–216, 1997.
[17] G. Zhang and M. Y. Hu, “Neural network forecasting of the British pound/US dollar exchange rate,” Int. J. Manag. Sci., vol. 26, pp.495–506, 1998.
[18] Y. Yoon, G. Swales, and T. M. Margavio, “A comparison of discriminant- analysis versus artificial neural networks,” J. Oper. Res. Soc., vol.44, pp. 51–60, 1993.
[19] H. Iba and T. Sasaki, “Using genetic programming to predict financial data,” presented at the 1999 Congr. Evolutionary Computation, Washington, DC, 1999.
[20] Max Bramer, BSc, PhD, CEng, FBCS, FIEE, FRSA, Digital Professor of Information Technology, University of Portsmouth, UK "Principles of Data Mining"
[21] “Using genetic programming to predict financial data,” in IEEE Congr. Evolutionary Computation, Washington, DC, 1999. [22] R. M. Stein and R. N. Bernard, “Data mining the future: genetic
discovery of good trading rules in agent-based financial market simulations,” presented at the IEEE/IAFE/INFORMS 1998 Conf. Computational Intelligence for Financial Engineering, New York, 1998.
[23] H. Tsurumi and T. Nakatsuma, “Bayesian analysis of doubly truncated regression models with ARMA-GARCH errors with an application to stock returns and foreign exchange rates,” presented at the 4th World Meeting Int. Soc. Bayesian Analysis, Cape Town, South Africa, 1996.
Copyright © 2016 IJECCE, All right reserved Fig. 1. Preprocessing of data before data mining. [20]
Fig. 2. Decision tree shape.
Fig. 3. Raw data before clustering.
Fig. 4. The data after clustering.
Copyright © 2016 IJECCE, All right reserved
Fig. 6. Contract table.
Copyright © 2016 IJECCE, All right reserved
Fig. 8. Result of Decision Tree algorithms (DT).
Table 1. Customer variables description. COL.
NO
Variables Description Measurement Missing
rate
1 CUSTOMER_ID_NUM Customer Identification Number
Interval, in the format of 99999999999
0 %
2 CUST_SEX Customer sex Binary
1 Male 2 Female
0 %
3 CUST_MARITAL_STAT US
Marital status 1 = Single 2 = Married 3 = widow 4 = absolute 5 = orphan 6 = dead 7 = spinster
8 = married to a foreigner 9 = orphan married
Ordinal 0 %
4 CUST_BIRTH_DATE Customer birth date Interval, in the format of
yyyymmyy (Hijra date)
0 %
5 CUST_MAIL Customer mail 96.6 %
6 CUST_JOB_NUM Customer job Nominal 0.9 %
7 CUST_F_NAME Customer name 0 %
8 CUST_S_NAME 0 %
9 CUST_TH_NAME 0 %
10 REGION Region code of Contract Nominal 0 %
11 CITY City code of Contract Nominal 0 %
12 CONT_NO Contract number Nominal 0 %
13 HOUSE_TYPE House Type 1 Villa 2 Flat 3 Others
Binary 0.6 %
14 HOUSE_STATUS House Status 1 Private 2 Rent
Ordinal 4.7 %
Copyright © 2016 IJECCE, All right reserved
16 FIRST_REPAY_DATE First repay date Interval, in the format of
yyyymmyy (Hijra date)
0 %
17 LAST_REPAY_DATE Las repay date Interval, in the format of
yyyymmyy (Hijra date)
0 %
18 AGE_AT_FIRST_RPAY_ DATE
Customer age at First repay date
Interval 0 %
19 AGE_CLASS Class Degree of age 1,2,3,4,5
0 %
20 CONTRACT_DATE Contract date Interval, in the format of
yyyymmyy (Hijra date)
0 %
21 AGE_CLASS_C Character class of age Class 1 youngest from 15 - 35 Class 2 young from 36- 56 Class 3 old from 57- 77 Class 4 older from 78- 98 Class 5 very old from 99- 122
Ordinal 0 %
22 CLASS Class degree of customer loan status
1,2,3,4,5,6
Ordinal
23 CLASS_C Character of Class degree Class 1 Very Safety Class 2 Safety Class 3 Risky Class 4 Very Risky Class 5 Bad