Iranian Rehabilitation Journal, Vol. 10, February 2012
Iranian Rehabilitation Journal
37
*All Correspondences to: [email protected]
Original Article
Ergonomic Evaluation of Interior Design of Shoka Vehicle and
Proposing Recommendations for Improvement
Adel Mazloumi*, PhD
Department of Occupational Health, School of Public Health, Tehran University of Medical Sciences, Tehran, Iran
Mohammadreza Fallah, MSc
Department of Ergonomics, University of Social Welfare and Rehabilitation Sciences, Tehran, Iran
Hedayat Tavakoli, MSc
Department of Occupational Health, Polytechnic University of Chamran, School of Public Health, Tehran University of Medical Sciences, Tehran, Iran
Objectives: One of the applications of ergonomics disciplinary is designing driver workstation
compatible to users’ characteristics. The aim of this study was evaluation of interior design of Shoka vehicle with respect to the accommodation for Iranian population and proposing suggestions for customizing design of the vehicle.
Method: This study was a descriptive-analytical study conducted among thirty men from Iranian drivers
population in 5, 50, 95 percentiles of the stature variable. Objective variables related to the occupant packaging and vehicle visual aspects including anthropometric variables, frontal, lateral, and side view and so on were investigated first. Then, subjective variables related to the driver mental workload and body comfort discomfort were studied using BMDMW and comfort questionnaires during 2-hour driving trial sessions.
Results: Occupant packaging variables and hand-arm angle showed the least accommodation percent
(%53). Seating angles showed low accommodation as well (%73). Among three percentile groups there were no significant differences between the mean values of mental workload during two hours driving task. The mean value related to the comfort discomfort was 3.9 during driving sessions.
Conclusion: Considering the findings in this study, it can be concluded that seating angles need
correction and optimization. Taking mental workload results into account, it can be concluded that the interior design of the studied car had no influence on drivers’ mental workload. From the aspect of comfort/discomfort, Shoka vehicle showed neutral state among drivers. Optimizing seating angles, decreasing vibration, correcting stiffness of seating pan are suggested for customization of the ergonomics aspect of this vehicle.
Keywords: Ergonomic evaluation, Vehicle, Shoka, Anthropometric, Compatibility
Introduction
Safety and comfort are of the most important criteria for both car manufacturing companies and for drivers as well as occupants from many points of views. Therefore considering the principles of ergonomics in automotive design will make remarkable benefits to many extents (1).
Different researches have shown that fatigue played an important role in incidence of thirty percent of traffic accidents. One of the major causes of fatigue while driving is the car interior design. Features such as seats, steering wheel and pedals have shown a large impact on driver fatigue. The interior design
Vol. 10 – Special Issue – Ergonomics
٣٨
38
Several ergonomics indicators are used by car manufacturing companies for car design evaluation. These indicators are either qualitative (subjective) or quantitative indicators. Qualitative indicators are achieved with the use of questionnaires and special checklists among users population. Quantitative indicators such as anthropometric measures, access limits, forces and so on are also used to evaluate interior design and its compatibility with the user population in different percentiles.
Several questionnaires, such as BMDMW and body comfort-discomfort questionnaire, have been published to evaluate the vehicle design. BMDMW questionnaire is a subjective measure based on driving behavioral patterns which evaluate drivers’ mental workload and state. Body comfort discomfort questionnaire also evaluate whole body and comfort-discomfort related to body limbs.
Quantitative indicators to assess ergonomics-related aspects of interior design are generally related to the design dimensions. Dimensions can indicate human accommodation; and many research studies are based on evaluating those dimensions in 5, 50, 95 percentiles. The greatest differences in anthropometric values that are more relevant to the driver accommodation are three variables: stature, sitting height and weight. But, some research studies have shown that stature is the most important anthropometric variable involved in the automotive design (8). Occupant packaging can be used for ergonomic quantitative evaluation of car design when considering stature as an anthropometric variable. Occupant packaging is the interior design process of a vehicle to achieve a good level of accommodation, comfort and safety for passengers. The most relevant to the ergonomics variables when considering occupant packaging are: interior dimensions (SAE J1100), hand control reach (SAE J287), ellipse (SAE J941) and driver selected seat position (SAE J1517 (5). The optimal dimensions of the anthropometric data that utilized for ergonomic design are valuable; but it dose not comprehensively cover other aspects of vehicle design such as: ease of use, comfort, field of view and safety aspects (6). That is the reason why vehicles are evaluated after design process. Particularly, if the vehicle would be an imported car, its design features and compatibility with the end users are of crucial importance. Car manufacturers that are not original designer and they just assemble car products need to do researches in the field of vehicle ergonomics evaluation.
Methods and materials
This study was a cross-sectional case study to evaluate the Shoka vehicle. It is a small truck car as a new model of the Nissan Z 24 which is manufactured in Zamyad Car Company in Iran. Main chassis as well as engine for this car are exactly for the Nissan model Z 24. But, its body is completely a new design. There were two groups of variables to evaluate this car:
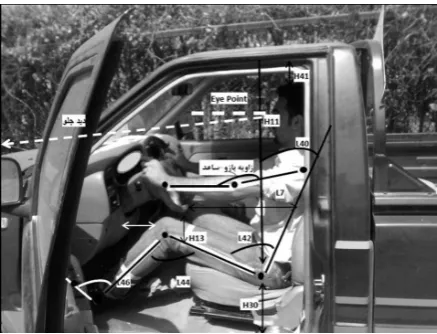
1) Quantitative variables selected from occupant packaging, and were related to SAE J1100 (interior dimensions), SAE J941 (driver's eye location) SAE J1517 (accommodation) these variables and the comparison standard values are shown in Table 1. Tools used for measuring these variables included: goniometer, rulers in various sizes, tape and label as marker. Sitting pattern in the vehicle, definitions of the variables and measuring methods and required adjustment of the vehicle during measurement activity was done according to the requirements of the SAE J1100 standard. Reference points of measurement were: seating reference point (SgRp), accelerator heel point (AHP) and Pedal Reference Point (PRP) that the other variables were determined with respect to these points (11).
Vision related quantitative variables included: nearest visible point on the ground from left sides and front that determined by a marker in meter Fig 1 shows the quantitative variables related to this study. 2) Qualitative variables:
Qualitative variables were investigated using BMDMW and body comfort-discomfort questionnaires during 2-hour driving sessions. The
Table 1. Variables related to the occupant packaging and its
reference values
Reference value Variable
Existing extra space on top of the driver’s head
H41 (Head Clearance)
Can be specified compare with H41
H11
Existing extra space between steering wheel and abdomen L7 (Steering wheel and
abdomen clearance)
Existing extra space between thigh and steering wheel
H13 (Thigh and steering wheel clearance)
Existing extra horizontal space between driver’s Knee and steering wheel
Knee clearance
20- 30
L 40 (Trunk angle)
95- 120
L 42 (Buttock angle)
95-135
L 44 (Knee angle)
80-130
L46 (Foot angle)
80-160
Iranian Rehabilitation Journal
٣٩
39
BMDMW questionnaire, which evaluates drivermental workload, has been developed by Francesco Di Nasera in Rome University (3). Reliability and face validity of the BMDMW questionnaire was investigated and confirmed after translating into Persian language. BMDMW has six internal factors include: Disengagement, Vehicle Monitoring, Route Monitoring, Road Awareness, Control and Fatigue and has Likert scale that shows driving events from one" rarely" to five "high "(3). Variables related to comfort-discomfort were collected during the two-hour road trial sessions by body comfort-discomfort questionnaire. This is one of the common tools for assessing comfort-discomfort that measures comfort-discomfort state by averaging twelve members state of the body during the driving. Validity and reliability of this questionnaire has been done in previous researches (4, 5).
This questionnaire has seven point Likert scale that shows comfort-discomfort state from one “very comfortable” to seven “very uncomfortable” (4). Data for the occupant packaging and vision was collected first and then, after a two-hour road trial test the questionnaires were administered by selected drivers as participants. Statistical software of SPSS version 15 was conducted for data analysis. Data analysis included two parts: examine the aspects of the mean and standard deviation of the variables related to the descriptive statistics. Then from aspect of analytical statistics data normality was assessed by Kolmogorov-Smirnov test and normal data was used for the ANOVA test to examine mean differences.
Fig 1. Quantitative variables
Results
Considering demographic variables of the three percentile groups, there is a significant difference
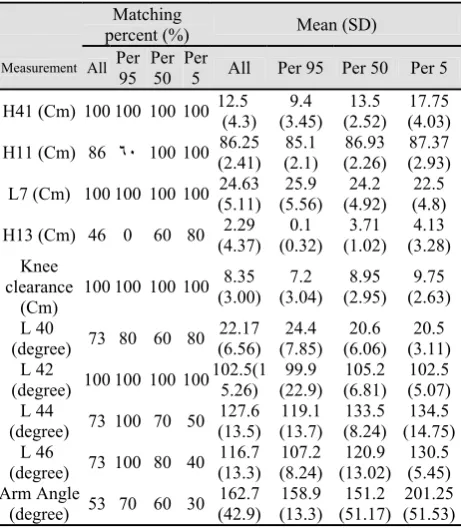
between the averages values of the participants’ weights and heights (Table 2). However, no significant differences were seen in body mass index. Most participants (88%) of the study were in normal range of BMI. Table 3 shows the percentages of users’ accommodation with dimensions of the interior design. It is a full accommodation for the following variables: head clearance, steering wheel and abdomen clearance knee clearance (100% of participants). Minimum accommodation was observed for the arm angle (53%) and steering wheel and thigh clearance (46%). Between the groups, minimum accommodation has been seen in these factors: steering wheel and thigh clearance (0%) in percentile of 95, arm angle (30%) in percentile of 5, leg angle (40%) and Knee angle (60%) in percentile of 5.
Table 4 shows the values related to the front and side view of the vehicle. According to the table, maximum values of the nearest visible point on the ground from front side (M = 438.7 Cm, SD = 36.93) left side (M = 129.3 Cm, SD = 14.7) and right side (M = 420.9 Cm, SD = 37.8) belong to the percentile of 95 while for the percentile of 5 front sides (M = 598.2Cm, SD = 35.2) right side (M = 550.5Cm, SD = 33.2) and the left side (M = 156.1Cm, SD = 21.2) are minimum .
The Results of the BMDMW questionnaire was shown in table 5. Comparison tests related to the mental workload in three percentile groups shows that there are no significant differences between the average values. (P = 0.09). The factor of "control” only shows significant difference between groups. Especially between percentiles of 5, 50(P = 0.001), and 5, 95 (P = 0.002), but it wasn’t seen between percentiles of 50 and 95 (P = 1.00).
Vol. 10 – Special Issue – Ergonomics
۴٠
40
Discussion
The finding related to the occupant packaging in table 2 showed that the entrance height is matched to the 86.6% of the participants, only percentile of 95 has lower compatibility (60%). This means that drivers with the percentile of 95 have to bend their necks while entering to this car. For further matching it’s needed to increase the height of the door frame. Head clearance matches to the 100% of the drivers; this means that drivers will not be forced to bend their heads to correct this situation. The clearance of the Knee-dashboard and steering wheel-abdomen is matched to the 100% of the drivers so there is no problem with these dimensions. The clearance related to the thigh-steering wheel matches to the 53% of the drivers but for the percentile of 95 this value is zero it means drivers have to open their legs while driving in order to make a space between their legs for steering wheel. This constraint, may lead drivers to commit human error in emergency situations. Sitting angles in a vehicle starts from trunk angle (L40), hip angle (L42), knee angle (L44) and finally leads to foot angle (L46). Except to hip angle that matches with the 100% of the participants, other angles showed 73% of matching. These angles need redesign with taking this point to account that changing one angle will lead to change in other angles. Therefore, the only issue that should be considered is that the hip angle should be kept constant because it has 100% of the adjustment. Recommendations for comfortable range of the angles are based on the assumption that when all angles are in the neutral position, minimal stress will be for the involved muscles. These values are usually in the middle range of the joints motion and during this situation the muscles are in the relaxed state (13). The angles of trunk (L40), hip (L42), knee (L44) and foot (L 46) are main angles while sitting in a vehicle, especially the knee angle is one of the most effective angles in driver’s comfort. When this angle is out of its normal range, tension in the hamstring muscles will occur, and as these muscles are attached to the knee and hip, tension makes the pelvis move backward and subsequently normal rake of the lower back will disappear (13). Knee angle in this study matches with the 73% of the participants. Bending twenty degrees in trunk angle will reduce back muscles activity and increases hip angle (L44) so it will be effective on driver’s comfort (13).
Table 2. One way AVOVA results for demographic variables
between three percentile groups
Mean (SD) variables
All Per 95 Per 50 Per 5 Sig F Stature (Cm) 176 (7) 184 (3.1) 174 (2.4) 163
(1.6) 0.001 9.40 Weight (Kg) 76.91 (12.4) 86.2 (11.5) 72.6 (7.73) 64.2
(6.5) 0.00 85.68 BMI (2.88) 24.49 (3.52) 25.38 (2.44) 24 (2.01) 23.57 0.477 0.767
Table 3.Results related to the occupant packaging
Mean (SD) Matching percent (%) Per 5 Per 50 Per 95 All Per 5 Per 50 Per 95 All Measurement 17.75 (4.03) 13.5 (2.52) 9.4 (3.45) 12.5 (4.3) 100 100 100 100 H41 (Cm) 87.37 (2.93) 86.93 (2.26) 85.1 (2.1) 86.25 (2.41) 100 100 ٦٠ 86 H11 (Cm) 22.5 (4.8) 24.2 (4.92) 25.9 (5.56) 24.63 (5.11) 100 100 100 100 L7 (Cm) 4.13 (3.28) 3.71 (1.02) 0.1 (0.32) 2.29 (4.37) 80 60 0 46 H13 (Cm) 9.75 (2.63) 8.95 (2.95) 7.2 (3.04) 8.35 (3.00) 100 100 100 100 Knee clearance (Cm) 20.5 (3.11) 20.6 (6.06) 24.4 (7.85) 22.17 (6.56) 80 60 80 73 L 40 (degree) 102.5 (5.07) 105.2 (6.81) 99.9 (22.9) 102.5(1 5.26) 100 100 100 100 L 42 (degree) 134.5 (14.75) 133.5 (8.24) 119.1 (13.7) 127.6 (13.5) 50 70 100 73 L 44 (degree) 130.5 (5.45) 120.9 (13.02) 107.2 (8.24) 116.7 (13.3) 40 80 100 73 L 46 (degree) 201.25 (51.53) 151.2 (51.17) 158.9 (13.3) 162.7 (42.9) 30 60 70 53 Arm Angle (degree)
Table 4.One way AVOVA test for driver’s view between three
percentile groups
Mean (SD)
F Sig Per 5 Per 50 Per 95 All Measurement (Cm) 10.04 0.001 60.9 (3.3) 64.6 (3.6) 66.6 (2.9) 64.8 (3.8) Eye point 37.02 0.000 598.2 (35.2) 446.5 (31.5) 420.9 (37.8) 461.2 (12.3) Right side view 5.00 0.017 156.1 (21.2) 130.3 (12.4) 129.3 (14.7) 134.2 (17.6) Left side view 3.93 0.035 550.5 (33.2) 460.4 (31.8) 438.7 (36.9) 466.3 (58.8) Front side view
Table 5. One way AVOVA test for driver’s Mental workload
All
Iranian Rehabilitation Journal
۴١
41
Allparticipants Groups Sig F Mean (SD)
Item
1.31 0.28 Between
groups 11.29 (2.05)
Disengagement
0.71 0.50 Between
groups 12.16 (2.53)
Vehicle monitoring
-0.22 0.78 Between
groups 8.9 (2.30)
Route monitoring
3.26 0.058 Between
groups 18.6 (3.39)
Road awareness
0.533 0.594 Between
groups 11.7 (3.58)
fatigue
9.67 0.001 Between
groups
9.67 0.007 Between Per
of 5, 50
9.67 1.00 Between Per
of 50, 95
9.67 0.002 Between Per
of 5, 95 17.2 (2.82)
control
Table 6. One way AVOVA test for driver’s comfort-discomfort
Mean (SD)
F Sig Groups Per 5 Per
50 Per
95 All Item
0.559 0.59
Between groups
3.7 (0.8) 3.8 (0.5) 3.9 (0.6) 3.8 (1.5) Whole body
comfort discomfort
1.00 0.38
Between groups
3.5 (0.9) 3.9 (0.5) 4.09 (0.7) 3.9 (1.5) Upper extremity
comfort discomfort
0.04
Between groups
0.04
Between Per of 5,
95
0.24
Between Per of 5,
50
3.6
0.92
Between Per of 50, 95
3.5 (1.2) 3.8 (0.7) 4.1 (0.7) 3.7 (1.6) lower extremity
comfort discomfort
Table 7. Results related to the comfort-discomfort
Participants reports (%) Whole
body Upper
extremity Lower
extremity Body state
0 0
0 very
comfortable
4.1 4.1
12.5 comfortable
25 29.1
33.3 relatively
comfortable
58.33 50
37.5 neutral
12.5 16.6
12.3 relatively
discomfort
0 0
4.1 discomfort
0 0
0 very discomfort
The value of the “nearest visible point on the ground” for all participants is 4.66 (m), from the right side 4.61 (m) and left is 1.34 (m) for the left side. Decreasing in the values of these variables has positive effects on longitudinal and lateral vehicle control. Particularly, this would be more important in traffic situation and urban areas. When a driver cannot be able to see less than 4.5 meters away from his/her vehicle, certainly in traffic situation he/she would have less perception of distance from other vehicles which this may lead to error in perception and recognition and increases incidence of accident (12).
Reduction in the visible point distance is very effective to control a vehicle when turning to left and right. In residential areas the minimum visible height by a driver (the height of a child's stature, 0.9-1m) has been suggested as a factor for good visual design, this is obtained by measuring the nearest visible point on ground. Increasing H-point height that subsequently leads to increased eye height with considering its impact on the other parts and controls of a vehicle will be effective on improving driver’s vision. Setting corrective changes in front bulge design of the hood will affect visibility of this vehicle too (12). Total score related to the BMDMW Questionnaire shows that the percentile of 5 has the lowest score and the highest one belongs to the percentile of 95. So, it can be said that with increasing stature values of the participants the overall score related to the questionnaire has been increased. But, there were no significant differences between the mean values of the three percentile groups. It can be concluded that the interior dimensions have no significant effects on the driver’s mental workload.
Vol. 10 – Special Issue – Ergonomics
۴٢
42
difference in mean values between three percentile groups. Considering various statures of the participants and no significant differences in fatigue values in the current study, it can be concluded that the vehicle interior dimensions doesn’t have remarkable effects on driver’s fatigue. Maybe other factors like: softness and rigidity of the seat, vibration in the vehicle, contact pressure be effective on driver’s fatigue (3). Results related to the Comfort- discomfort levels in the participants indicated that whole body comfort-discomfort is similar between the three percentile groups and all of the participants evaluated this vehicle relatively comfort to neutral. In SAE J1100, which is about the interior dimensions has been noted that these recommendations aren’t criteria for driver comfort (11). Kolish has denied the overall role of the conventional dimensions and ergonomic standards on driver’s comfort too (14). However, some previous studies have emphasized on effects of the internal dimensions especially angles on driver’s comfort (15). The comfort-discomfort results related to the participants’ upper extremities show “relatively comfort” to “neutral” states between the drivers. This means that the participants with various body sizes experienced similarly comfort discomfort in their upper extremities. Knee and foot angles of the small drivers show less accordance toward the taller ones; this means that despite
Low accordance in lower extremities, small drivers
have more convenience than the taller ones. So the recommendation of the SAE J1100 that notes standard dimensions aren’t criterion for driver comfort has been approved in this study (14).The findings in current study were similar to Gyouhung’s study too. He pointed out that discomfort variation in young drivers is related to lower extremities. But, in elderly people it is about upper extremities (14).
Conclusion
Considering the findings of this study it can be concluded that some changes in interior dimensions specially in sitting angles required in this vehicle. These changes should cover the entire percentile groups. The angles of trunk and hand-arm should be increased and the angles related to the knee and foot should be decreased. This car has neutral conditions for Iranian drivers. Vehicle interior dimensions have no remarkable effects on whole body comfort-discomfort and other factors like: softness and rigidity of the seat, vibration of the vehicle and contact pressure will be effective on the driver’s comfort-discomfort. Tall drivers have more control over the vehicle. Fatigue, vehicle monitoring, route monitoring are same between the drivers with different statures. Changes in H-Point, front hood bulge and wipers would be effective ways for improving driver view.
References
1. Saadati Y. transferring vehicle ergonomic design technology and using for vehicle design in iran khodro car production company, R&D department of iran khodro company, 2007.
2. Regan MA. Driver Distraction Theory, Effects, and Mitigation, Taylor & Francis Group, LLC, 2009, 384 3. Information Society Technologies Programme (IST),
Adaptive Integrated Driver Vehicle Interface (Aide) , Subjective Assessment For Workload, Aide_SP2_WP2.2_D226.doc, 37-40, 48, 76, 85, 110.
4. Kyung G. Integrated An Human Factors Approach To Design And evaluation of The Driver Workspace And Interface: Driver Perceptions, Behaviors, And Objective Measures, Blacksburg, 2008, pp 9, 14-20, 224, 34, 63, 88, 113, 126, 188.
5. Happian-Smith J. An Introduction to Modern Vehicle Design, Butterworth-Heineman Publication, First published 2002, Chapter 9, pp: 233. 234, 239, 256, 252, 254.
6. Ziolek S. Beyond Percentiles: An Examination of Occupant Anthropometry and Seat Design, Schukra of North America, 2004.
7. Parkinson MB. Optimizing Vehicle Occupant Packaging, Engineering Design, The Pennsylvania State University,
2006.
8. Reed MP. The Effects of Vehicle Interior Geometry and Anthropometric Variables on Automobile Driving Posture, University of Michigan Transportation Research Institute, Ann Arbor, Michigan.
9. www.zamyad.com.
10. www.dined.io.tudelft.nl/en, International, 19.
11. SAE Handbook. Society of Automotive Engineers SAE International, Warren dale, SAE j941,pp 34, 242, SAEj1517, 1996, pp 34,112.
12. Peacock B and Karwowski W. In Automotive Ergonomics, Taylor and Francis, London, 1996, pp: 28, 34, 39.
13. Reed MP. Survey of Auto Seat Design Recommendations for Improved Comfort, Michigan Transportation Research Institute (UMTRI), 2000 pp: 37, 47, 80, 81, 87.
14. Kolish M. Seat Comfort: Occupant preferences Vs Anthropometric Accommodation, Department of Industrial & Manufacturing System Engineering, University of Wisdsor, ont, Canada, 2002.