Patient Experience Journal
Volume 5
Issue 2
Patient & Family Experience in Children’s
Hospitals and Pediatric Care
Article 14
2018
Wait time reality check: The convergence of
process, perception, and expectation
Marian Hill
Texas Children's Hospital, [email protected]
Lorianne Classen
Texas Children's Hospital, [email protected]
Andrea Romay
Texas Children's Hospital, [email protected]
Erika Diaz
Texas Children's Hospital, [email protected]
Follow this and additional works at:
https://pxjournal.org/journal
Part of the
Health and Medical Administration Commons
,
Health Communication Commons
,
Health Services Administration Commons
, and the
Health Services Research Commons
This Case Study is brought to you for free and open access by Patient Experience Journal. It has been accepted for inclusion in Patient Experience Journal by an authorized editor of Patient Experience Journal.
Recommended Citation
Hill, Marian; Classen, Lorianne; Romay, Andrea; and Diaz, Erika (2018) "Wait time reality check: The convergence of process, perception, and expectation,"Patient Experience Journal: Vol. 5 : Iss. 2 , Article 14.
Wait time reality check: The convergence of process, perception, and
expectation
Cover Page Footnote
Acknowledgments The authors thank Dr. Larry Hollier for his vision and guidance throughout the journey.
Also, we thank our West Campus surgery team for their support and consistent efforts to improve the patient
experience. The authors specifically thank Dr. Allen Milewicz, Jennifer Sanders and Madilyn Zbranek for their
eagerness to spearhead novel analysis and improvement efforts. We thank Ramzey Ibrahim for technical
assistance throughout the project and Texas Children’s ambulatory surgery leadership team for their
dedication to continuously improving the patient experience.
Patient Experience Journal
Volume 5, Issue 2 – 2018, pp. 109-115
Patient Experience Journal, Volume 5, Issue 2 – 2018
© The Author(s), 2018. Published in association with The Beryl Institute and Patient Experience Institute
Downloaded from www.pxjournal.org 109
Case Study
Wait time reality check: The convergence of process, perception, and
expectation
Marian Hill, MSE,
Texas Children’s Hospital
, [email protected]
Lorianne Classen, MPH,
Texas Children’s Hospital
, [email protected]
Andrea Romay, MBA,
Texas Children’s Hospital
, [email protected]
Erika Diaz, BA, CCLS,
Texas Children’s Hospital
, [email protected]
Abstract
There are few experiences as ubiquitous to patients as the experience of waiting. It is an occurrence that transcends diagnosis, is common to all demographics, and is shared across the continuum of care. The experience can be frustrating and full of ambiguity for patients and their families. Wait time and delays can lead to patients sensing a loss of control and magnify the feelings of anxiety they may already be suffering. In an effort to improve patient experience, a framework was developed to examine patient satisfaction as a function of expectations, perceptions, and reality. The process domain focused on the objective reality of the pre-surgical lead times; while the expectation and perception domains focused on the family understanding of the timeliness of the pre-surgical process prior to, and directly following the experience. Guided by this framework, data was collected and analyzed at surgical units throughout the
Texas Children’s Hospital system. Insights gained from this analysis identified distinct needs where focused
improvement approaches could be implemented. Throughout this paper, we will provide insight into the framework developed, case studies illustrating its effectiveness and insights as to how it can be applied at any healthcare organization to improve patient satisfaction.
Keywords
Patient experience, patient satisfaction, process improvement, delays, wait time, timeliness, perception, expectation, surgery, preoperative, framework
Introduction
While the healthcare industry strives to optimize health and reduce suffering for patients and families, a major area of focus operationally continues to be reducing exposure to process deficiencies that create additional patient suffering through unnecessary waits.1 This may not come as a surprise as timeliness was one of the six dimensions
outlined in The Institute of Medicine’s 2001 report “Crossing the Quality Chasm”.2 Even with all this focus placed on timeliness, waiting remains as one of the most ubiquitous experiences for patients and their families.
Texas Children’s Hospital has long held patients at the
forefront of all operations. Given that surgical procedures have the potential to involve traumatic stress for pediatric patients2, Texas Children’s surgical leadership placed a particular focus on minimizing anxiety through a portfolio of improvement efforts. As a result, patient experience scores continued improving; however, one particular area continued to be a challenge for the surgical team: wait time prior to surgery and information about delays.
Texas Children’s Hospital
Texas Children’s Hospital has one of the country’s largest
and busiest pediatric surgical programs, serving the global community with over 30,000 surgeries in 2017. In addition to a campus in the Texas Medical Center, the Texas
Children’s system includes community hospitals with surgical programs in Katy, TX (West Campus) and The Woodlands, TX. This study seeks to illustrate a framework
that has proven effective across Texas Children’s surgical
sites at aligning expectations and perceptions to reality, hence improving the overall waiting experience in the pre-surgical process.
Methods
In order to tackle the challenges around surgical wait times and information about delays, surgical leadership engaged
Wait time reality check, Hill et al.
110 Patient Experience Journal, Volume 5, Issue 2 – 2018
were delayed. In essence, the hospital’s operational definition of a delay was not aligned with patients’ and families’ view of a delay. Simply improving the on-time start metric would not improve the experience of patients and families.
To quantify and address the miss-alignment of delay definitions, the team established the following structure, which will be detailed throughout the paper:
1. Develop Framework for Patient Satisfaction based on Literature Review
2. Execute Framework a. Collect Data b. Analyze Data
3. Interpret Insights from the Framework to Drive Improvements
4. Execute Improvements
5. Quantify Impact of Improvements
Framework Development
David Maister, former Harvard Business School professor and expert on business management practices, proposed an equation to guide customer experience:
𝑆𝑎𝑡𝑖𝑠𝑓𝑎𝑐𝑡𝑖𝑜𝑛 = 𝑃𝑒𝑟𝑐𝑒𝑝𝑡𝑖𝑜𝑛 − 𝐸𝑥𝑝𝑒𝑐𝑡𝑎𝑡𝑖𝑜𝑛4
In this equation, the process does not impact patient satisfaction directly, but instead through perception and
expectation. Therefore, when studying a customer’s
experience, not only should the objective reality of the
service received be considered, but also the customer’s
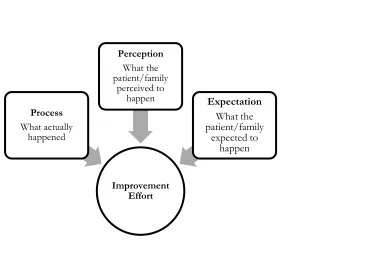
perceptions and expectation around that service. With this understanding, a framework was developed to guide data collection, data analysis and improvement strategies addressing delays in the pediatric surgical program. The framework includes three domains: process, perception and expectation. (Figure 1)
This framework changed the focus of the improvement team from purely process improvement to understanding and influencing the patient/family expectations and perceptions around the pre-surgical process.
Applying the Framework to Gain Insights
The concept of quantifying patient/family expectations and perceptions is novel for the hospital and required the development of operational definitions, data collection strategies, and analysis methods.
Operational Definition
Prior to this initiative, policies, processes, and patient materials were all aligned to indicate the total time prior to
Figure 1. Patient Experience Framework
Improvement Effort Process
What actually happened
Perception What the patient/family
perceived to
happen Expectation
What the patient/family
Wait time reality check, Hill et al.
Patient Experience Journal, Volume 5, Issue 2 – 2018 111
surgery would require 2 hours. However, based on the framework, a patient/family is defined to experience a delay any time the pre-surgical process was perceived to take longer than expected. Throughout the rest of this paper, the later will be used as the threshold for a delay.
With regard to pre-surgical wait times across Texas
Children’s Hospital surgical sites, the process can be
divided into two distinct segments based on the location of the patient and family: reception and pre-op. In many cases throughout this paper, the cycle times of these process segments (reception and pre-op) are used to illustrate focused improvement efforts and impact.
Data Collection Strategy
To ensure the integrity of data regarding a patient/family’s
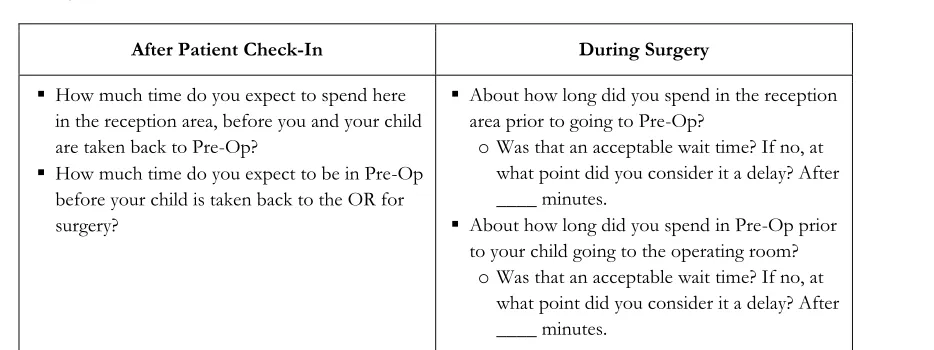
expectations or perceptions, it is imperative to build a data collection process that developed questions the families could understand. In order to do so, the team integrated patient and family feedback into the data collection strategy. The process began by brainstorming relevant questions and using them to guide conversations with families. These initial conversations allowed us to better gage their understanding of the pre-surgical process and hospital terminology, which was used to construct standard questions. These standard questions were then tested with a new set of families, focusing on adjusting the wording to ensure families were accurately and
consistently understanding the intent. A sample of the final questions is provided in Table 1.
The resulting list of questions was then structured into an electronic survey, to be administered by volunteers and reception staff via iPads.
Data Analysis
The expectation and perception responses received from families via the electronic survey were cross-referenced with their cycle time measurements for reception and
pre-op, which are extracted from the Texas Children’s
Hospital electronic medical record. This provided the team with a novel understanding of patient experiences
including what the family expected of their surgical visit, what the objective reality of the visit entailed, and what they perceived to have occurred. Due to the non-normal distribution of responses, median values will be used to describe the responses received.
Process
Cycle time measurements for these segments were analyzed to describe what Maister referred to as the
“readily measurable objective reality.”4 These process measures are provided in Table 2
.
Note that the data collection periods were varied in length and thus large differences in number of patients exist. This is due to the initial focus of the study isolated to Site A, with later expansion to the other surgical sites. The first observation that can be made is cycle times in these segments were extremely varied from site to site
.
Expectation
After reviewing the patient/family responses to the expectation questions, there were inconsistencies for many patients between expected times and when the families consider it a delay – meaning, a family may say they expected to spend 30 minutes in Reception, but later indicated that they considered it a delay after 45 minutes. For the purposes of this study, the team chose to use the latter as our threshold for delay whenever an inconsistency existed. See Table 3.
Again, it can be noted that estimates were extremely varied from site to site and between process segments.
Table 1: Family Questionnaire
After Patient Check-In During Surgery
▪ How much time do you expect to spend here in the reception area, before you and your child are taken back to Pre-Op?
▪ How much time do you expect to be in Pre-Op before your child is taken back to the OR for surgery?
▪ About how long did you spend in the reception area prior to going to Pre-Op?
o Was that an acceptable wait time? If no, at what point did you consider it a delay? After ____ minutes.
▪ About how long did you spend in Pre-Op prior to your child going to the operating room?
Wait time reality check, Hill et al.
112 Patient Experience Journal, Volume 5, Issue 2 – 2018 Perception
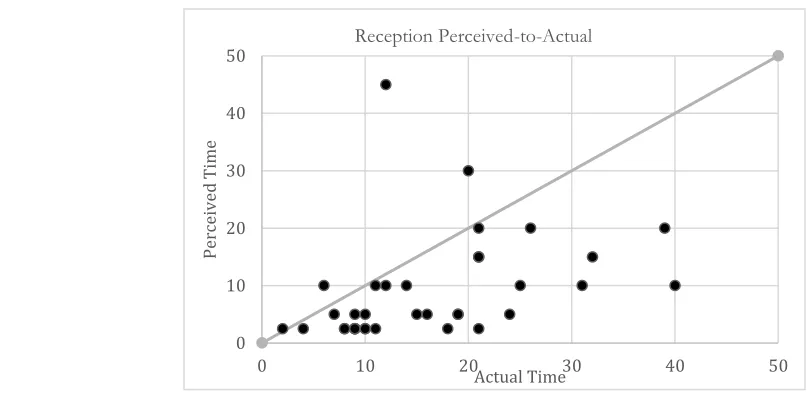
The patient/family responses to perception were highly variable. Initially, it was hypothesized that this was due to variations in the process – i.e., some patients take longer to complete the pre-surgical process than others and thus will perceive a longer pre-surgical time. In order to verify this, a scatterplot was used to graphically compare the actual time spent with the perceived time spent. Figure 2 depicts this graphical analysis, where each patient surveyed appears as a single dot on the graph.
If families perceive time exactly as the objective reality of the process occurred, all dots would fall along the diagonal. This is clearly not the case. Additionally, most dots fall below the line, indicating most families perceived less time than actually occurred; thus indicating a favorable bias. In order to quantify this bias, the actual time was subtracted from the perceived time to generate the
“Perceived-to-Actual” metric per family. See Table 4.
Process Capability
Finally, these insights were compiled into a metric to extrapolate how frequently patient’s expectations were
being met as a whole. The median threshold for a delay was used as the success criteria. Each patient encounter was then categorized as to whether their bias-adjusted cycle time met this threshold. The bias-adjusted cycle time
is equal to the cycle time measurement plus the P2A
metric for the site. Each site had different processes, patient expectations, and perceptions, which interacted to define the percentage of time expectations were being met at a particular site. See Table 5.
Interpreting Insights from the Framework to
Drive Improvements
The focus for improvement efforts should be driven by domain-specific contributions to the process capability percentage. For instance, if the process domain is drastically larger than expectation, opportunities exist in closing this gap either by improving the process or aligning the expectations. Our team met with surgical leaders in each area to discuss the analysis, impact of each domain and feasibility of improving with focused initiatives.
Process
When the cycle time measurement (objective reality) exceeds the internal metric (the time the site predicts the pre-surgical process to require) efforts should focus on process improvement. This was the case for Site B, whose total cycle time measurement was 2 hours 20 minutes – 20 minutes greater than the internal metric of 2 hours. Table 2: Process Measures for Multiple Hospital Surgical Sites
Number of
Patients (N) Reception Pre-Op Total Pre-Surgical Site A
Posted Day Surgeries
11/1/16-3/31/17 1850 28 min 83 min 2 hr. 1 min
Site B
Posted Day Surgeries
9/4/17-9/31/17 380 70 min 60 min 2 hr. 20 min
Site C
Posted Day Surgeries
9/4/17-9/22/17 120 15 min 78 min 1 hr. 35.5 min
Table 3: Expectation Measures for Multiple Hospital Surgical Sites
Number of
Patients (N) Reception Pre-Op Total Pre-Surgical
Site A 44 32.5 min 60 min 1 hr. 32.5 min
Site B 81 30 min 35 min 1 hr. 5 min
Wait time reality check, Hill et al.
Patient Experience Journal, Volume 5, Issue 2 – 2018 113
Negative numbers indicated a favorable response in which perceived time was less than process time.
Expectation
Expectations varied widely from family to family in both Reception and Pre-op. Even more notable, the thresholds for delay in Reception and Pre-op were inconsistent with internal process capabilities and patient education
provided to families prior to the day of surgery. At all sites, the median time families expected to spend in Reception and Pre-op was less than the actual process time, with expectations ranging from 50 minutes to 1 hour 32
minutes for the three sites. If the hospital’s internal
measure for success of 2 hours has been so far off from the families’ threshold for a delay, it is no wonder families
have been dissatisfied. Table 4: Perceived-to-Actual (P2A) Measures for Multiple Hospital Surgical Sites
Number of
Patients (N) Reception Pre-Op
Site A 44 -1 min -12 min
Site B 81 -25 min -12 min
Site C 81 -6.5 min -27 min
Figure 2: Site A Patient Perceptions Compared to Process Measures
0 10 20 30 40 50
0 10 20 30 40 50
Pe
rce
iv
ed
T
im
e
Actual Time Reception Perceived-to-Actual
Table 5: Process Capability Percentage across Texas Children’s Surgical Sites
Location % Meeting Expectations
Reception Pre-Op
Site A 57% 48%
Site B 36% 37%
Wait time reality check, Hill et al.
114 Patient Experience Journal, Volume 5, Issue 2 – 2018 Perception
When patients perceive less time than actually occurs (favorable perception) cycle times become conservative measures for how patients are actually perceiving time, and it becomes easier to meet their expectations. When perception is greater than the cycle time, there is an opportunity for improvement.
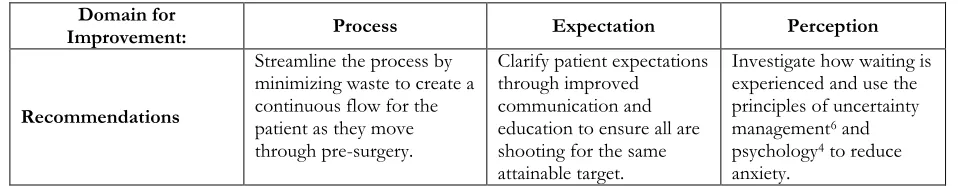
The recommendations in Table 6 were developed and presented to leaders when brainstorming improvement strategies.
For the purpose of this paper, we will discuss two improvement projects that were implemented to highlight how different strategies were used based on the domain with the most need for improvement.
Improvement Execution
Improvement Focus 1: Arrival Time Reduction
At Site B the process domain showed the greatest need for improvement, as the median time spent in reception was over one hour, which is well over the 30-minute threshold for delay.
A more targeted analysis was conducted per surgical subspecialty (pediatric urology, pediatric otolaryngology, pediatric surgery, etc.) to review timeliness of patient arrival, variation in cycle times, and surgery volume. Results indicated that the pre-surgical process for multiple specialties took far less time than the 2 hours families were told to arrive prior to surgery. Considering this
information, Pediatric Surgery conducted a 2-month pilot involving adjusting the instructions for patient arrival time from 2 hours to 1.5 hours prior to surgery.
Improvement Focus 2: Increased Child Life Presence
Site A targeted the perception domain, as surgical leaders felt a greater impact could be made to patient experience through this focus. Collaboratively with surgeons and nursing leaders, a guiding principle was developed to focus our perception improvement efforts:
“Improving patient perceptions is more than just
minimizing delays, it is a commitment to reducing patient & family anxiety and building empathy into
the surgical process.”
As basis for the improvement, a cognitive strategy was adopted to decrease anxiety and increase understanding regarding the surgical process. In this case, a dedicated perioperative certified child life specialist (CCLS) was piloted. Benefits of child life are well known and include anxiety reduction5, which is aligned with the Maister’s
assertion that “anxiety makes waits seem longer.4” Time spent with a CCLS in pre-op is also viewed as “occupied
time.4” This site did not have a dedicated CCLS for perioperative services. A CCLS was available only by request and depended upon availability. For this pilot, a CCLS was dedicated daily from 7am-noon, perioperative services busiest time, to provide evidence-based,
developmentally appropriate interventions. To quantify the impact, data was collected on the 3 domains (process, expectation, and perception) throughout the 3-week study period.
Results
Improvement Focus 1: Arrival Time Reduction
During the pilot, the median Reception and Pre-op cycle times decreased by 15 minutes and 10 minutes,
respectively. No downstream effects were identified, resulting in an endorsement for the adjusted arrival time to become the standard practice. All surgical specialties have transitioned to a 1.5 hours arrival time versus 2 hours. Currently, Site B has increased the overall patient satisfaction score by 4 points.
Improvement Focus 2: Increased Child Life Presence
Utilizing therapeutic play and hands-on education by a certified professional, trained in the developmental impact of illness and injury, positively impacted the experience of children and their families during the surgical process. Patients with a child life consult, on average, experienced 34 minutes less in reception and pre-op than what actually occurred. One mother of a 5-year-old had commented that
her daughter had been “really worried when we arrived to
Table 6: General Recommendations Based on Targeted Domain
Domain for
Improvement: Process Expectation Perception
Recommendations
Streamline the process by minimizing waste to create a continuous flow for the patient as they move through pre-surgery.
Clarify patient expectations through improved
communication and education to ensure all are shooting for the same attainable target.
Wait time reality check, Hill et al.
Patient Experience Journal, Volume 5, Issue 2 – 2018 115
the hospital.” During the pre-operative process, she and her daughter were able to meet with a child life specialist who helped provide facts about the sequence of events and sensory experiences of the procedure and process. In response to a post-operative survey, this same respondent
noted the patient “wishes her adenoids would grow back
so she can have them removed again.” Additionally, patient satisfaction scores for “wait time before
procedures” increased by 8.5 points when comparing pre
and post data.
Discussion
We believe building direct patient and family feedback into the framework to quantify their experience enabled this initiative to significantly impact patient experience, where others have fallen short. We also believe that the framework developed can be applied beyond patient satisfaction regarding waiting and delays. In fact, any patient encounter is driven by the three domains provided and can be enhanced through targeted analysis and improvement efforts. By assessing and addressing the domains of process, expectation, and perception our organization was able to make significant strides towards positively influencing the way our patients feel about their surgical experience. Instrumental in the success of the various initiatives was the concept of uncertainty management.6 Waiting can lead to patients sensing a loss of control which can magnify feelings of anxiety from which they may already be suffering.
Limitations
Through this project, we gained valuable insights into patient/family perspectives, though some limitations exist. One such limitation of current findings is that the deployment of this framework was restricted to the ambulatory surgery setting. Plans at the hospital are to expand this methodology when implementing improvement projects in other areas to determine its effectiveness across the system. Furthermore, we are confident that many of these principles and strategies would be applicable and relevant to any healthcare environment.
Conclusions
As information and control given to patients and families increased, the amount of wait time they perceived decreased resulting in a more positively perceived experience overall. Since anxiety makes wait times seem longer, we utilized strategies6 to help patients manage their uncertainty, reduce anxiety, and thus improve their
perceptions. Through our efforts, we’ve seen substantial
gains in this endeavor and we are determined to make even more strides when it comes to wait times for patients and their overall experience.
References
1. Compassionate Connected Care: A Model To Reduce Patient Suffering. Press Ganey Website.
http://www.pressganey.com/docs/default-
source/default-document-library/compassionate_connected_care.pdf Published January 19, 2015. Accessed January 6th 2018
2. Committee on Quality Health Care in America, Institute of Medicine. Crossing the quality chasm: a new health system for the 21st century. Washington, D.C.: National Academy Press; 2001
3. Ari AB, Peri T, Margalit D, et al. Surgical procedures and pediatric medical traumatic stress (PMTS) syndrome: assessment and future directions. J Pediatr Surg. 2017 Oct 16
www.sciencedirect.com/science/article/pii/S0022346 81730667X.
4. Maister D. The Psychology of Waiting Lines. DavidMaister.com.
http://davidmaister.com/articles/the-psychology-of-waiting-lines/. Published 1985. Accessed February 15, 2018.
5. Brown C, Chitkara MB. Policy statement: Child life services. Pediatrics. 2014;133(5), e1471-e1478. 6. Lubkin I. Uncertainty. In: Lubkin I. Chronic Illness: