ISSN: 2334-2986 (Print), 2334-2994 (Online) Copyright © The Author(s). All Rights Reserved. Published by American Research Institute for Policy Development DOI: 10.15640/jea.v4n2a7 URL: https://doi.org/10.15640/jea.v4n2a7
Effect of High Blockage Ratios on Surface Pressures of an Inclined Flat Plate
Kung-Ming Chung
1*& Yi-Jun Chen
2Abstract
The walls of the wind tunnel test section affect severely the flow characteristics around bluff bodies. In this study, the blockage effect was experimentally investigated in two lowspeed wind tunnels (23.029.7 m/s). An inclined flat plate, representing blockage ratio of 2.11%17.64%, was installed on the wind tunnel floor. The mean surface pressures on the upper and lower surfaces in a smooth flow were measured. Compared with the data in the lowblockage tunnel, the effect of the magnitude of blockage ratio on the separated flow over the inclined flat plate was more sustainable. A procedure developed from the dynamic pressure increment around the model was employed. It is observed that the effect of blockage ratio on sectional lift and drag coefficients on the centerline of an inclined flat plate can be corrected through the application of a conventional blockage formula.
Keywords: inclined flat plate; blockage effect; solar collector; wind tunnel
1. Introduction
Wind tunnels have been extensively used in testing bluff bodies, such as cars, bridges, and buildings. However, the presence of wind tunnel walls adds velocities to the flow field around a test model that are absent in an unlimited air flow and must be considered when interpreting force, moment, and pressure measurements (Hackett, 2003). The blockage ratio (BR = S/C) is the maximum projected cross-sectional area of the model (S) divided by the area of the tunnel test section (C) (Holmes, 2007).
Ota et al. (1994) indicated that the Strouhal number and force acting on bluff bodies in a confined flow were higher than those in an unbounded flow, because of increased vorticity in the separated shear layer. For a two-dimensional (2-D) rectangular cylinder in a smooth flow, the separated shear layer shifted closer to the wake centerline when the BR increased (Awbi, 1978). For axisymmetric cylinders, Saathoff and Melbourne (1987) demonstrated that an increase in the BR by 5% caused the mean pressure to increase in magnitude by 15% and the standard deviation and peak pressures to increase by 20%. Therefore, estimating the effect of wind tunnel blockage on the test data and correcting them accordingly is crucial.
Maskell (1965) examined the wind tunnel blockage effect on the drag coefficient (CD) of a finite-span flat plate, at the centerline of a closed wind tunnel, normal to wind (no ground influence). When the moment balance outside the wake is considered, the correction is associated with the dynamic pressure increment around the model, in which
1 Aerospace Science and Technology Research Center, National Cheng Kung University, Tainan, Taiwan.
Correspondence to: 2500 Section 1, Chung Cheng South Road, Guiren, Tainan, Taiwan, 711, ROC., Tel.: +88662392811x210; fax: +88662391915. E-mail address: [email protected] (K.-M. Chung)
q/q = CDBR (1)
CD/CDC = 1 + (CDBR) + O {BR2} (2)
Where q = qc - q is the effective increase in dynamic pressure of the undisturbed stream due to constraint.
CDC is the corrected drag coefficient on condition that the BR approached zero and is the blockage factor dependent on the magnitude of the base-pressure coefficient. The factor is shown to range between values slightly higher than 5/2 for an axisymmetric flow to those slightly lower than unity for a 2-D flow. If higher order terms are negligible, then CD/CDC varies linearly with CDBR. Furthermore, several additional correction equations have been
reported according to Maskell’s method for rectangular-section prisms (Awbi, 1978), 2-D rectangular cylinders (Laneville and Trepanier, 1996), passenger cars (Mecker, 1986), porous plates and truss girders (Takeda and Kato, 1992), cubes (Utsunomiya et al., 1993) and aircraft configurations (Kang et al., 2005), respectively.
For automotive testing, a model is typically placed on the wind tunnel floor. The pressure correction method was employed to investigate the influence of the boundaries of a wind tunnel test section. At a high BR value, the corrected and measured pressure coefficients (Cpc and Cpm) generally take the form
1.0– Cpc = f(1.0 – Cpm) (3)
Where f is a correction factor. According to the correlation of the base pressure for a series of rectangular bodies, Sykes (1973) proposed that f = 1.0 – mBR, where m (= 1.90) is an empirical constant. For a small coupe model (BR = 15%20%), Stafford (1981) suggested a value of m = 1.22 to be more appropriate. However, the global correction factor was not applicable in areas of high local curvature. Furthermore, Templin and Raimondo (1986) examined the blockage effect by using notch-back reference models (BR = 8.3%18.7%) and flat plates (BR = 1.6% and 20%). They proposed a new correction factor A (= f1/2). The analysis showed that a q correction that varied axially in the test section was appropriate for correcting the pressure coefficient.
Solar water heaters or photovoltaic systems, which are typically installed on the roofs of low-rise buildings, have been employed worldwide (Chang et al., 2011). Wind loads on inclined flat plates (or solar panels) have been reported (Wood et al., 2011; Kopp et al., 2002; Chung et al., 2008, 2011, 2013a, 2013b). In particular, shifting reattachment points were observed on the upper surface at different tilt angles, imposing a considerable challenge on any correction scheme. In the current study, the influence of a blockage effect on streamwise pressure profiles and aerodynamic characteristics was investigated by comparing data obtained in both large and small wind tunnels. The empirical constant m on q correction was evaluated.
2. Experimental setup
2.1 Wind tunnel and test models
For the test models, two flat plates (Model I: 60% scaled commercial solar collectors, 1.2 × 0.6 × 0.05 m; Model II: 40% scaled commercial solar collectors, 0.8 × 0.4 × 0.04 m) were fabricated. The typical aspect ratio of a solar collector in Taiwan is 0.5. The models were installed on a flat plate that was above the boundary layer of the wind tunnels. Model I was employed in both the ABRILWT (Case 1) and LSWT (Case 3). No correction is required when the BR is less than 3.5% (Holmes, 2007). Case 2 corresponded to the tests of Model II in the LSWT. As shown in Figure 1, the lower surface of the flat plate, in which the tilt angles α were 15°, 20°, 25° and 30°, faced the flow direction. The mean freestream velocity was 29.7 ± 0.5 and 23.0± 0.1 m/s in the LWST and ABRILWT, respectively. The Reynolds number independence for the present test configuration was observed by Chung et al. (2008). The blockage ratios (BR = 2.11%17.64%) for the entire test cases are listed in Table 1.
Table 1: Blockage ratio of test models
, deg Case 1- BR (%) Case 2- BR (%) Case 3-BR (%)
15 2.11 4.38 9.93
20 2.68 5.57 12.61
25 3.22 6.71 15.18
30 3.75 7.81 17.64
2.2 Measurement techniques
For Case 1, 50 pressure taps were distributed uniformly along the centerline of the upper and lower surfaces of the flat plate. Surface pressures were measured using Scanivalve multichannel modules (Model ZOC 33/64Px 64-port) equipped with differential pressure transducers (Model RAD3200). The full-scale range of sensors was ±2,490 Pa (or ±10 inch H2O), and the accuracy was ±0.15% for the full scale. The sampling rate used for all of the test cases was 256 Hz, and each record contained 40,960 data points. For Cases 2 and 3, 30 pressure taps were distributed along the centerline of the upper and lower surfaces for Models I and II. Pressure transducers (Validyne DP-103-26) were employed.
The sampling rate was 1,000 Hz, and each record contained 60,000 data points. The mean surface pressures were nondimensionalised with respect to the values of the static pressure, p∞, and q, of the incoming flow, in which Cpm = (p - p∞)/q. The sectional lift and drag coefficients (Cl and Cd) were evaluated by integrating the stream wise pressure distributions on the centerline. These generally take the forms
Cl = cosα[ ( − ) ] / (4)
Cd = -sinα[ ( − ) ]/q (5)
Figure 1: Experimental setup
3. Results and discussion
Examples of stream wise pressure distributions are shown in Figure 2. The front edge of the flat plate corresponded to x/L = 0, and the rear edge was located at x/L = 1. On the lower surface, there was a mild adverse pressure gradient near the front edge at α = 15°, and the level of positive pressure decreased within the one-third of the flat plate at α = 30°. The positive pressure then increased moderately close to the rear edge for all of the test cases. The data indicated a minor blockage effect on the flow under the inclined flat plate (attached flow region). On the upper surface, the mean surface pressure distributions revealed an initial expansion near the front edge (flow separation region) and recompression at farther downstream locations.
The level of Cp approached 0 at x/L 0.5 (BR = 2.119.93%). For a BR = 17.64%, the location of the maximal Cp moved upstream (x/L 0.4), indicating a short reattachment length and remarkably rapid recovery process. In addition, the wind-tunnel blockage effect led to an increase in local flow velocity. The level of Cp decreased as the BR increased, particularly at α = 30°. Furthermore, the differential pressure coefficient ΔCp (= (pu -
pl)/q) corresponded to wind loads on the inclined flat plate. Figure 3 shows examples of ΔCp distributions. The level of ΔCp gradually became more negative as the BR increased. For a BR = 17.64%, sufficiently high uplift force (or low ΔCp) acting on the inclined flat plate was observed, indicating that the blockage correction on the mean surface pressure for an inclined flat plate was definitely required at a BR of more than 10%.
(a)
x/c
Cp
-2 -1 0 1
2.11% 4.38% 9.93%
(b)
x/L
0.0 0.2 0.4 0.6 0.8 1.0
Cp
-2 -1 0 1
3.75% 7.81% 17.64% Solid symbols: upper surface
Hollow symbols: lower surface
BR
BR
C
p
-3 -2 -1 0
2.11 % 4.38 % 9.93 %
x/c
0.0 0.2 0.4 0.6 0.8 1.0
C
p
-3 -2 -1
3.75% 7.81% 17.64% (a)
(b)
BR
BR
Figure 3: Uncorrected stream wise differential pressure
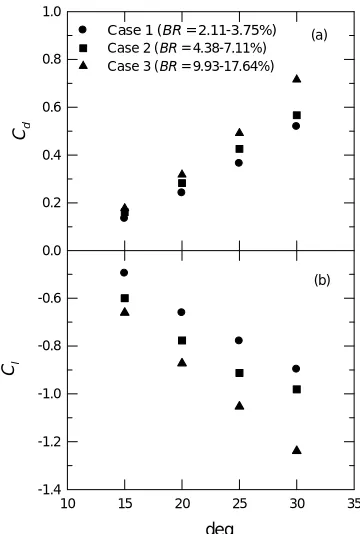
The data for the sectional lift and drag coefficients are shown in Figure 4. The value of Cd increased linearly as the value of increased. At a given , a high BR led to an increase in Cd. Figure 4b shows the variation of Cl with
deg
Cd
0.0 0.2 0.4 0.6 0.8 1.0
Case 1 (BR = 2.11-3.75%)
Case 2 (BR = 4.38-7.11%)
Case 3 (BR = 9.93-17.64%)
10 15 20 25 30 35
Cl
-1.4 -1.2 -1.0 -0.8 -0.6
(a)
(b)
Figure 4 Uncorrected Cd and Cl
3.2 Blockage effect
Templin and Raimondo (1986) demonstrated that the value of the correction factor A can be expressed as a reference pressure or q correction (qc/q = 1/A2). In the current study, A was deduced from the measured pressure distributions at a high BR (Cp,i, Cases 2 and 3, BR = 4.38%17.64%) compared with the pressure measured at a low
BR (Cpref,i, Case 1, BR = 2.11%3.75%). Linear regression was employed to minimise the expression
∑ 1− ,
.
− 1− ,
.
(6)
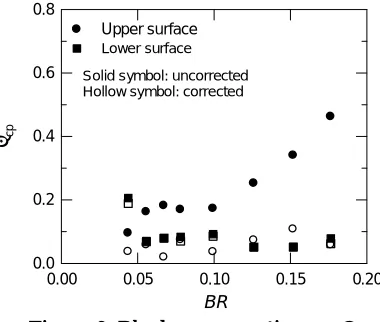
Figure 5 shows A as a function of the BR. At a high BR (> 10%), A decreased as the BR increased. A blockage effect was more evident on the upper surface than on the lower surface. In addition, A was higher than 1 for some test cases on the lower surface (or stagnation flow region), indicating a tendency toward over-correction. Furthermore, the goodnessoffit can be calculated using the deviation of the pressure coefficient , which is evaluated according to the corrected pressure coefficient Cpc,i and reference pressure coefficient Cpref,i.
= [ ∑ ( , − , ) ] / (7)
BR
0.00 0.05 0.10 0.15 0.20
A
0.85 0.90 0.95 1.00 1.05 1.10
Upper surface Lower surface
Figure 5: Blockage effect on correction factor A
BR
0.00 0.05 0.10 0.15 0.20
c
p
0.0 0.2 0.4 0.6 0.8
Upper surface
Lower surface
Solid symbol: uncorrected Hollow symbol: corrected
Figure 6: Blockage correction on Cp
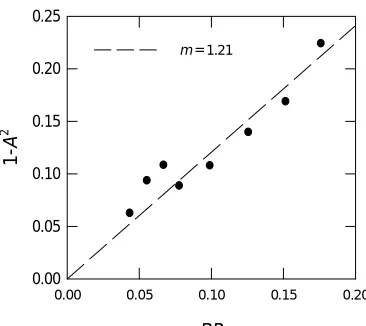
As previously mentioned, Sykes (1973) proposed an empirical constant m according to the correlation of the base pressure for a series of rectangular bodies, in which 1-A2 = mBR. Therefore, the data were re-plotted to estimate m, as shown in Figure 7. Although the data are slightly scattered, a value of m = 1.21 is consistent with the value suggested by Stafford (1981). Furthermore, the correction of dynamic pressure is shown in Figure 8. Because the BR < 7%, a value of m = 1.90 (rectangular bodies) was highly consistent with the present experiment. At a high BR, a satisfactory correction can be obtained using Stafford’s formula (a small coupe model), implying that the blockage correction depends on the test configuration and blockage ratio. The effect of shifting reattachment points on the upper surface at different tilt angles in the current study might be another concern.
BR
0.00 0.05 0.10 0.15 0.20
1
-A
2
0.00 0.05 0.10 0.15 0.20 0.25
m = 1.21
Figure 7: Empirical constant for the test case of an inclined flat plate
B
0.00 0.05 0.10 0.15 0.20
q/qc
1.0 1.2 1.4
1.6 present
Maskell m = 1.22 m = 1.90
Figure 8: Dynamic pressure correction
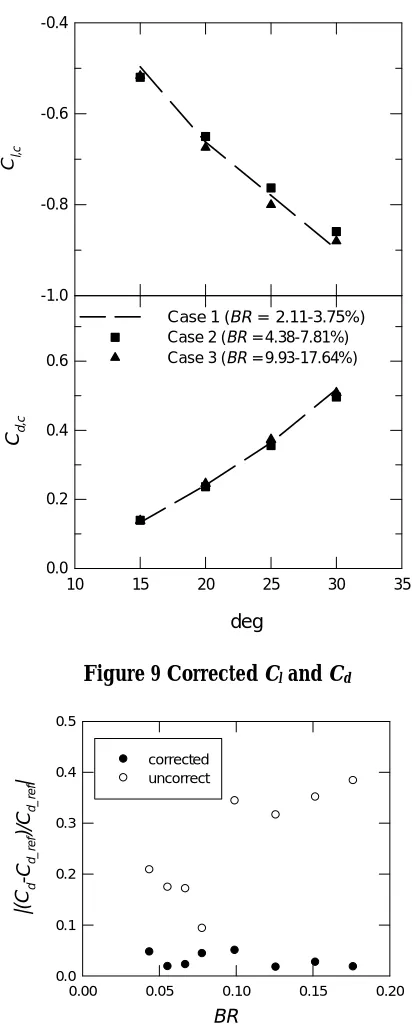
deg
Cl,c
-1.0 -0.8 -0.6 -0.4
Case 1 (BR = 2.11-3.75%)
Case 2 (BR = 4.38-7.81%) Case 3 (BR = 9.93-17.64%)
10 15 20 25 30 35
Cd
,c
0.0 0.2 0.4 0.6
Figure 9 Corrected Cl and Cd
BR
0.00 0.05 0.10 0.15 0.20
|(
C d
-C
d
_
re
f
)/C
d
_
re
f
|
0.0 0.1 0.2 0.3 0.4 0.5
corrected uncorrect
Figure 10 Blockage corrections on Cd
4. Conclusions
A blockage correction method was employed to correct the dynamic pressure. The value of the empirical constant was associated with the test configuration and blockage ratio.
In addition, a tendency toward over-correction was observed in the stagnation flow region. The deviation in the corrected sectional drag coefficient was less than 5% for all of the test cases. However, dynamic flow characteristics (e.g. shifting reattachment points, fluctuating pressures and force coefficients, and Strouhal number) may alter the blockage characterisation.
Nomenclature
L length of flat plate
Cl sectional lift coefficient
Cd sectional drag coefficient
Cp pressure coefficient, (p- p∞)/q
p mean surface pressure
q dynamic pressure
U wind speed
W width of flat plate
x stream wise distance from the leading edge of the flat plate α tilt angle of flat plate, in degree
ΔCp stream wise differential pressure coefficient, (pu - pl)/q
C cross-section area of wind tunnel
S projected area of test model
Subscript
low lower surface
up upper surface
∞ free stream
i pressure tap number
ref reference state
center centerline
c corrected value
uc uncorrected value
References
Awbi, H. B. (1978) ‘Wind-tunnel-wall constraint on two-dimensional rectangular- section prisms’, Journal of Industrial
Aerodynamics Vol. 3 No. 4, pp. 285-306.
Chang, K.C., Lin, W.M., Lee, T.S. and Chung, K.M. (2011) ‘Subsidy programs on diffusion of solar water heaters: Taiwan’s experience’, Energy Policy, Vol. 39 No. 2, pp. 563-567.
Chung, K.M., Chang, K.C., and Liu, Y.M. Liu. (2008) ‘Reduction of wind uplift of a solar collector model’, Journal of
Wind Engineering and Industrial Aerodynamics, Vol. 96 Issue 8-9, pp. 1294-1306.
Chung, K.M., Chang K.C., and Chou, C.C. (2011) ‘Wind loads on residential and large-scale solar collector models’,
Journal of Wind Engineering and Industrial Aerodynamics, Vol. 99 Issue 1, pp. 59-64.
Chung, K.M., Chang, K.C., Chen, C.K., and Chou, C.C. (2013a) ‘Guide plate on wind uplift of a solar collector’,
Wind and Structure, Vol. 16 Issue 2, pp. 213-224.
Chung, K.M., Chou, C.C., Chang, K.C., and Chen, Y.J. (2013b) ‘Wind loads on a residential solar water heater’,
Journal of the Chinese Institute of Engineers, Vol. 36 Issue 7, pp. 870-877.
Hackett, J.E. (2003) ‘Recent developments in the calculation of low-speed solid-wall wind tunnel wall interference in tests on large models part 1: evaluation of three interference assessment methods’, Progress in Aerospace
Holmes, J.D. (2007) Wind Loading of Structures. 2nd edition, Taylor & Francis, New York, USA, pp. 168-169.
Kang, S.H., Ahn, S.K., and Kwon, O.J. (2005) ‘New blockage-correction method for separated flows in a subsonic wind tunnel’, Journal of Aircraft, Vol. 42 No. 5, pp. 1352-1355.
Kopp, G.A., Surry, D. and Chen, K. (2002) ‘Wind loads on a solar array’, Wind and structures, Vol. 5 Issue 5, pp. 393– 406.
Laneville, A. and Trepanier, J.Y. (1986) ‘Blockage effects in smooth and turbulent flows: the case of two-dimensional rectangular cylinders’, Journal of Wind Engineering and Industrial Aerodynamics, Vol. 22 Issue 2-3, pp. 169-176.
Maskell, E.C. (1965) A theory of the blockage effects on bluff bodies and stalled wing in a closed wind tunnel, A.R.C.R. & M. 3400. Mercker, E. (1986) ‘A blockage correction for automotive testing in a wind tunnel with closed test section’, Journal of
Wind Engineering and Industrial Aerodynamics, Vol. 22 Issue 2-3, pp. 149-167.
Ota, T., Okamoto, Y. and Yoshikawa, H. (1994) ‘A correction formula for wall Effects on unsteady forces of two-dimensional bluff bodies’, Journal of Fluids Engineering, Vol. 116 No. 3, pp. 414-418.
Saathoff, P.J. and Melbourne, W.H. (1987) ‘Freestream turbulence and wind tunnel blockage effects on streamwise surface pressures’, Journal of Wind Engineering and Industrial Aerodynamics, Vol. 26 Issue 3, pp. 353-370.
Stafford, L.G. (1981) ‘A streamline wind-tunnel working section for testing at high blockage ratios’, Journal of Wind
Engineering and Industrial Aerodynamics, Vol. 9 Issue 1-2, pp. 23-31.
Sykes, D.M. (1973) ‘Advances in road vehicle aerodynamics’, edited by H.S. Stephens, Fluid Engineering, British Hydrodynamic Research Association, pp. 311-321.
Takeda, K. and Kato, M. (1992) ‘Wind tunnel blockage effects on drag coefficient and wind-induced vibration’,
Journal of Wind Engineering and Industrial Aerodynamics, Vol. 42 Issue 1-3, pp. 897-908.
Templin, J.T. and Raimondo, S. (1986) ‘Experimental evaluation of test section boundary interference effects in road vehicle tests in wind tunnels’, Journal of Wind Engineering and Industrial Aerodynamics, Vol. 22 Issue 2-3, pp. 129-148.
Utsunomiya, H., Nagao, F. Ueno, Y. and Noda, M. (1993) ‘Basic study of blockage effects on bluff bodies’, Journal of
Wind Engineering and Industrial Aerodynamics, Vol. 49 Issue 1-3, pp. 247-256.