International Journal of Epidemiologic Re
search
© 2019 The Author(s); Published by Shahrekord University of Medical Sciences. This is an open-access article distributed under the terms of the Creative Commons Attribution License (http://creativecommons.org/licenses/by/4.0), which permits unrestricted use, distribution, and
2019 Spring;6(2):76-82 doi:10.15171/ijer.2019.14
Race, Education Attainment, and Happiness in the United
States
Shervin Assari1,2,3*ID
1Department of Psychiatry, University of Michigan, Ann Arbor, MI 48109, USA
2Center for Research on Ethnicity, Culture, and Health, School of Public Health, University of Michigan, Ann Arbor, MI 48109, USA
3Department of Psychology, University of California Los Angeles (UCLA), Los Angeles, CA 90095, USA
http://ijer.skums.ac.ir
Original Article
Abstract
Background and aims: As suggests by the Minorities’ Diminished Returns (MDR) theory, education attainment and other socioeconomic status (SES) indicators have a smaller impact on the health and well-being of non-White than White Americans. To test whether MDR also applies to happiness, in the present study, Blacks and Whites were compared in terms of the effect of education attainment on the level of happiness among American adults.
Methods: General Social Survey (1972-2016) is a series of national surveys that are performed in the United States. The current analysis included 54 785 adults (46 724 Whites and 8061 Blacks). The years of schooling (i.e., education attainment) and happiness were the main independent variable and the main dependent variable of interest, respectively. In addition, other parameters such as gender, age, employment status, marital status, and the year of the survey were the covariates and race was the focal effect modifier. Finally, the logistic regression model was used to analyze the data.
Results: Based on the results, high education attainment was associated with higher odds of happiness in the pooled sample. Further, a significant interaction was found between race and education attainment on the odds of happiness, showing a larger gain for Whites compared to Blacks. Race-specific models also confirmed this finding (i.e., a larger magnitude of the effect of education for Whites compared to Blacks).
Conclusion: Overall, the MDR theory also applies to the effect of education attainment on happiness. Blacks’ disadvantage in comparison to the Whites in gaining happiness from their education may be due to the structural, institutional, and interpersonal racism and discrimination in the US. Therefore, there is a need for economic and public policies that can minimize the Blacks’ diminished returns of education attainment and other SES resources.
Keywords: Blacks, Whites, Race, Ethnicity, Class, Socioeconomic status, Happiness
Received: 12 Dec. 2018 Accepted: 4 May 2019 ePublished: 21 June 2019 *Corresponding Author:
Shervin Assari, Tel: +1-734-363-2678, Email: assari@umich.edu
Introduction
Happiness (i.e., the feelings of joy and pleasure, as well as a positive emotion, is considered a major human experience. Research shows a close link between socioeconomic status (SES) and happiness/positive emotions1 and positive
emotions are essential regardless of age, gender, race, and ethnicity.2 Emotions such as happiness protect individuals
against depression, which is generally regarded as one of the most chronic debilitating illnesses worldwide and in the United States, in particular.3 Happiness and positive
emotions are under the influence of SES, particularly education attainment4,5 while being essential for
maintaining a sense of well-being2 and self-esteem.6 Affect
correlates with SES. In other words, low SES individuals are less happy1,3 while individuals with higher SES report
more positive affect.7,8
According to the Minorities’ Diminished Returns (MDR) theory,9,10 the effects of SES indicators on a variety
of positive outcomes are systemically smaller for racial and ethnic minority groups including the Blacks compared to Whites.11 Empirical evidence suggests that education
has smaller effects on different factors such as income,12-14
alcohol drinking,15 cigarette smoking,16 eating habits,17
chronic medical disease,18 obesity,19 self-rated health,20-22
and mortality23-26 for Blacks compared to Whites.
However, it is not well understood if there is any relative disadvantage of Blacks compared to Whites regarding the link between high SES and happiness.27
MDR is attributed to economic14 and psychological28
and economic processes negatively affect the Blacks’ mental health, even that of those who have successfully climbed the social ladder (high SES). At each level of SES, the U.S. society favors Whites to non-Whites and thus treats the Blacks and the other minorities unfavorably, therefore, high SES Blacks fail to gain as many positive outcomes as they deserve due to their SES. In addition, Blacks have worse access to the opportunity structure, and education does not generate the same income and employment for the Blacks compared to Whites. Everyday lives of high-SES Blacks are also different from those of their high-high-SES White counterparts since high SES Blacks experience more not less28 prejudice and discrimination.29-31 It is argued
that racism operates across the levels and institutions that are bound to the tangible health gains that follow SES for Blacks.29,32,33
However, a large body of literature on MDR is related to negative rather than positive outcomes, showing that high SES better protects the Whites than the Blacks against depression and depressive symptoms.18,34-36 For example,
some reports showed the increased risk of depression,18
anxiety,37 and suicide34 among high SES Blacks. Further,
in studies with nationally representative samples, high education36 and income35 were associated with the high
risk of major depressive disorder35,36 and depressive
symptoms18 for youth35 and adults.18,36 These results are
replicated in cross-sectional35,36 and longitudinal18 studies,
which are the extreme cases of MDR where SES not only shows no a positive effect but also correlates with poor outcomes.1
Objectives
The main aim of this investigation was to compare Black and White American adults for the effect of education attainment on their happiness. In line with previous studies38 and informed by the MDR theory,9,10 high
education attainment is expected to result in greater achievement for Whites than Blacks.
Methods
Design and Setting
Using a cross-sectional survey design, this analysis used data from the General Social Survey (GSS; 1972-2016). Since 1972, the University of Chicago has conducted the GSS in order to monitor the societal change and social trends of American society over time.
General Social Survey
The GSS has gathered data on contemporary American society over more than four decades and monitored the trends regarding the attitudes, behaviors, and beliefs of the Americans. The GSS helps us understand how the structure and function of the U.S. society are generally changing and in terms of race, class, and gender, in particular. The data further provide an excellent opportunity to run time series
and compare the U.S. subgroups, and finally, to compare the United States with its peer industrial countries. Over the past decades, GSS has become a unique source of scholarly works in the fields of sociology, economics, policy-making, and demography, among others. GSS collects data on major social issues such as race relations, the quality of life, and trust in U.S. institutions as well.39
Analytical Sample
The current study included 54 785 adults who were either Whites (n = 46 724) or Blacks (n = 8061).
Study Measures
Study variables included race, age, gender, education attainment, employment status, marital status, the year of survey, and happiness.
Education Attainment. This variable was measured as the years of schooling, varying from 0 to 22. Moreover, it was treated as an interval measure. In other words, a higher score reflected higher education attainment/the years of schooling.
Happiness. It was measured using a single item that measured general happiness and read as “Taken all together, how would you say things are these days – would you say that you are very happy, pretty happy, or not too happy?” The response options included (1) Very happy, (2) Pretty happy, and (3) Not too happy. The item was asked from 1972 to 2010.
Demographic Variables. Gender, age (years), employment status, marital status, and the year of the survey were the study covariates. Age was an interval variable which was measured in years and gender was a dichotomous measure [males =0 (reference group) and females =1].
Study Year. The year of study was operationalized as an interval variable ranging from 1972 to 2016.
Socioeconomic Status. Two SES covariates, namely, employment and marital status were included in this study. Employment was measured as an ordinal variable and contained eight categories as “(1) Working Full-time, (2) Working Part-time, (3) Temporarily Not Working, (4) Unemployed, Laid Off, (5) Retired, (6) School, (7) Keeping House, and (8) Other”. Working Full-time was considered as the reference group. Additionally, marital Status was assessed as a nominal variable and encompassed five categories including (1) Married, (2) Widowed, (3) Divorced, (4) Separated, and (5) Never Married”. The first option was the reference category.
Race. The self-identified race was the focal moderating variable that was treated as a dichotomous variable (i.e., non-Hispanic Whites =0 [the reference group] and Blacks =1).
Statistical Analysis
reported to describe the participants, overall, and by race. In addition, four logistic regressions were used including two models in the pooled sample (Model 1 and Model 2) and two models specific to the racial groups (Model 3 and Model 4). In all models, happiness (1= being very happy/pretty happy and 0= not too happy) and education attainment (the years of education) were the primary outcome (dependent variable) and the primary predictor (independent variable), respectively, and age, gender, employment status, marital status, the year of survey were the covariates. Model 1 only had the main effects while Model 2 included the race by education attainment interaction term. Finally, Model 3 and Model 4 estimated the effects of education attainment on happiness in Whites and Blacks, respectively. The odds ratio (OR), SE, 95% confidence interval (CI), z-value, and P values were reported based on the obtained data.
Results
Descriptive Statistics
This study included 54 785 adults who were either White (n = 46 724) or Black (n = 8061). Blacks were less happy compared to Whites who had higher education attainment.
Pooled Sample Multivariable Models
Table 1 shows the results of the two logistic regression models, both in the overall sample. Based on Model 1 that included no interaction term, high education attainment was associated with higher odds of happiness independent of race, age, gender, employment status, marital status, and the year of the survey. Conversely, Model 2 demonstrated an interaction between race and education attainment on happiness, suggesting a smaller effect of education on happiness for Blacks compared to Whites.
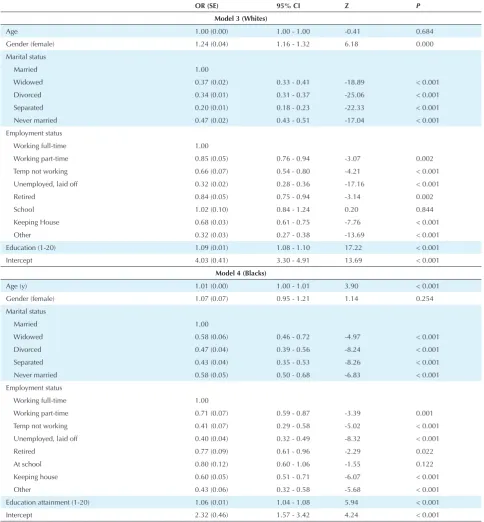
Race-Specific Multivariable Models
The results of the two logistic regression models, each in one race, are presented in Table 2. Model 3 and Model 4, performed in Whites and Blacks, respectively, revealed that high education attainment was related to the higher odds of happiness regardless of age, gender, and the year of the survey for both groups. However, the magnitude of the association was larger for Whites compared to Blacks.
Discussion
The results of the current study indicated that high education attainment increased happiness overall, however, this effect was disproportionately larger for Whites compared to Blacks. Based on the results, the MDR theory could apply to happiness.
Supporting the MDR theory,9,10,19 we found smaller
effects of education attainment on happiness among the Blacks than Whites. An extensive body of research has shown similar patterns for the effects of SES on other economic and health outcomes.24,29,34,40-44 An increase
in education attainment leads to an increase in income, but the boosting effect of education on income is not comparable between Whites and Blacks.12,13 As a result,
highly educated Blacks experience higher obesity, poor sleep, physical inactivity,15 depression,18 suicide,34 and
mortality24 compared to highly educated Whites. Similar
results are found for individuals43 and families, that is, the
transgenerational effects.44-47
Most traditional theories that connect SES to the outcomes focused on the universal effects of SES resources. Link and Phelan’s (1995) Fundamental Cause Theory suggests that SES is a fundamental determinant and the root cause of positive outcomes, including the affect, emotions, and mental health.48 The same theory
conceptualizes racism as a fundamental cause as well.45
Despite the emphasis of the mainstream literature on the gains of SES, there is substantial evidence suggesting that high SES may operate as a risk factor for poor mental health outcomes for the Blacks.11,18,19,32,34,43,44 What makes
MDR distinct from the other theories is that it focuses on group differences in gains instead of the universal effects.9,10
The MDR theory does not argue that racial and ethnic groups are inherently different in their abilities to turn their education attainment to tangible positive outcomes. In our point of view, such interpretation should be avoided since it is considered racist. Therefore, we need to fix the unfair social system that has historically oppressed Blacks instead of blaming the victims. In addition, Blacks gain less from their education, not because of their culture, morality, or traits, but the fact that their lives have been and are still affected by systemic racism. Slavery is over, but racism continues.47
Limitations and Strengths
Our study had several limitations. One main weakness of this study was the unbalanced sample size of the Blacks and Whites although this is usually the case in health disparities research. Further, we only focused on the effect modification of race while neglecting other potential moderating factors such as gender, ethnicity, and nativity. Accordingly, it is very important to compare the diminished returns for Black men and women, as some literature has shown SES as a risk factor for Black men but not Black women.20,35 SES may differently influence the
emotion and affect among the Black males and females. Furthermore, the present study used a cross-sectional design and longitudinal studies should be conducted in this regard as well. Moreover, our study failed to control several potential confounders such as wealth and childhood SES. Despite the above-mentioned limitations, this study contributes to the MDR literature10,19 by showing that
Table 1. A Summary of the Pooled Sample Logistic Regression Models
OR (SE) 95% CI Z P
Model 1 (Main Effect Model)
Race (Black) 0.63 (0.02) 0.59 - 0.67 -13.99 < 0.001
Age 1.00 (0.00) 1.00 - 1.00 1.55 0.122
Gender (female) 1.19 (0.04) 1.12 - 1.27 5.87 < 0.001
Marital status
Married 1.00
Widowed 0.40 (0.02) 0.36 - 0.43 -19.52 < 0.001
Divorced 0.35 (0.01) 0.33 - 0.38 -26.54 < 0.001
Separated 0.26 (0.02) 0.23 - 0.29 -23.12 < 0.001
Never married 0.47 (0.02) 0.44 - 0.51 -19.51 < 0.001
Employment status
Working full-time 1.00
Working part-time 0.82 (0.04) 0.75 - 0.90 -4.13 < 0.001
Temp not working 0.59 (0.05) 0.50 -0.70 -6.05 < 0.001
Unemployed, laid off 0.34 (0.02) 0.30 - 0.38 -18.91 < 0.001
Retired 0.82 (0.04) 0.74 - 0.90 -4.03 < 0.001
School 0.95 (0.08) 0.81 - 1.11 -0.67 0.501
Keeping House 0.66 (0.03) 0.60 - 0.71 -9.84 < 0.001
Other 0.35 (0.03) 0.30 - 0.40 -14.54 < 0.001
Education (1-20) 1.08 (0.00) 1.07 - 1.09 17.66 < 0.001
Intercept 4.16 (0.38) 3.49 - 4.97 15.77 < 0.001
Model 2 (Interaction Model)
Race (Black) 1.15 (0.14) 0.91 - 1.45 1.15 0.251
Age (y) 1.00 (0.00) 1.00 - 1.00 1.42 0.155
Gender (female) 1.20 (0.04) 1.13 - 1.27 6.04 < 0.001
Marital status
Married 1.00
Widowed 0.40 (0.02) 0.36 - 0.43 -19.55 < 0.001
Divorced 0.35 (0.01) 0.33 - 0.38 -26.43 < 0.001
Separated 0.26 (0.02) 0.23 - 0.29 -23.27 < 0.001
Never married 0.47 (0.02) 0.44 - 0.51 -19.45 < 0.001
Employment status
Working full-time 1.00
Working part-time 0.82 (0.04) 0.74 - 0.90 -4.23 < 0.001
Temp not working 0.59 (0.05) 0.50 - 0.70 -6.13 < 0.001
Unemployed, laid off 0.34 (0.02) 0.30 - 0.38 -18.90 < 0.001
Retired 0.82 (0.04) 0.74 - 0.90 -4.08 < 0.001
At school 0.94 (0.08) 0.80 - 1.11 -0.73 0.468
Keeping house 0.66 (0.03) 0.60 - 0.71 -9.85 < 0.001
Other 0.35 (0.03) 0.30 - 0.40 -14.56 < 0.001
Education attainment (1-20) 1.10 (0.01) 1.08 - 1.11 18.11 < 0.001
Education attainment (1-20) × race (Black) 0.95 (0.01) 0.93 - 0.97 -5.25 < 0.001
Intercept 3.59 (0.34) 2.98 - 4.32 13.53 < 0.001
Future Research
All variables of the study were limited to the individual level, however, community-level factors may also have a role in this respect. Therefore, neighborhood and community factors should also be investigated in future studies. Additionally, some contextual factors such as neighborhood and workplace racial composition are needed to be included in similar research. Similarly,
Implications for Policy and Practice
True equality is impossible unless we establish a context in which the very same SES indicators can generate the very equal returns across the racial groups. In the current system, equal education consistently results in unequal gains for the Black than White Americans. As a result, solutions should target racism across the levels and institutions. Such policies should go beyond merely equalizing the racial groups in terms of SESbut eliminate the processes that cause inequality in translating the SES into the outcomes. Therefore, there is a need to eliminate the additional societal barriers in the lives of Blacks and
other racial and ethnic minority groups. In the absence of such policies, the majority group continues gaining more positive outcomes from the available resources.
Conclusions
The magnitude of the link between education attainment and happiness is unequal across the racial groups, indicating that Blacks gain less happiness than Whites from their increase in education attainment.
Ethical Approval
The GSS study protocol was approved by the University
Table 2. A Summary of Ethnic-Specific Logistic Regression Models
OR (SE) 95% CI Z P
Model 3 (Whites)
Age 1.00 (0.00) 1.00 - 1.00 -0.41 0.684
Gender (female) 1.24 (0.04) 1.16 - 1.32 6.18 0.000
Marital status
Married 1.00
Widowed 0.37 (0.02) 0.33 - 0.41 -18.89 < 0.001
Divorced 0.34 (0.01) 0.31 - 0.37 -25.06 < 0.001
Separated 0.20 (0.01) 0.18 - 0.23 -22.33 < 0.001
Never married 0.47 (0.02) 0.43 - 0.51 -17.04 < 0.001
Employment status
Working full-time 1.00
Working part-time 0.85 (0.05) 0.76 - 0.94 -3.07 0.002
Temp not working 0.66 (0.07) 0.54 - 0.80 -4.21 < 0.001
Unemployed, laid off 0.32 (0.02) 0.28 - 0.36 -17.16 < 0.001
Retired 0.84 (0.05) 0.75 - 0.94 -3.14 0.002
School 1.02 (0.10) 0.84 - 1.24 0.20 0.844
Keeping House 0.68 (0.03) 0.61 - 0.75 -7.76 < 0.001
Other 0.32 (0.03) 0.27 - 0.38 -13.69 < 0.001
Education (1-20) 1.09 (0.01) 1.08 - 1.10 17.22 < 0.001
Intercept 4.03 (0.41) 3.30 - 4.91 13.69 < 0.001
Model 4 (Blacks)
Age (y) 1.01 (0.00) 1.00 - 1.01 3.90 < 0.001
Gender (female) 1.07 (0.07) 0.95 - 1.21 1.14 0.254
Marital status
Married 1.00
Widowed 0.58 (0.06) 0.46 - 0.72 -4.97 < 0.001
Divorced 0.47 (0.04) 0.39 - 0.56 -8.24 < 0.001
Separated 0.43 (0.04) 0.35 - 0.53 -8.26 < 0.001
Never married 0.58 (0.05) 0.50 - 0.68 -6.83 < 0.001
Employment status
Working full-time 1.00
Working part-time 0.71 (0.07) 0.59 - 0.87 -3.39 0.001
Temp not working 0.41 (0.07) 0.29 - 0.58 -5.02 < 0.001
Unemployed, laid off 0.40 (0.04) 0.32 - 0.49 -8.32 < 0.001
Retired 0.77 (0.09) 0.61 - 0.96 -2.29 0.022
At school 0.80 (0.12) 0.60 - 1.06 -1.55 0.122
Keeping house 0.60 (0.05) 0.51 - 0.71 -6.07 < 0.001
Other 0.43 (0.06) 0.32 - 0.58 -5.68 < 0.001
Education attainment (1-20) 1.06 (0.01) 1.04 - 1.08 5.94 < 0.001
of Chicago Institutional Review Board (IRB) and all GSS participants provided informed consent. Furthermore, the study was funded by the National Science Foundation.
Conflict of Interest Disclosures
The author declares that he has no conflict of interest.
Acknowledgment
Shervin Assari was partly supported by the National Institute on Minority Health and Health Disparities (4P60MD006923-05; PI = Vickie Mays), the National Institute of Child Health and Human Development (D084526-03), the National Cancer Institute (CA201415 02; Co-PI = Ritesh Mistry), and the National Institute on Drug Abuse (DA035811-05; PI = Marc Zimmerman). Special thanks go to Hamid Helmi, Wayne State University, for his help in editing the final draft of this paper. The General Social Survey was performed by the University of Chicago and funded by the National Science Foundation.
References
1. Adler NE, Boyce T, Chesney MA, Cohen S, Folkman S, Kahn RL, et al. Socioeconomic status and health. The challenge of the gradient. Am Psychol. 1994;49(1):15-24. doi: 10.1037/0003-066X.49.1.15.
2. Fredrickson BL, Joiner T. Positive emotions trigger upward spirals toward emotional well-being. Psychol Sci. 2002;13(2):172-5. doi: 10.1111/1467-9280.00431. 3. Pratt LA, Brody DJ. Depression in the United States household
population, 2005-2006. NCHS Data Brief No. 7. Atlanta, GA, USA: Centers for Disease Control and Prevention; 2008. 4. Cunado J, de Gracia FP. Does education affect happiness?
Evidence for Spain. Soc Indic Res. 2012;108(1):185-96. doi: 10.1007/s11205-011-9874-x.
5. Chen WC. How education enhances happiness: Comparison of mediating factors in four East Asian countries. Soc Indic Res. 2012;106(1):117-31. doi: 10.1007/s11205-011-9798-5. 6. Sato K, Yuki M. The association between self-esteem and happiness differs in relationally mobile vs. stable interpersonal contexts. Front Psychol. 2014;5:1113. doi: 10.3389/ fpsyg.2014.01113.
7. Jakoby N. Socioeconomic status differences in negative emotions. Sociol Res Online. 2016;21(2):1-10. doi: 10.5153/ sro.3895.
8. Holahan CJ, Moos RH. Life stressors, personal and social resources, and depression: a 4-year structural model. J Abnorm Psychol. 1991;100(1):31-8. doi: 10.1037/0021-843X.100.1.31.
9. Assari S. Unequal gain of equal resources across racial groups. Int J Health Policy Manag. 2017;7(1):1-9. doi: 10.15171/ ijhpm.2017.90.
10. Assari S. Health disparities due to diminished return among black Americans: Public policy solutions. Soc Issues Policy Rev. 2018;12(1):112-45. doi: 10.1111/sipr.12042.
11. Fuller-Rowell TE, Curtis DS, Doan SN, Coe CL. Racial disparities in the health benefits of educational attainment: a study of inflammatory trajectories among African American and white adults. Psychosom Med. 2015;77(1):33-40. doi: 10.1097/psy.0000000000000128.
12. Assari S. Parental education better helps white than black families escape poverty: National survey of children’s health. Economies. 2018;6(2):30. doi: 10.3390/economies6020030.
13. Assari S. Diminished economic return of socioeconomic status for black families. Soc Sci. 2018;7(5):74. doi: 10.3390/ socsci7050074.
14. Assari S, Mistry R. Educational Attainment and smoking status in a national sample of American adults; evidence for the blacks’ diminished return. Int J Environ Res Public Health. 2018;15(4). doi: 10.3390/ijerph15040763.
15. Assari S, Moghani Lankarani M. Educational attainment promotes fruit and vegetable intake for whites but not blacks. J 2018;1(1):29-41. doi: 10.3390/j1010005.
16. Assari S. Combined racial and gender differences in the long-term predictive role of education on depressive symptoms and chronic medical conditions. J Racial Ethn Health Disparities. 2017;4(3):385-96. doi: 10.1007/s40615-016-0239-7. 17. Assari S, Thomas A, Caldwell CH, Mincy RB. Blacks’ diminished
health return of family structure and socioeconomic status; 15 years of follow-up of a national urban sample of youth. J Urban Health. 2018;95(1):21-35. doi: 10.1007/s11524-017-0217-3.
18. Assari S, Caldwell CH, Mincy RB. Maternal educational attainment at birth promotes future self-rated health of White but not Black youth: a 15-year cohort of a national sample. J Clin Med. 2018;7(5). doi: 10.3390/jcm7050093.
19. Assari S. Socioeconomic status and self-rated oral health; diminished return among hispanic whites. Dent J (Basel). 2018;6(2). doi: 10.3390/dj6020011.
20. Assari S, Lapeyrouse LM, Neighbors HW. Income and self-rated mental health: Diminished returns for high income black Americans. Behav Sci (Basel). 2018;8(5). doi: 10.3390/ bs8050050.
21. Hayward MD, Hummer RA, Sasson I. Trends and group differences in the association between educational attainment and U.S. adult mortality: implications for understanding education’s causal influence. Soc Sci Med. 2015;127:8-18. doi: 10.1016/j.socscimed.2014.11.024.
22. Assari S, Lankarani MM. Race and urbanity alter the protective effect of education but not income on mortality. Front Public Health. 2016;4:100. doi: 10.3389/fpubh.2016.00100. 23. Backlund E, Sorlie PD, Johnson NJ. A comparison of the
relationships of education and income with mortality: the National Longitudinal Mortality Study. Soc Sci Med. 1999;49(10):1373-84.
24. Everett BG, Rehkopf DH, Rogers RG. The nonlinear relationship between education and mortality: An examination of cohort, race/ethnic, and gender differences. Popul Res Policy Rev. 2013;32(6). doi: 10.1007/s11113-013-9299-0.
25. Williams DR, Sternthal M. Understanding racial-ethnic disparities in health: sociological contributions. J Health Soc Behav. 2010;51 Suppl:S15-27. doi: 1 0 . 1 1 7 7 / 0 0 2 2 1 4 6 5 1 0 3 8 3 8 3 8 .
26. Assari S, Lankarani MM, Caldwell CH. Does Discrimination Explain High Risk of Depression among High-Income African American Men? Behav Sci (Basel). 2018;8(4). doi: 10.3390/ bs8040040.
27. Assari S, Nikahd A, Malekahmadi MR, Lankarani MM, Zamanian H. Race by gender group differences in the protective effects of socioeconomic factors against sustained health problems across five domains. J Racial Ethn Health Disparities. 2016. doi: 10.1007/s40615-016-0291-3. 28. Ross CE, Mirowsky J. Refining the association between
education and health: the effects of quantity, credential, and selectivity. Demography. 1999;36(4):445-60.
How to cite the article: Assari S. Race, education attainment, and happiness in the United States. Int J Epidemiol Res. 2019;6(2):76-82. doi: 10.15171/ijer.2019.13.
Yang J, Jackson JS. Are benefits conferred with greater socioeconomic position undermined by racial discrimination among African American men? J Mens Health. 2012;9(2):127-36. doi: 10.1016/j.jomh.2012.03.006.
31. Hudson DL. Race, Socioeconomic Position and Depression: The Mental Health Costs of Upward Mobility. Ann Arbor, MI, USA: University of Michigan; 2009.
32. Assari S. Ethnic and gender differences in additive effects of socio-economics, psychiatric disorders, and subjective religiosity on suicidal ideation among blacks. Int J Prev Med. 2015;6:53. doi: 10.4103/2008-7802.158913.
33. Assari S, Caldwell CH. High risk of depression in high-income African American boys. J Racial Ethn Health Disparities. 2018;5(4):808-19. doi: 10.1007/s40615-017-0426-1. 34. Assari S. Social Determinants of depression: The intersections
of race, gender, and socioeconomic status. Brain Sci. 2017;7(12). doi: 10.3390/brainsci7120156.
35. Assari S, Caldwell CH, Zimmerman MA. Family structure and subsequent anxiety symptoms; Minorities’ Diminished Return. Brain Sci. 2018;8(6). doi: 10.3390/brainsci8060097.
36. Assari S, Preiser B, Kelly M. Education and income predict future emotional well-being of Whites but not Blacks: A ten-year cohort. Brain Sci. 2018;8(7). doi: 10.3390/ brainsci8070122.
37. Ferraro KF, Kelley-Moore JA. Self-rated health and mortality among black and white adults: examining the dynamic evaluation thesis. J Gerontol B Psychol Sci Soc Sci. 2001;56(4):S195-205. doi: 10.1093/geronb/56.4.s195. 38. Assari S. High income protects whites but not African
Americans against risk of depression. Healthcare (Basel). 2018;6(2). doi: 10.3390/healthcare6020037.
39. Assari S. The link between mental health and obesity: role of individual and contextual factors. Int J Prev Med. 2014;5(3):247-9.
40. Assari S, Preiser B, Lankarani MM, Caldwell CH. Subjective socioeconomic status moderates the association between discrimination and depression in African American Youth. Brain Sci. 2018;8(4). doi: 10.3390/brainsci8040071. 41. Assari S. Life expectancy gain due to employment status
depends on race, gender, education, and their intersections. J Racial Ethn Health Disparities. 2018;5(2):375-86. doi: 10.1007/s40615-017-0381-x.
42. Assari S, Caldwell CH, Mincy R. Family socioeconomic status at birth and youth impulsivity at age 15; Blacks’ diminished return. Children (Basel). 2018;5(5). doi: 10.3390/ children5050058.
43. Phelan JC, Link BG, Tehranifar P. Social conditions as fundamental causes of health inequalities: theory, evidence, and policy implications. J Health Soc Behav. 2010;51 Suppl:S28-40. doi: 10.1177/0022146510383498. 44. Link BG, Phelan JC. Social conditions as fundamental causes
of health inequalities. In Handbook of medical sociology. Upper Saddle River, NJ, USA: Prentice Hall; 2010:3-17. 45. Phelan JC, Link BG. Is racism a fundamental cause of
inequalities in health? Annu Rev Sociol. 2015;41:311-30. doi: 10.1146/annurev-soc-073014-112305.
46. Hudson DL, Neighbors HW, Geronimus AT, Jackson JS. Racial discrimination, John Henryism, and depression among African Americans. J Black Psychol. 2016;42(3):221-43. doi: 10.1177/0095798414567757.
47. Bailey ZD, Krieger N, Agenor M, Graves J, Linos N, Bassett MT. Structural racism and health inequities in the USA: evidence and interventions. Lancet. 2017;389(10077):1453-63. doi: 10.1016/s0140-6736(17)30569-x.