GIS based hydro-biological parameter approach for
identification of productive zones in Nanak Sagar Reservoir
of Uttarakhand, India
Ingole N.A.
1*; Nain A.S.
2; Rathod R.H.
3; Posti R.
1; Chalal R.
1Received: April 2017 Accepted:June 2017
1-Directorate of Coldwater Fisheries Research, (ICAR), Bhimtal- 263136, Uttarakhand, India
2-G.B. Pant University of Agriculture & Technology, Pantnagar– 263145, Uttarakhand, India
3-College of Fishery Science, MAFSU, Nagpur, Maharashtra, India
Corresponding author’s E-mail: [email protected]
Keywords: Hydro-biological parameters, Productive zones, Reservoir fisheries, GIS model
Introduction
Reservoirs constitute the single largest inland fishery resource, both in terms of size and productive potential. The productivity of a reservoir depends on various factors such as the available water area, water quality, availability of planktonic food, stocking rate, methods of exploitation of the stock and the type of management of the fishery (Vass and Sugunan, 2009). A desirable level of productivity can be achieved in this man-made ecosystem only by a proper control of the above-mentioned factors on scientific lines. Geographical Information System (GIS) and Remote Sensing and mapping technologies can be used in selecting sites for culture and capture fisheries (Kapetsky, 1987). The maps can provide a long-term outline to the planners for aquaculture
development (Kapetsky, 1989). The integration of multi-criteria evaluations (MCE) within a GIS context could help users to improve decision making processes (Hossain et al., 2009). Nanak Sagar Reservoir is the larger one having a production potential of 200 kg/ha/year with the present average fish production of 120.23 Kg-1 ha-1 year in the year 2014-15 (Ingole, 2016). A Bengali tribal community has been living around the reservoir and their socio-economic status depends on the fishery in this reservoir. Traditional types of fishing have been carried out which result in low catch after applying huge fishing efforts, which ultimately leads to less production and fishing cost. In the past two decades, identification of productive zones based on hydrological and biological parameters for pen and
cage culture expanded rapidly which may be due to the decline in the availability of land-based resources for fish culture and an increasing consciousness of their advantages over traditional pond culture. Also, they provide greater socio-economic opportunities to low-income families in the rural areas because they require comparatively low capital outlay and use simple technology (Baluyut, 1989; Chen et al., 2007; Das et al., 2009). Yields from pen and cage culture are high, with or without supplemental feeding depending on the natural productivity of the water body. The GIS approach for identification of productive zones was aimed to decrease fishing costs and increase the socio-economical status of people living around the reservoir.
Material and methods Study area
The prospective reservoirs of the Tarai region for fisheries development are Naitaal, Tumaria, Haripura, Baur, Baigul, Dhaura, Nanak Sagar, and Sarda Sagar, which are located at 28º 25'-29º 55' N latitude and 78º 18'-79 º 55' E longitude (Ingole et al., 2015a). The Nanak Sagar Reservoir was created by constructing an earth dam of 19.20 km length across the River Deoha and situated (28 º 57' 20" N, 79 º 50' 34" E) in Udham Singh Nagar district of Uttarakhand.
Sample collection
For this study 250 mL water samples were taken monthly from twenty permanent sampling stations (9:00 a.m.
onward in day) in the reservoir using Global Positioning System GARMIN (ORGEON 550) receiver in a different zone. For the present investigation the reservoir was divided into three zones viz. riverine, transitional and lacustrine. These zones were divided on the basis of horizontal mixing patterns of water in the reservoir. The riverine zone of the reservoir located towards the river mouth was comparatively shallower and exhibited minimal wave action. The riverine sector is the portion where the feeder river joins with the main reservoir. It has rapid inflow during monsoon and least inflow during the pre-monsoon periods. The transitional or intermediate zone was constituted between the riverine and lacustrine zones. The lacustrine zone was demarcated towards the dam site. It is compatibly deeper than the other two zones and has maximum wave action. The quantitative study (No./liter) of phytoplankton and zooplankton (biological parameters) was carried out in Haemocytometer and “Sedgewick-Rafter cell”, respectively adopting the procedure outlined by Welch (1948), Stephens and Gillespie (1976) and Sharma(2000).
Fourteen hydrological parameters such as water temperature (digital thermometer, HM Digital, Inc.), pH using digital pH meter (HI 98107), Total Dissolved Solid (TDS) using digital TDS (HM Digital, Inc.), water transparency (standard Secchi disc), conductivity (conductivity meter HI98303), Dissolved Oxygen (DO) determined by Winkler’s titrimetric method, and free Carbon dioxide (CO2)
estimated by standard titrimetric method using phenolphthalein as an indicator etc. were determined. These parameters were estimated on the sampling sites whereas the rest of water quality parameters such as turbidity, total alkalinity, total hardness and chloride were tested in the laboratory according to standard titration methods (Welch, 1948; APHA, AWWA and WPCF, 2005) and nitrate, phosphate and silicate were estimated with the help of UV-VIS Spectrophotometer (Varian).
Thematic maps
Resource maps were prepared based on the ground data and satellite data. A procedure was set up using Arc-GIS v.10.1 (The Environmental System Research Institute, USA) for each attribute of annual distribution of plankton, water and soil characteristic of reservoir and is divided into four categories such as high, moderate, poor and least or not productive (FAO, 1993) on the basis of requirements for Maximum Sustainable Yield (MSY).
Criteria for assessment
After categorization, all the thematic layers were integrated with one another in GIS using the weighted overlay method and thereafter the potential productive areas were explored. The multi-criteria evaluations (MCE) is another concept and model that aids in assessment by expression in terms of weights, values or intensities of preferences, which ultimately lead to a better decision making.
Nayak et al. (2014) used this method for site selection of aquaculture development in the mid/high Himalayan region of Uttarakhand. At this stage, limnologist preferences with respect to the evaluation criteria were incorporated into the decision model. The preferences were typically defied as a value assigned to an evaluation criterion that indicates its importance relative to other criteria under consideration. Criteria were rated according to literature reviews and expert opinions based on their relative importance of parameters. The results for 23 criteria were presented separately in two main parameters, namely productivity level (Model-1) and soil quality (Model-2).
The phytoplankton registered highest importance (0.16), followed by zooplankton (0.13) for productivity level in reservoirs because phytoplankton is a primary producer and zooplankton is a primary consumer in the aquatic food web. The water temperature registered highest importance (0.11) for water quality suitability map in the humid subtropical region as compared to other parameters like dissolved oxygen (0.10), Alkalinity, carbon dioxide (0.10 each) and pH (0.07) and which was found to be of moderate importance. Hardness (0.06) as well as phosphate, nitrate (0.05 each), conductivity, and silicate (0.02 each) had moderately less importance. The turbidity (0.01), transparency (0.009) as well as TDS (0.007) and chloride (0.004) had lesser importance for productivity as indicated in model-1. Similarly for soil quality
model, the soil pH (0.26), soil nitrogen (0.22) and soil phosphate (0.21) have the most importance. The organic carbon (0.20) and texture (clay, 0.05; silt, 0.04; sand, 0.02) were also important as indicated in model-2.
Depending on the weightage obtained from each parameter the suitability maps for productivity level of water and soil were prepared by adding all the criteria using the model-1 & model-2, respectively.
Model-1 Productivity Level of water =
Grid Phytopl×0.16 + Grid Zoopl×0.13 + Grid Temp× 0.11+ Grid DO× 0.10 + Grid Alkal×0.10 + Grid CO2×0.10 + Grid pH×
0.07+GridHardness× 0.06 + Grid Nitrate× 0.05 +Grid Phosphate× 0.05 + Grid Condu× 0.02+ Grid silicate× 0.02+GridTurbi× 0.01 + Grid Transp× 0.009 + GridTDS×0.007+ Grid Chloride× 0.004
Model-2 Productivity of Soil=
Grid soil pH× 0.26+ Grid S.Nitrogen× 0.22 + Grid S.Phosphate× 0.21+ Grid Org cor× 0.20+ Grid Clay× 0.05+ Grid silt× 0.04+ Grid Sand× 0.02
Overall, the Entire Productivity Level (EPL) model made from two sub models (Model-1 & Model-2) having weightage, productivity level is found
to impart a major role (72%) compared to soil quality (28%) for productivity zones demarcation in selected reservoirs (Model-3).
Results and discussion
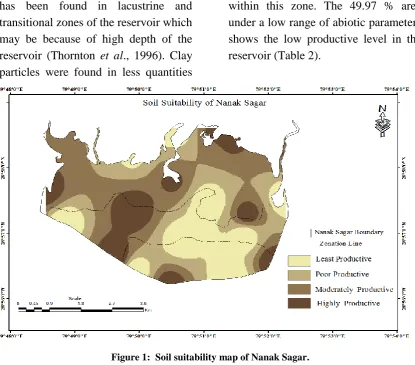
Most productive areas are found near the peripheral areas beside the rivers and shallow regions of the reservoir where soils and topography are suitable with abundant nutrients. Based on selected model-2 an area of soil suitability, 443.03 hectares (ha) (23.67%) falls in the least productive, 492.72 ha (26.90%) under the poor productive, 641.32 ha (34.27%) area under moderately productive and 295.01 hectare (15.76%) of area was found to be a high productive zone as shown in the Table 1 and Fig. 1. The maximum high productive area has been found in riverine and transitional zones of the reservoir which might be because of high deposition of silt and
clay particles (siltation) within this zone (Ingole et al., 2015b). The high range of abiotic parameters of soil such as, pH >7.5; available P (mg 100g-1) >6.0; available N (mg 100g-1) > 60 and organic carbon (%) 1.5-2.5 show high productive levels in reservoir (Sugunan, 2010). Thus according to the range of the abiotic parameters, 15.76 % area is under highly productive in Nanak Sagar Reservoir. The maximum moderately productive area has been found in the riverine zone which might be due to early deposition of silt and sand soil in this zone. 34.27 % area is under a medium range of the abiotic parameters, and shows the moderately productive level in the reservoir (Table 2). The least and poor productive area
Model-3 Entire Productivity Level (EPL) = Grid Productivity L× 0.72 + Grid Soil suitability× 0.28
has been found in lacustrine and transitional zones of the reservoir which may be because of high depth of the reservoir (Thornton et al., 1996). Clay particles were found in less quantities
within this zone. The 49.97 % area under a low range of abiotic parameters shows the low productive level in the reservoir (Table 2).
Figure 1: Soil suitability map of Nanak Sagar.
Table 1: Area of productive zones of reservoir.
Productive level
Nanak Sagar
Entire productive area Soil suitability area
ha % ha %
Least productive 115.44 6.17 443.03 23.67
Poor productive 703.65 37.59 492.22 26.30
Moderately productive 765.52 40.90 641.32 34.27
Highly productive 287.10 15.34 295.01 15.76
Total 1871.70 100 1871.58 100
Table 2: Range of abiotic variables in reservoirs (Sugunan, 2010)
Parameters Overall range Productivity
Low Medium High
A. Water
pH 6.5-9.2 <6.0 6.0-8.5 >8.5
Alkalinity (mg L-1) 40-240 <40.0 40-90 >90.0
Nitrates (mg L-1) Tr.- 0.93 Negligible Up to 0.2 0.2-0.5
Phosphates (mg L-1) Tr.- 0.36 Negligible Up to 0.1 0.1-0.2
Specific conductivity (µmhos)
76-474 Up to 200 >200
Temperature (ºC) 12.0-31.0 18 18-22 >22
(with minimal stratification : i.e., >5ºC)
Table 2 continued:
B. Soil
pH 6.0-8.8 <6.5 6.5-7.5 >7.5
Available P (mg/100g) 0.47-6.2 <3.0 3.0-6.0 >6.0 Available N (mg/100g) 13.0-65.0 <25.0 25-60 >60.0
Organic carbon (%) 0.6-3.2 <0.5 0.5-1.5 1.5-2.5
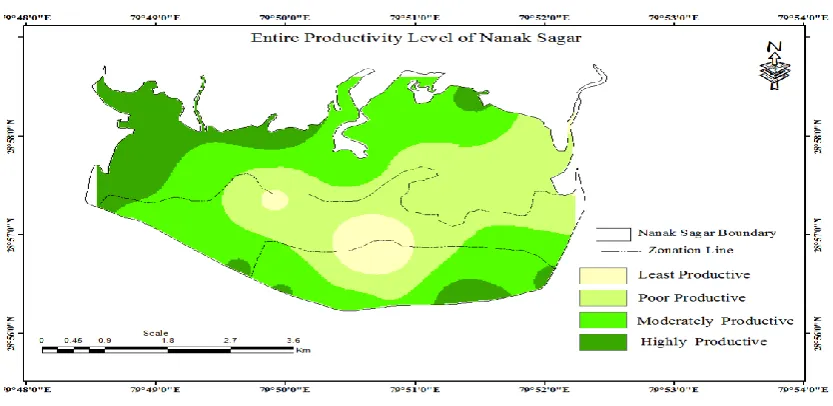
Based on selected model-3 an area of entire productivity level, 115.44 (6.17%) ha falls in the least productive, 703.65 ha (37.59%) under the poor productive, 765.52 ha (40.90%) area
under moderately productive and 287.10 ha (15.34%) of area is found to be a high productive zone as shown in Table 1 and Fig. 2.
Figure 2: Entire productivity level of Nanak Sagar on basis of (Plankton, WQP and SQP).
The maximum area of high productive has been found in the riverine zone of the reservoir and is because of the shallow water, high nutrient soil, more aquatic submerged vegetation and irregular shoreline. The moderately productive area has been found in riverine, lacustrine and some part in transitional zones due to optimum quantities of plankton biomass, good quality of water as well as morphometric factors (basically area, mean depth, irregularity of shoreline) having a significant bearing on productivity. The poor productive area
covered some parts of riverine, transitional and lacustrine zones of the reservoir which might be because of low nutrient soil that comes from catchment area through the second river as well as low vegetation and high mean depth (Thornton et al., 1996). The least productive areas were found more in lacustrine and slightly in transitional zones of the reservoir because of the deepest point of the reservoir having a depth more than 8 m.
According to the Sugunan (2010) range of abiotic parameters of water shows the productivity level in Indian
reservoirs (Table 2). Thus it can be concluded that 6.17 %, 37.59%, 40.90% and 15.34% area are under least, poor, moderately and high range of the abiotic parameter, respectively in Nanak Sagar Reservoir. This reservoir has been under the medium category (1000-5000 ha). Based on the productivity index, survey and model, the production potential was calculated as 196.42 kg ha-1 in the Nanak Sagar Reservoir and it is under the medium productive category.
The present study will help in optimum utilization of Nanak Sagar with respect to fisheries resources and to identify different productive zones for rational utilization. The integrated study helps design a suitable site for culture based on capture fisheries and management plan for auto-recruitment of fishes within a reservoir. Moreover, Nanak Sagar Reservoir may act as a model for the other reservoirs for enhancement of fish production using a high stocking cultural system like cage and pen culture.
Acknowledgement
The authors are thankful to the Dean, College of Fisheries and Director, Directorate of Coldwater Fisheries Research, Bhimtal for providing the necessary facilities to carry out the present study. The financial assistance in terms of fellowship was offered by G.B. Pant University of Agri. & Tech., Pantnagar, India, is also greatly acknowledged.
References
APHA, AWWA and WPCF 2005. Standard methods for examination of water and waste water, 21st Edition, American Public Health Association, New York.
Baluyut, E.A., 1989. Aquaculture systems and practices: a selected review. Fisheries and Aquaculture Department, Rome, FAO.
Chen, J., Guang, C., Xu, H., Chen, Z., Xu, P., Yan, X., Wang, Y. and Liu, J., 2007. A review of cage and pen aquaculture; China. In M. Halwart, D. Soto and J.R. Arthur (eds). Cage Aquaculture–Regional reviews and Global Overview, pp. 50–68. FAO Fisheries Technical Paper. No. 498. Rome, FAO.
Das, A.K., Vass K.K., Shrivastava N.P. and Katiha P.K., 2009. Cage culture in reservoirs in India. (A Handbook). World Fish Center Technical Manual No. 1948. The World Fish Center, Penang, Malaysia. 24P.
FAO, 1993. Guidelines for land use planning. FAO Development Series
1. Food and Agriculture
Organization of the United Nations, Rome, Italy.
Hossain, M.S., Chowdhury, S.R., Das N.G., Sharifuzzaman, S.M. and Sultana, A., 2009. Integration of GIS and multicriteria decision analysis for urban aquaculture development in Bangladesh. Landscape Urban Plan, 90(3-4), 119-133.
Ingole, N.A., 2016. Assessment of fisheries potential using geo-spatial technique in selected reservoir of
Tarai region of Uttarakhand, PhD thesis, G.B. Pant University of Agri & Tech., Pantnagar.
Ingole, N.A., Ram R.N. and Kumar
P., 2015a. Assessment of
sedimentation in Nanak Sagar Reservoir of Uttarakhand, India: Using remote sensing technique. Journal of Environmental Bio-Sciences, 29(1), 17-21.
Ingole, N.A., Ram R.N., Ranjan R. and Shankhwar A.K., 2015b. Advance application of geospatial technology for fisheries perspective in Tarai region of Himalayan state of Uttarakhand. Sustain. Water Resource Management, 1, 181–187.
Kapetsky, J.M., 1987. Satellite remote sensing to locate and inventory small water bodies for fisheries management and aquaculture development in Zimbabwe. Rome, Italy: FAO. CIFA Occasional Paper. 14, 11P.
Kapetsky, J.M., 1989. A geographical information systems for aquaculture development in Johor-state, Malaysia: FI: TCP/MAL/6754, Rome, Italy. Nayak, A.K., Pant D., Kumar, P.,
Mahanta, P.C. and Pandey, N.N., 2014. GIS-based aquaculture site suitability study using multi-criteria evaluation approach. Indian Journal Fish, 61, 108-112.
Sharma, A.P., 2000. Chemical
characteristics of water (Chap-4): Manual fishery limnology, G.B. Pant University of Agri. & Tech., Pantnagar. 40P.
Stephens, D.W. and Gillespie, D.M., 1976. Phytoplankton production in the great salt lake Utah and a laboratory study of algal response to enrichment.
Limnology and Oceanography. 21, 74-85.
Sugunan, V.V., 2010. Ecology and fisheries management of reservoirs in India, CAFT Programme on Fisheries Resource Management, 22-March-11 April 2010, CIFE, Mumbai. pp. 53-65. Thornton, J., Steel, A. and Rast, W.,
1996. Reservoirs (Chap-8) water quality assessments. A guide to use of biota, sediments and water in environmental monitoring. Second Edition by Deborah Chapman.
Vass, V.V. and Sugunan, K.K., 2009. Status of reservoir fisheries in India. Status of Reservoir Fisheries in Five Asian, Countries. NACA, Thailand. pp.31-54.
Welch, P.S., 1948. Limnological methods. McGraw Hill book Company. Inc. New York. 381P.