Vol. 10, No. 3, 2018 Article ID IJIM-01107, 10 pages Research Article
Matrix Approach to Robustness Analysis for Strategy Selection
A. Sorourkhah ∗, S. Babaie-Kafaki †‡, A. Azar §, M. Shafiei–Nikabadi ¶ Received Date: 2017-08-06 Revised Date: 2017-11-16 Accepted Date: 2018-05-18
————————————————————————————————–
Abstract
This study aims to discuss the use of robustness analysis in evaluation and selection the strategies of an organization based on a matrix approach. The proposed technique can overcome the weakness of the robustness analysis model related to reviewing a few future scenarios and also, makes it possible to in a short time include the ideas of the decision makers who participate in the strategic planning process. In order to more precisely compare the strategies, especially when their robustness levels are so close and consequently, it is hard to choose the best one, a version of the well–known Dolan–Mor´e performance profile is employed. To support the theoretical discussions, the proposed approach is applied on a real world problem in the automotive industry of Iran and the results are explained as well.
Keywords : Soft operational research; Strategic programming; Robustness analysis; Matrix data; Performance profile.
—————————————————————————————————–
1
Introduction
I
na complex process due to the large num-practice, decision making turns out to be ber of alternatives, multiple and sometimes con-flicting goals, increasing environmental turbu-lence as well as unavailability of thequantita-∗Department of Industrial Management, Faculty of Management and Economics, Semnan University, Semnan, Iran.
†Corresponding author. [email protected], Tel: +98(23)31533216.
‡Department of Mathematics, Faculty of Mathematics, Statistics and Computer Science, Semnan University, Sem-nan, Iran.
§Department of Industrial and System Management, Faculty of Management and Economics, Tarbiat Modares University, Tehran, Iran.
¶Department of Industrial Management, Faculty of Management and Economics, Semnan University, Semnan, Iran.
tive data on the future results [19]. This
pro-cess could be so challenging, especially when it is related to the strategic areas, due to high lev-els of uncertainty about the future, considering multiple strategic options, cross–linking strate-gic options, long–term results arising from im-plementation of the strategies, and needing to use the stakeholders’ opinions in discussions
re-lated to the strategic decisions [13]. In the
past decades, researches focused on improving the classical strategy analysis and selection tools such as SWOT (strengths, weaknesses, oppor-tunities and threats) and QSPM (quantitative strategic planning matrix) to provide reasonable answers for the mentioned challenges. However, their achievements generally have two fundamen-tal failures: (1) inability to formulate probable futures and estimate how and to what extent they can affect the organizational performances
in the terms of tools, and (2) indetermination of the importance and rank of the criteria identified in the strategic planning process. Responding to the mentioned criticisms led the strategic plan-ning experts to employ the operational research (OR) methods in order to conduct a proper anal-ysis to manage the complex situation
surround-ing the strategic structures [8]. In this context,
researchers applied the multiple–criteria decision making (MCDM) techniques and also, the prob-lem structuring methods (PSM) to manage the
mentioned complexity [7, 12, 18, 19]. The main
advantage of these tools is their ability of us-ing both of the quantitative and qualitative cri-teria. However, these methods fail to formulate the probable futures since they use the present in-formation and judgments to collect the data and make predictions in the cases where the future information is required. Now, if we reasonably assume that the future is unpredictable, forecast–
based planning won’t be reliable anymore [10] and
since most of the strategic issues are character-ized by the uncertainty quality, it will be tricky
to even use the probabilistic estimates [17].
As known, PSMs have been developed since the late 70’s in response to the limitations and obsta-cles ahead of the researchers in using the hard OR
[1]. Although being helpful for creating an
ap-propriate strategic plan that requires managing
large and complicated qualitative data [8], PSMs
can only dominate the complexity of the problem and fail to formulate probable futures through the model. Among all the PSMs, only the strategic choice approach (SCA) and the robustness analy-sis (RA) are associated with the uncertainty. It is worth noting that RA is simpler and easier than the SCA to understand for the managers and
par-ticipants [14]. Therefore, it seems that RA is a
more suitable tool for the strategy evaluation as well as the strategy selection in contrast to the other methods.
RA is an approach to assess the primary se-quential strategic decisions in the sense that ro-bustness and debility of a choice in the future alternatives is examined to make a decision that could provide acceptable and satisfactory results among more futures and simultaneously follows
by fewer adverse outcomes [2]. According to the
study of Montibeller and Franco [13], the
impor-tant point in this type of analysis is that there is no consensus on how to calculate the robust-ness scores [2,5,6,11,14, 20,21]. However, the Rosenhead’s metric is one of the most widely used
methods in RA [16].
Despite the acceptable ability to formulate the probable futures and manage the complexities, RA has some weaknesses. Among them, inability to analyze a large number of scenarios as well as inability to determine more desirable strategies in the specific case of closeness of the robustness and debility levels are of the most important points. Regarding to the first weakness of RA, Ram et
al. [15] believed that most of the scenarios used
to evaluate strategic options can be introduced as optimistic, pessimistic and most–likely
scenar-ios. Mansson [11] argued that only four scenarios
can be essentially used because of the human ca-pacity limitations. In the meantime, we should not forget that soft OR was originally proposed in response to the hard OR weaknesses such as inability to deal with the problem complexities. So, instead of lessening the scenarios, it is better to formulate the problem in a way to cover the environmental complexities.
Here, employing a matrix–based scheme that allows us to define and analyze an arbitrary num-ber of scenarios, we plan to improve effectiveness of the RA. Our approach is explained in details in the second section of this study. The third
section describes how to use the Dolan–Mor´e [4]
performance profile as a tool of the RA. In the fourth section, the proposed technique is imple-mented on a real world problem and the results are reported. The final section is devoted to the conclusions.
2
A matrix–based model for
the strategy selection
prob-lem
Here, we describe a matrix–based model to be used in the RA of the strategic programming. To start the formulation process, firstly we need to identify the strategies. In this context, the main strategies M Si,i= 1,· · ·, r, are specified as a re-sult of choosing a certain number of predefined
the dependence relationships are illustrated as follows:
M Si=Sj1 ⊕Sj2 ⊕ · · · ⊕Sji, i= 1,· · ·, r, (2.1)
showing that the main strategy M Si is a
hy-bridization of the sub–strategies Sj1, Sj2,· · ·, Sji. The second step is to define the future scenarios. As known, common external factors in the strate-gic literature include the political, economic, so-cial, technological, environmental and legal
fac-tors (PESTEL) [9]. Here, the scenarios are
de-fined based on probable situations of the
men-tioned six factors as ordered in the 6–tuplesSni =
(Pi, Eci, Soi, Ti, Eni, Li), i= 1,2,· · ·, q. General form of a scenario components is presented in
Table 1. Furthermore, the scenarios matrix M
which is of the order 6×q can be defined by
set-ting the 6–tuples Sni as its ith column. More
precisely,
M = [Sn1, Sn2,· · ·, Snq]. (2.2)
Now, we need to determine strategies favorabil-ity and non–favorabilfavorabil-ity conditions. In this
con-text, for the strategySj two ordered 6–tuplesSj+
and Sj−are defined to respectively refer to its
fa-vorability and non–fafa-vorability conditions. The elements of the two vectors contain some of the
states of the indicators displayed in Table 1,
de-termined according to the employer’s considera-tions. Afterwards, the strategic condition matrix
A of the order 6×2m can be defined as follows:
A= [S1+, S1−, S2+, S2−,· · ·, Sm+, Sm−]. (2.3)
Here, based on the available data, we are in a position to define the robustness–debility
ma-trix which is denoted byB, consisting of mrows
and q columns where each row corresponds to a
sub–strategy Sj, j = 1,· · ·, m, and each column
corresponds to a scenario Sni, i = 1,· · ·, q. In
order to specify the element (j, i) of B, the
or-dered 6–tuple Sni should be compared with the
ordered 6–tuples Sj+ and Sj−. For each
compli-ance of Sni and Sj+ a positive score is assigned
while for each compliance of Sni and Sj− a
neg-ative score is considered; the element Bji of the
matrixB is the sum of the mentioned scores. In
particular, according to the classical Rosenhead’s
approach [17], two m–tuple vectors R and F are
defined to respectively contain robustness and
de-bility of the sub–strategies. The jth component
of R (i.e. Rj) represents the ratio of the number
of positive elements of thejth row ofBtoq(total
number of the elements of the jth row) and the
jth component ofF (i.e. Fj) refers to the ratio of
the number of negative elements of the jth row
of B toq.
Finally, for each main strategy M Si, the
ro-bustness level is defined as the sum of the
el-ements of R corresponding to the related sub–
strategies and also, the debility level is given by
summing the elements ofF corresponding to the
related sub–strategies. The best main strategy is determined by comparing the obtained robust-ness and debility levels. In the case where the robustness and debility levels are close to each other which makes it hard to ascertain the right strategy, here the performance profile introduced
by Dolan and Mor´e [4] is appropriately employed.
3
Developing the Dolan–Mor´
e
performance profile to
deter-mine the preferable strategy
As known, Dolan–Mor´e performance profile [4]
is widely and increasingly used to compare per-formance of the numerical algorithms with re-spect to the CPU time, the number of iterations, the number of function evaluations, and so on. Benchmark results are usually generated by
run-ning a solver on a set P of the problems and
recording information of the interest. Here, we deal with the notion of performance profile as a means to evaluate and compare the performance
of the set of solvers S on a test set P. Then, we
develop it as a tool to compare robustness of the strategies.
We assume that we have ns solvers and np
problems. We are interested in using the CPU time as a performance measure; although the ideas below can be used with other measures. For
each problem pand solver s, we define
tp,s=computing time required to solve problem
p by solvers.
We require a baseline for comparisons. We
compare the performance on problempby solver
Table 1: General form of the scenario components
Factors Indicators Situations
Political Pi i= 1,2,· · ·, p
Economic Eci i= 1,2,· · ·, c
Social Soi i= 1,2,· · ·, s
Technological Ti i= 1,2,· · ·, t
Environmental Eni i= 1,2,· · ·, n
Legal Li i= 1,2,· · ·, l
Table 2: Factors affecting the problem and their different states
Factors Indicators Situation
Political Joint Comprehensive Plan of Continuation of JCPOA (P1)
Action (JCPOA) Rejection of JCPOA (P2)
Economic Economic growth Positive (Ec1)
Negative (Ec2)
Improvement (So1)
Social The potential of market size Stability (So2)
Decline (So3)
Maintaining technology over the period under review (T1)
Technological Technology development Changing the technology to the
benefit of the organization (T2)
Changing the technology to the detriment of the organization (T3)
Environmental Community’s sensitivity to Disregarding (En1)
the environmental degradation Highly regarding (En2)
Legal Supporting the domestic monopoly Continue to support (L1)
Ending the support (L2)
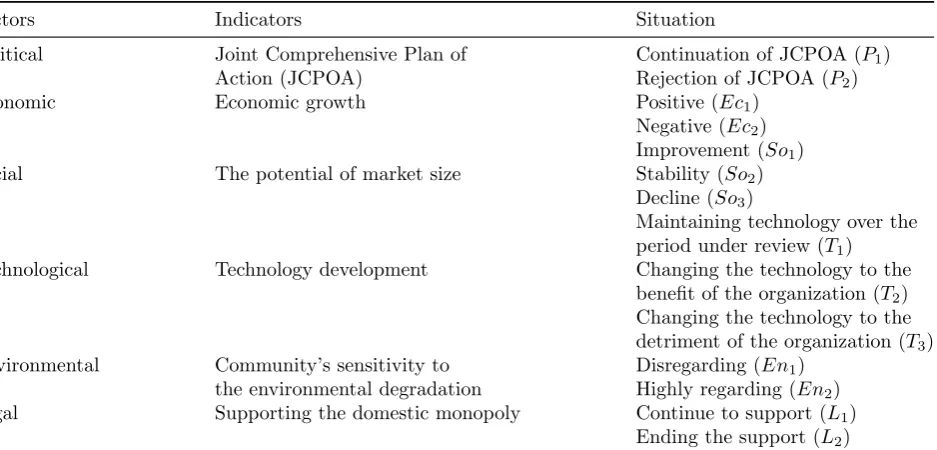
Table 3: Robustness and debility levels of the main strategies
Strategy Robustness Debility
Aggressive 36
90
28 90
Competitive 25
60
14 60
Defensive 24
60
14 60
Conservative 31
75
25 75
problem; that is, we use the performance ratio
rp,s=
tp,s min{tp,s:s∈S}
.
The performance of solverson any given problem
may be of interest, but we would like to obtain an overall assessment of the performance of the
solver. If we define
ρs(ω) =
1 np
size{p∈P :rp,s≤ω},
then ρs(ω) is the probability for solver s ∈ S
that a performance ratio rp,s is within a factor
is the (cumulative) distribution function for the performance ratio. We use the term ‘performance profile’ for the distribution function of a perfor-mance metric. It has been shown that a plot of the performance profile reveals all of the major
performance characteristics [4].
To employ the Dolan–Mor´e performance
pro-file, since in our model a strategy with the max-imum robustness is desirable while in the perfor-mance profile the minimum value of the outputs is preferable, at first we need to make a
decreas-ing transformation on the matrixB. Here, we use
an exponential function and introduce the matrix
Qas follows:
Qij =a−Bij, i= 1,2,· · ·, m, j= 1,2,· · ·, q, (3.4)
wherea >1 is a real constant. Next, we need to
define a matrix D, here called the resultant
ma-trix, withrrows andqcolumns in which each row
corresponds to a main strategyM Si,i= 1,· · ·, r,
and each column corresponds to a scenario Snj,
j = 1,· · ·, q. The ith row of D is the sum of
those rows of the matrix Qcorresponding to the
sub–strategies that comprise the main strategy
M Si in the sense of (2.1). Now, we can compare
the rows ofDusing the Dolan–Mor´e performance
profile to find the most desirable main strategy.
4
A real–world problem study
Our real–world study is devoted to the automo-tive industry of Iran. It is worth noting that after the oil industry, the automotive industry is the second most active industry of the country which has faced with a variety of challenges in recent years. Hence, the industry needs to review its strategies to ensure its survival in the future. We should note that decision makers participating in this case study were selected among the strate-gic planning experts of the automotive industry. Also, we used the MATLAB software to perform computations of our model.
At the first stage, the grand strategy matrix
proposed by David [3] was applied in order to
de-fine the strategies and their sequences. Hence, the main strategies were classified into the four
groups of aggressive (M S1), competitive (M S2),
defensive (M S3) and conservative (M S4). Each
of the main strategies consists of a number of sub–strategies demonstrated based on the
equa-tion 2.1as follows:
M S1 = S1⊕S2⊕S3⊕S8⊕S9 (4.5)
⊕S10,
M S2 = S3⊕S4⊕S5⊕S6, (4.6)
M S3 = S3⊕S5⊕S7⊕S8, (4.7)
M S4 = S2⊕S8⊕S9⊕S10⊕S11, (4.8)
in which the sub–strategies are classified as the
vertical integration (S1), the horizontal
integra-tion (S2), the concentric diversification (S3), the
horizontal diversification (S4), the conglomerate
diversification (S5), the joint venture (S6), the
retrenchment (S7), the divestiture (S8), the
mar-ket development (S9), the market penetration
(S10) and the product development (S11). Note
that among the sub-strategies of [3] the
liquida-tion strategy was eliminated because the industry does not intend to end its activities.
In order to design the future scenarios, experts identified the most important indicator relevant to the PESTEL, taking into account the Iran’s especial circumstances, and then specified their
various states as shown in Table 2. Among all
the possible scenarios, 15 cases were considered as
columns of the matrixM illustrated in Appendix
A. In the next step, the strategic condition
ma-trix A indicating favorability or non–favorability
conditions of each strategy was determined by the experts (see Appendix A). Then, the
matri-ces M and A are compared to obtain the matrix
B, as shown in Appendix A, which contains ro-bustness and debility scores of each strategy in
different scenarios. Now, taking into
consider-ation the data presented in the matrix B, the
Rosenhead’s classical scheme [16] for calculating
robustness and debility of the strategies lead to
the vectors R and F as follows:
R = [6 15 6 15 4 15 7 15 6 15 8 15 7 15 7 15 9 15 4 15 5 15 ] T,
F = [8 15 6 15 1 15 4 15 5 15 4 15 4 15 4 15 6 15 3 15 6 15 ] T.
strategies robustness and debility levels are
de-picted in Table3 and Figure1.
Figure 1: Comparing robustness and debility of the main strategies
The results of comparisons show that the con-servative and aggressive strategies are not favor-able enough. Besides, among the defensive and competitive strategies the best one cannot be eas-ily determined since their robustness and debility levels are close to each other. As discussed in
Section3, in such circumstances the Dolan–Mor´e
performance profile [4] may be helpful. So, here
we need to compute the resultant matrixDbased
on the rows of the matrixB. As described in
Sec-tion 3, using the equation (3.4) with a= 1.2, we
compute the matrix D as given in Appendix A,
being necessary to draw the performance profile figure.
Figure 2 shows the results of comparisons. As
seen, the competitive strategy turns out to be more desirable in contrast to the defensive
strat-egy in the sense of the Dolan–Mor´e performance
profile. Now, according to the vectorsRandF, it
can be stated that among the sub–strategies cor-responding to the competitive strategy the joint venture is more robust while the concentric diver-sification possesses the less debility.
Figure 2: Dolan–Mor´e performance profile for the main strategies
5
Conclusions
This study unveiled that an appropriate matrix model can allow us to include intricacies and complexities of a strategic planning problem and to review arbitrary number of future scenarios quickly as well as accurately. Furthermore, based
on the well–known Dolan–Mor´e performance
pro-file, an approach has been developed to analyze the strategies robustness which can be quite suc-cessful in selecting the right strategy, especially when the classical Rosenhead measure fails. Fi-nally, a real world problem in the automotive in-dustry of Iran has been studied using the pro-posed techniques and the results have been re-ported.
According to the results of comparisons, al-though the defensive and competitive strategies are more robust than the other two strategies, it is hard to select one of them as the best. In
this situation, the Dolan–Mor´e performance
pro-file helped us to see that the aggressive strategy is the robust one. To achieve more reasonable re-sults, it seems that assigning proper weights to
the indicators of Table 2 or considering the
ex-perts’ verbal judgments with fuzzy numbers can be helpful.
References
[1] F. Ackermann, Problem structuring meth-ods ‘in the Dock’: Arguing the case for soft OR, European Journal of Operational Re-search 219 (2012) 652-658.
[2] A. Azar, A. Sorourkhah, Designing a model for three–dimensional robustness analysis: A case study of Iran Khodro Machin Tools
In-dustries Company,Indian Journal of Science
and Technology 8 (2015) 1-5.
[3] F. R. David, Strategic Management:
Con-cepts and Cases, Prentice Hall, 2011.
[4] E. D. Dolan, J. J. Mor´e, Benchmarking
opti-mization software with performance profiles, Mathematical Programming 91 (2002) 201-213.
op-tions under uncertainty, Omega 37 (2009) 698-710.
[6] D. Eustace, E. R. Russell, E. D. Landman, Application of robustness analysis for devel-oping a procedure for better urban
trans-portation planning decisions,Journal of the
Transportation Research Forum 57 (2003) 107-121.
[7] M. Fallahnejad, M. Dehghan, E. Ebrahimi, A fuzzy decision making model for
infor-mation technology strategy selection,Global
Journal of Management Studies and Re-searches 1 (2014) 214-222.
[8] L. Franco, How OR can contribute to
strat-egy making?,Journal of the Operational
Re-search Society 62 (2011) 921-923.
[9] T. Issa, V. Chang, T. Issa, Sustainable business strategies and PESTEL framework, GSTF International Journal on Computing 1 (2010) 73-80.
[10] S. Kazeminezhad, S. Iranzadeh, Robust strategies of gas trade scenarios with relative regret approach in national Iranian gas
ex-port company, International Research
Jour-nal of Applied and Basic Sciences 6 (2013) 192-198.
[11] A. Mansson, Energy security in a decar-bonized transport sector: A scenario based analysis of Sweden’s transport strategies, Energy Strategy Reviews 13 (2016) 236-247.
[12] J. Mingers, J. Rosenhead, Problem
structur-ing methods in action, European Journal of
Operational Research 152 (2004) 530-554.
[13] G. Montibeller, L. Franco, Raising the bar: Strategic multi-criteria decision analy-sis,Journal of the Operational Research So-ciety 62 (2011) 855-867.
[14] A. A. Namen, C. T. Bornstein, J. Rosen-head, The use of robustness analysis for planning actions in a poor Brazilian
com-munity,Pesquisa Operacional 30 (2010)
267-280.
[15] C. Ram, G. Montibeller, A. Morton, Extend-ing the use of scenario plannExtend-ing and MCDA
for the evaluation of strategic options,
Jour-nal of the OperatioJour-nal Research Society 62 (2011) 817-829.
[16] J. Rosenhead, Planning under uncertainty: 2. A methodology for robustness analysis, Journal of the Operational Research Society 31 (1980) 331-341.
[17] J. Rpsenhead, Robustness Analysis, John
Wiley & Sons, 2010.
[18] S. Shahba, R. Arjmandi, M. Monavari, J. Ghodusi, Application of multi-attribute decision-making methods in SWOT analysis of mine waste management (case study:
Sir-jan’s Golgohar iron mine, Iran), Resources
Policy 51 (2017) 67-76.
[19] R. Somasundaram, V. Krishnamoorthy, Se-lection of strategy using multi objective multi criteria decision model in SSI unit, International Research Journal of Business and Management 1 (2014) 10-18.
[20] H. Y. Wong, Using robustness analysis to structure online marketing and
communica-tion problems, Journal of the Operational
Research Society 58 (2007) 633-644.
[21] H. Y. Wong and J. Rosenhead, A rigorous
definition of robustness analysis, Journal of
the Operational Research Society 51 (2000) 176-186.
Ali Sorourkhah is a Ph. D. can-didate at the department of indus-trial management in Semnan
Uni-versity, Semnan, Iran. He has
approaches, robustness analysis and some other soft OR methods.
Saman Babaie-Kafaki is an Asso-ciate Professor in Department of Mathematics of Semnan Univer-sity, Iran. He received his B.Sc. in Applied Mathematics from Mazan-daran University, Iran, in 2003, and his M.Sc. and Ph.D. in Ap-plied Mathematics from Sharif University of Technology, Iran, in 2005 and 2010, respectively. His research interests lie within numerical contin-uous optimization, numerical linear algebra and heuristic algorithms.
Dr. Adel Azar is a professor at
Tarbiat Modarres University. He has received 13 prestigious aca-demic awards, one of the most prominent of which is the sec-ond highest ranking Iranian gov-ernment medal in research and also national exemplary professor award in 2017. Dr. Adel Azar has already published 83 scientific ar-ticles in foreign accredited journals and 300 sci-entific articles published in credible international journals such as Fuzzy Sets Systems, Expert Sys-tems with Applications, Cleaner Production and as author or co-author, and 78 articles have been presented at national and international confer-ences. He is writer or co-writer of 20 books in the fields of management science, performance-based budgeting, fuzzy management science, and so on. He has co-translated 21 professional books into Persian language. He has completed more than 40 research projects. Several executive re-sponsibilities of Dr. Azar include: Head of the Statistical Center of Iran (7 years) and Head of the Center for Management Studies and
Produc-tivity of Iran (6 years). He is currently Head
of the Industrial Management Scientific Associ-ation. His research interests include: Fuzzy Man-agement Science, Managerial and Economic Sys-tems Modeling, Performance Management, Per-formance Based Budgeting.
Dr. Mohsen Shafiei Nikabadi is
M =
1 2 1 1 1 2 2 2 1 2 2 1 2 1 2 1 1 2 1 2 1 2 2 1 1 1 2 2 2 2 1 3 2 1 2 2 1 3 2 1 2 3 2 3 3 1 2 1 3 2 1 1 1 3 2 1 1 2 1 3 1 2 1 1 2 1 1 2 1 2 1 1 2 1 2 1 1 1 2 1 2 2 1 2 1 1 2 1 1 2
,
A=
0 0 1 2 0 0 0 0 0 0 0 0 2 1 2 1 0 0 0 0 0 0 1 2 0 0 0 0 0 0 2 1 0 0 2 1 2 1 1 2 1 2 1 2 1 3 1 3 0 0 2 3 0 0 2 3 3 1 3 1 0 0 0 0 0 0 3 2 0 0 0 0 0 0 2 3 1 2 0 0 0 0 0 0 0 0 2 3 0 0 0 0 1 2 1 2 1 2 0 0 0 0 0 0 1 2 0 0 0 0 0 0 1 2 1 2 0 0 0 0 1 2 0 0 0 0 1 2 1 2 0 0
,
B =
2 −1 −1 3 −2 1 0 −2 2 1 1 −2 −2 −2 −1
3 −1 2 1 2 −2 −1 −1 0 1 0 −1 0 1 −3
2 0 2 0 0 0 0 0 0 0 2 0 0 2 −2
1 −2 2 1 0 2 1 −2 2 −1 2 0 0 0 −2
0 −1 2 −1 1 0 2 0 −1 −1 0 2 1 2 −1
2 −1 3 −1 1 1 0 1 0 0 3 −1 1 1 −2
−3 1 0 −3 0 0 1 3 −2 −1 0 1 2 1 3 −3 1 0 −3 0 0 1 3 −2 −1 0 1 2 1 3 3 1 1 1 −1 1 −1 −1 1 1 3 −1 −1 1 −3
2 2 0 0 0 0 −2 0 0 2 2 −2 0 0 −2
1 2 −1 0 0 1 −1 −1 0 2 1 −1 0 −1 −2
,
D=
4.97 5.76 5.42 5.97 6.33 6.11 6.67 6.42 5.97 5.39 4.80 7.11 6.33 5.63 8.11 3.22 4.84 2.66 4.23 3.67 3.53 3.53 4.27 3.89 4.40 2.97 3.89 3.67 3.22 5.52 5.15 3.87 3.39 5.66 3.83 4.00 3.36 3.16 5.08 4.60 3.69 3.36 3.22 3.06 3.80 4.41 4.26 4.73 5.39 4.89 5.11 5.87 5.18 5.27 4.26 4.11 5.87 4.89 4.70 6.91