Volume 64, 2019, Pages 148–157
Proceedings of 28th International Conference on Software Engineering and Data Engineering
Open Source Software Survivability Prediction Using Multi
Layer Perceptron
Vijaya Kumar Eluri
∗, Shahram Sarkani, and Thomas A. Mazzuchi
Engineering Management and System Engineering, The George Washington University, Washington DC, USA
(eluri,sarkani,mazzu)@gwu.edu
Abstract
Many organizations develop software systems using Open Source Software (OSS) com-ponents. OSS components have a high risk of going out of support, making dependency on OSS components risky. So, it is imperative to perform risk assessment during the selection of OSS components. A model that can predict OSS survivability provides an objective criterion for such an assessment. Currently, there are no simple, quick and easy meth-ods to predict survivability of OSS components. In this paper, we build a simple Multi Layer Perceptron (MLP) to predict OSS survivability. We performed experiments on 449 OSS components containing 215 active components and 234 inactive components collected from GitHub. The evaluation results show MLP achieves 81.44% validation accuracy for survivability prediction on GithHub dataset.
Keywords: open source software, GitHub, software complexity, machine learning, Multi Layer Perceptron (MLP)
1
Introduction
Organizations typically develop software systems using in-house software components and com-mercial off the shelf software (COTS). Many organizations are changing the way they create, capture, consume, and commercialize software [5] by increasingly adopting Open Source Soft-ware (OSS) components. OSS components are seeing dramatic growth in use, causing a large number of applications to contain much more open source code than proprietary code [4]. Syn-opsys’ software composition analysis (SCA) 2018 report [4] using Black Duck audit team found OSS components in 96% of the applications scanned (similar to 2017) and 257 OSS components per codebase (75% growth between 2017 and 2018).
For a system to be successful, a risk assessment of the software components that will even-tually become part of a larger system is important. For in-house software components, there is an opportunity to take proactive measures during the entire development life cycle to ensure
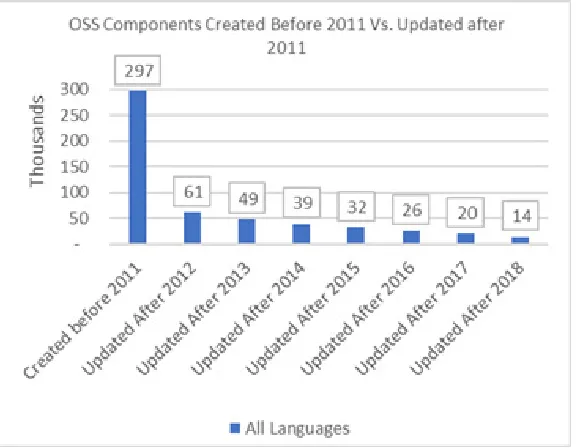
longevity. For COTS components, well established selection methods are available [18]. How-ever, when OSS components are evaluated, system engineers have no control over the design and build phase. Also, dependency on OSS components is risky, given OSS components have a high risk of going out of support - see Figure1 for an example of how fast repositories go unsupported on GitHub. So, it is imperative to perform risk assessment during the selection of OSS components. A model that can predict OSS survivability provides an objective criterion for such assessment and comparison between OSS component candidates. In this study, we use easily computable software component metrics, readily available developer and user data as features to train Multi Layer Perceptron (MLP) to predict survivability of OSS components.
OSS component refers to a GitHub repository (usually abbreviated to “repo”) which is a location where all the files for a particular OSS project are stored. Each project has its own repo, and you can access it with a unique URL. Data in Figure1 is obtained by querying GitHub. Queryhttps://api.github.com/search/repositories?q=created:<=2011-01-01
provides data for components created before 2011. Queryhttps://api.github.com/search/ repositories?q=pushed:>2012-01-01+created:<=2011-01-01 provides data for compo-nents created before 2011 and updated after 2012 (Replacing 2012 with 2013 to 2018 in this query gives the component updated data for the rest of the years).
Figure 1: OSS Components on GitHub
2
Related Work
OSS survivability was introduced as Viability Index [20] and defined with three dimensions: vigor, resilience, and organization. Vigor represents the ability of a project to grow over a period of time, resilience represents the ability of a project to recover from internal or external perturbations, which are interpreted as changes in the project’s operating environment and finally organization represents the amount of structure exhibited by the interaction between software project contributors. Viability Index was demonstrated to be a robust and valid measure of OSS project survivability on projects hosted at SourceForge.net [1]. 136 samples were used to compute the weights for each dimension and cross-validated on a holdout sample of size 96 achieving prediction accuracy of 92.78%. This work was replicated in [12] by considering 183 projects from the Gnome ecosystem [11]. Here the authors define non-survival in terms of inactivity if there were no commits to its version repository during the 365 days before the date on which they extracted the source code repository.
Similar to OSS survivability, OSS Life-Span prediction was developed in [16]. OSS life-span was predicted using five characteristics of an OSS component: number of files, the programming language used, number of core developers, quality of core developers (defined by the number of followers), and the type of application. Here non-survival is defined as no code or comment committed in six months. In this study, we use a similar definition for suvivability as both previous studies.
3
Methodology
3.1
Design
The proposed method is based on [9] and consists of the following steps:
1. Collect GitHub OSS component developer and user attributes
2. Label the components found in step 1, using the status or last updated attribute
3. Download the component code, perform static analysis using sonar scanner tool, and collect product metrics
4. Determine the survivability score of the component using the product, developer and user attributes
5. Repeat this for all candidate components and compare the results.
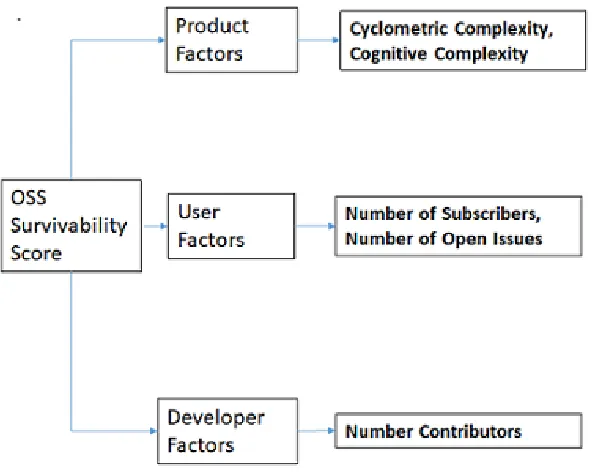
To design the attributes, we first investigated the factors contributing to the OSS component survival. There are three entities that are involved in OSS components - the product, user, and developer. Thus, we propose three primary dimensions for evaluating the survivability of the candidate OSS component: Product Factors, User Factors, and Developer Factors, as shown in Figure2.
3.2
Dimensions of Survivability
3.2.1 Product Factors
Figure 2: Survivability dimensions for the candidate OSS component
or the control flow graph (CFG)- a higher value indicating more complex code. Mathematically, it is computed as,CC =E−N+ 2P, where,E = the number of edges in the CFG,N = the number of nodes in the CFG, andP = the number of connected components in the CFG. One of the shortcomings ofCCis that it does not take into consideration comprehensibility of source code and may give similar measures for two different code blocks having vastly different levels of comprehensibility. Since ease of understanding is directly related to the maintainability of the software, a metric that considers this is essential. Cognitive complexity [2] has been defined as a metric that takes care of the relative difficulty of understanding different program structures. This metric penalizes nested constructs and recursive definitions that are relatively more difficult to understand and interpret. We use both Cyclometric Complexity and Cognitive Complexity attributes in our model.
3.2.2 User Factors
OSS users are segmented into four categories in [13]: Segment 1 encompasses ordinary users who are neither software developers nor OSS community members. Segment 2 consists of users who are exclusively developers and choose not to join OSS community groups. Segment 3 includes users who are exclusively OSS members. Segment 4 encompasses users who are both developers and members. In this study, we use subscriber base (number of subscribers to an OSS component) because we believe it is a proxy for real users. We augment subscriber base with “number of open issues” to potentially distinguish real users from non-users, because we believe real users are more likely to open issues. Subscriber count and open issue count can be extracted by querying Github using url: https://api.github.com/repos/apache/zookeeper
3.2.3 Developer Factors
The majority of OSS deverlopers are volunteers who supply their work for free [6], and many of them agree to have their contributions licensed in such a way that is difficult for them to profit directly from the resulting software product. In [17], OSS developers are divided into two into two distinct groups: core developers and non-core developers. In this Study, we use the total number of contributors for each component for the latest release without any further segmentation. We believe that developers play an important role in the success of OSS projects. Number of contributors can be queried by downloading OSS component to local file system and executing the following linux command:
$ g i t s h o r t l o g −sn | wc −l
3.3
Data Sources
Before the ’90s, the concept of free and open-source software was not prevalent, and most soft-ware companies had proprietary licensed softsoft-ware available on the market. In the early ’90s, the Linux kernel was released under the GNU General Public License [22] as the first proper open-source software, and it garnered much attention from hobbyists and programming enthusiasts. Gradually the benefits of open-source began to be realized by organizations - making source code available to the general public increased community involvement and encouraged product development and evolution. As of now, some of the most successful software is open-source, and open-source development is promoted worldwide. Two of the largest web platforms hosting open-source projects are SourceForge [1], with over 430,000 projects and 3.7 million users, and GitHub [3], with millions of repositories and users.
Obtaining data from OSS repositories is a tedious exercise [10]. However, GitHub is a collaborative development hosting site that provides access to internal data stores through an extensive REST application programming interface. In this study, we collected GitHub repository data as described next.
3.4
Data Collection
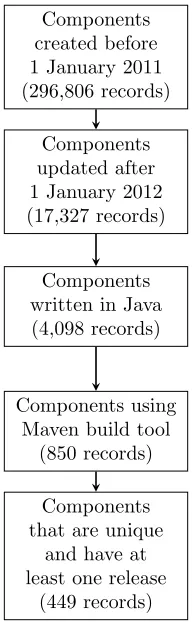
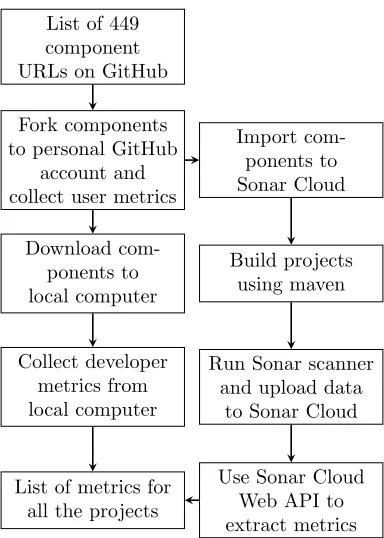
The process used to collect OSS component data using the GitHub API is shown in Figure3. After the component data is collected, the process to collect attributes from the repositories is shown in Figure4.
3.5
Machine Learning Model
Multi Layer Perceptron (MLPs) were developed as computational learning models in the 1940s, crudely inspired by the functioning of the human brain [21]. MLPs are made up of layers of ‘neurons’ or nodes with connections between the layers. Each neuron is also called a perceptron, which, is a linear classifier, that outputs one class if the function exceeds a certain threshold value and another class otherwise.
f(x) = (
1, ifwTx−b >0
0, otherwise
wherexis the input vector,wis a vector of real-valued weights andbis a bias.
Components created before 1 January 2011 (296,806 records)
Components updated after 1 January 2012 (17,327 records)
Components written in Java (4,098 records)
Components using Maven build tool
(850 records)
Components that are unique
and have at least one release
(449 records)
Figure 3: Data Collection Process
decision boundaries. Each layer in a neural network is made up of several such perceptrons, which take in some input, apply an activation function on the input and output some value based on the threshold. The example above uses a simple unit step function. However, this activation function is not used in real-world applications. The unit step function being non-continuous, is not differentiable, and hence cannot be used for training neural networks using conventional methods. Activation functions (like sigmoid function) are used to incorporate non-linearities in neural networks. Sigmoid function
f(x) = 1/(1 +e−x)
is commonly used as it is continuous and differentiable.
Learning in MLP is done via gradient descent and backpropagation [21]. The MLP acts as a function and maps the input vector X to an output Ypredicted. During training with
labelled data, the predicted output is compared with the actual outputYactual and a loss is
List of 449 component URLs on GitHub
Fork components to personal GitHub
account and collect user metrics
Download com-ponents to local computer
Collect developer metrics from local computer
Import com-ponents to Sonar Cloud
Build projects using maven
Run Sonar scanner and upload data
to Sonar Cloud
Use Sonar Cloud Web API to extract metrics List of metrics for
all the projects
Figure 4: Metric Collection Process
3.6
Training and Testing
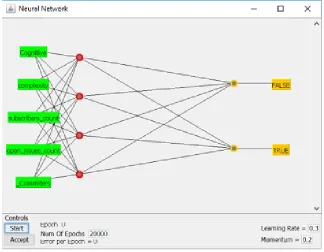
Our data set consisted of 449 OSS project records from GitHub [3]. Each record is associated with the inactive or active project and has five input attributes: Cognitive Complexity, Cyclo-metric Complexity, Number of Subscribers, Number of Open Issues, and Number of Developers. A project is considered inactive if it did not have activity for one year before 1st January 2019. We split the data set into a testing set consisting of 97 (21.6%) records as a hold out for final testing. We used the remaining 352 (78.4%) records for training. MLP machine learning algo-rithm from WEKA [14] tool is used. MLP with one hidden layer consisting of 4 nodes, learning rate of 0.3, momentum rate of 0.2 and 20,000 epochs were used to train the model. The model is shown in Figure5.
3.7
Results
Figure 5: MLP Configuration
Metrics Validation Set
Accuracy 81.44%
TPR 77.78%
FPR 13.95%
Precision 87.50%
F-Measure 82.40%
ROC 83.70%
Table 1: Results using all five features
set in predicting OSS component survivability.
3.8
Threats to Validity
The findings of this study are derived from an analysis of 449 programs written in Java. While the data set is large, a generalization of the results to other programming languages may not be possible.
n=97 Predicted:False Predicted: True Actual: False True Negatives = 37 False Positives = 6 43 Actual: True False Negatives = 12 True Positives = 42 54
49 48
The features used in this study are derived from the latest version. While we verified that there are no obvious patterns on the latest software compared to a different release version, building models with data sets computed at different release versions would make the model more robust.
The data for this study is collected from GitHub and generalization of the results to other open source hosting platforms may not be possible. We hypothesize that the results would generalize to other hosting platforms and in a future work, we plan to collect data from other open source platforms and validate this hypothesis.
3.9
Conclusion
Software complexity, developer commitment and user base have a significant impact on OSS longevity. These attributes are effective predictors of open source software survivability because they expose developer habits, unveil the user interest, and capture the essential metrics for architecture, design, and code of the underlying software. Applying MLP machine learning technique on data collected from GitHub, we were able to predict OSS survivability with an accuracy of over 81.44% on validation set while the training set had an accuracy of 70.17% indicating that the model generalized well.
References
[1] www.sourceforge.net.
[2] https://www.sonarsource.com/resources/white-papers/cognitive-complexity.html. [3] www.github.com.
[4] Synopsis: Open source security and risk analysis, 2018. ID: 271893.
[5] J Joey Angeren, van, J. Kabbedijk, S. Jansen, and K. M. Popp. A survey of associate models used within large software ecosystems, 2011.
[6] Hind Benbya and Nassim Belbaly. Understanding developers’ motives in open source projects: a multi-theoretical framework. Communications of the AIS, 27:589–610, 2010.
[7] Alexander Chatzigeorgiou. Mathematical assessment of object-oriented design quality. IEEE Transactions on Software Engineering, 29(11):1050–1053, 2003.
[8] Shyam R Chidamber and Chris F Kemerer. A metrics suite for object oriented design. IEEE Transactions on software engineering, 20(6):476–493, 1994.
[9] Ruma Das, Shahram Sarkani, and Thomas A Mazzuchi. Software selection based on quantita-tive security risk assessment. IJCA Special Issue on Computational Intelligence and Information Security, (1):45–56, 2012.
[10] Oscar Franco-Bedoya, David Ameller, Dolors Costal, and Xavier Franch. Open source software ecosystems: A systematic mapping. Information and Software Technology, 91:160–185, Nov 2017. [11] Daniel M. German. The gnome project: a case study of open source, global software development.
Software Process: Improvement and Practice, 8(4):201–215, 2003. doi: 10.1002/spip.189; 28. [12] Mathieu Goeminne, Maelick Claes, and Tom Mens. A historical dataset for the gnome ecosystem.
pages 225–228. IEEE, May 2013.
[13] Kholekile L. Gwebu and Jing Wang. Seeing eye to eye? an exploratory study of free open source software users’ perceptions.The Journal of Systems and Software, 83(11):2287–2296, 2010. [14] Mark Hall, Eibe Frank, Geoffrey Holmes, Bernhard Pfahringer, Peter Reutemann, and Ian H.
Witten. The WEKA data mining software: an update.SIGKDD Explorations, 11(1):10–18, 2009. [15] Kurt Hornik, Maxwell Stinchcombe, and Halbert White. Multilayer feedforward networks are
[16] Zhifang Liao, Benhong Zhao, Shengzong Liu, Haozhi Jin, Dayu He, Liu Yang, Yan Zhang, and Jinsong Wu. A prediction model of the project life-span in open source software ecosystem.Mobile Networks and Applications, pages 1–10, Jan 13, 2018.
[17] Ju Long. Understanding the role of core developers in open source software development.Journal of Information, Information Technology, and Organizations, 1:75, Jan 1, 2006.
[18] N. A. Maiden and C. Ncube. Acquiring cots software selection requirements. IEEE Software, 15(2):46–56, Mar 1998.
[19] Thomas J McCabe. A complexity measure.IEEE Transactions on software Engineering, (4):308– 320, 1976.
[20] U. Raja and M. J. Tretter. Defining and evaluating a measure of open source project survivability.
IEEE Transactions on Software Engineering, 38(1):163–174, Jan 2012.
[21] David E. Rumelhart, Geoffrey E. Hinton, and Ronald J. Williams. Learning internal represen-tations by error propagation. In David E. Rumelhart and James L. Mcclelland, editors,Parallel Distributed Processing: Explorations in the Microstructure of Cognition, Volume 1: Foundations, pages 318–362. MIT Press, Cambridge, MA, 1986.