VOLUME 41, ARTICLE 30, PAGES 873
-
912
PUBLISHED 8 OCTOBER 2019
http://www.demographic-research.org/Volumes/Vol41/30/ DOI: 10.4054/DemRes.2019.41.30
Research Article
Changing gender relations, declining fertility?
An analysis of childbearing trajectories in 19
th-century Netherlands
Hilde Bras
Reto Schumacher
This publication is part of the Special Collection on “The Power of the Family,” organized by Guest Editors Hilde Bras and Rebecca Sear.
© 2019 Hilde Bras & Reto Schumacher.
This open-access work is published under the terms of the Creative Commons Attribution 3.0 Germany (CC BY 3.0 DE), which permits use, reproduction, and distribution in any medium, provided the original author(s) and source are given credit.
1 Introduction 874
2 Background 876
2.1 Gender relations in explanations of a fertility decline 876
2.2 Gender relations and social networks 877
2.3 Spousal age differences 878
3 Setting 878
4 Hypotheses 881
5 Data, measures, and methods 883
5.1 Data 883
5.2 Measures 883
5.2.1 Dependent variable: Childbearing trajectories 883
5.2.2 Independent variables 885
5.3 Methods 888
6 Results 888
6.1 Descriptive statistics 888
6.1.1 Spousal age differences 888
6.1.2 Childbearing trajectories 889
6.2 Determinants of childbearing trajectories 893
7 Conclusion and discussion 898
8 Acknowledgments 901
Changing gender relations, declining fertility? An analysis of
childbearing trajectories in 19
th-century Netherlands
Hilde Bras1
Reto Schumacher2
Abstract
BACKGROUND
A long-standing and still unresolved debate has developed on whether the historical fertility transition was caused by ‘spacing’ (increasing the time between births) or by stopping (terminating childbearing at younger ages). Moreover, there is little consensus about the relative importance of gender relations in effecting reproductive change. OBJECTIVE
First, we wish to shed new light on the stopping versus spacing debate by applying a sequence analysis approach, allowing us to describe changes in complete childbearing trajectories. Second, we want to understand the association between gender relations, among other factors, and reproductive trajectories during the historical fertility decline. METHODS
We use longitudinal data from GENLIAS, a dataset constructed from linked civil registers of the province of Zeeland, the Netherlands, covering the period 1811‒1911. We employ cluster and sequence analysis to identify different types of childbearing trajectories and logistic regression to estimate their correlates.
RESULTS
We identified five often-experienced trajectories: two high-fertility traditional trajectories (differing in the length of the reproductive phase), a ‘Stoppers’ trajectory, a ‘Late Starters’ trajectory, and an ‘Almost Childless’ trajectory. Our results show that stopping was the way through which couples controlled their fertility during the early phase of the historical fertility transition in Zeeland, the Netherlands. Although couples with more egalitarian relationships had a higher likelihood to follow a Stoppers trajectory rather than the highest-fertility trajectory, stopping was most clearly linked to birth cohort and social class.
1 University of Groningen, the Netherlands. Email:[email protected].
CONTRIBUTION
Our paper extends the literature on the process of the historical fertility decline and its determinants via a detailed empirical examination of childbearing trajectories and the conditions under which these trajectories took place. With our sequence analysis approach we add both substantively and methodologically to long-standing debates.
1. Introduction
During the 19th century and first decades of the 20th century, most European societies went through the fertility transition, the shift from high to low fertility. Among historical demographers, a long-standing and still unresolved debate has developed about whether this fertility decline was caused by ‘spacing’ (increasing the time between births) or by ‘stopping’ (terminating childbearing at younger ages). Although by now an impressive body of theoretical and empirical knowledge about these processes has accumulated, very little is known about the trends and determinants of complete reproductive pathways during the historical fertility decline. Most studies have focused on changes in the timing of single markers of reproduction, such as starting, spacing, or stopping, or of completed fertility (Anderton and Bean 1985; Knodel 1987; Knodel and Van de Walle 1979; Szreter and Garrett 2000; Van Bavel 2004; Van Bavel and Kok 2005, but cf. Darak et al. 2015; Schumacher, Matthijs, and Moreels 2013). Yet, societal changes affect reproductive careers as a whole, not just the separate transitions of which they are part. The notion of trajectories or ‘social pathways’ (Bras, Liefbroer, and Elzinga 2010; Elder, Johnson, and Crosnoe 2003; Macmillan 2005) captures this idea of life-course dynamics taking place over extended periods of (life) time. Moreover, the endogenous causality (Mayer 1987) or biographic opportunity costs (Birg, Flöthmann, and Reiter 1991; Schumacher, Matthijs, and Moreels 2013) of life courses is better examined by investigating holistic trajectories than through the study of separate transitions. Thus, a first question of our study is whether new light can be shed on an old debate by applying a sequence analysis approach to describe changes in complete reproductive trajectories in a European society undergoing fertility decline.
confirmed the relevance of blended models for understanding fertility behaviour, positing structural factors, such as social class and urbanisation, alongside factors emphasising the role of social relations and social interactions (Bras 2014; Casterline 2001; Van Bavel 2004). In terms of the latter, the idea that gender relations should be in the centre of the academic debate on the historical fertility decline has been frequently emphasised. It has been suggested that as a result of industrialisation and the development of capitalism, patriarchal inequalities decreased, enhancing women’s bargaining power. This would have enabled them to implement their desires for smaller families (Folbre 1983; Gittins 1982; Janssens 2007a; MacKinnon 1995; Seccombe 1993; Watkins 1993). Dovetailing closely with the previous explanation, other researchers have understood changes in gender relations from the perspective of a cultural shift towards romantic love and egalitarian partnerships. Spouses in egalitarian unions would have been better able to communicate about fertility, which allowed them to reach their preferred family size more easily than couples with more inegalitarian relationships (Coontz 2005; Matthijs 2002; Shorter 1975; Van De Putte et al. 2009). Yet, there is little consensus about the relative importance of changing gender relations in effecting reproductive change. One of the reasons is that empirical evidence has remained relatively scant. Although a number of inspiring studies based on autobiographies, oral testimonies, and letters have produced important new insights (Fisher 2000, 2006; Fisher and Szreter 2003, 2010; Hilveych 2016; Humphries 2007; Pooley 2013; Seccombe 1990), few studies have systematically integrated gender relations in explanatory models of reproductive behaviour.
factors, and women’s reproductive trajectories. In the conclusion and discussion, we summarise our results and reflect on their implications for the debate on stopping versus spacing during the historical fertility decline and the significance of gender relations as a determinant. We conclude by indicating the limitations of the study and offering suggestions for further research using our sequence analysis approach.
2. Background
2.1 Gender relations in explanations of a fertility decline
Demographic research on fertility transitions has traditionally been dominated by supply-demand (Easterlin 1978; Easterlin and Crimmins 1985) and innovation-diffusion explanations (e.g., Bongaarts and Watkins 1996; Casterline 2001; Cleland 2001). Both perspectives see the couple as the major decision-making unit and assume that couple relations were neutral and unanimous. Whether and how conflict, power, and inequality in household relations influenced reproductive decision-making is often not problematised (Janssens 2007b; MacKinnon 1995; Seccombe 1990; Watkins 1993). A growing number of researchers, however, have started to incorporate gender relations in their studies of fertility and parenthood (Abadian 1996; Folbre 1983, 1994; Greenhalgh 1995; Hilevych 2015, 2016; Hollerbach 1980; Pooley 2013; Praz 2007, 2009; Rusterholz 2015). By gender relations we understand the specific subset of social relations uniting women and men as social groups in a particular community, including how power and access to resources are distributed between the sexes. Gender relations intersect with all other influences on social relations (age, ethnicity, race, religion, etc.) to determine the position and identity of people in a social group. Since gender relations are a social construct, they can change or be transformed over time.
Another body of research holds that the fertility decline was the result of a cultural shift towards more egalitarian spousal relations, emphasising romantic love and the heightened emotional quality of marital relations (Bras 2014; Coontz 2005; Gillis 1996; Mitterauer and Sieder 1983; Matthijs 2002; Shorter 1975; Van de Putte et al. 2009; Van Poppel et al. 2001). As of the second half of the 19th century, a new marriage pattern would have developed, characterised by less celibacy, earlier and more universal marriage, and smaller spousal age gaps than had been common before (Matthijs 2002; Van de Putte et al. 2009). Marriages were less often contracted for instrumental reasons and became increasingly based on love, equality, and spousal companionship. This new marriage pattern was accompanied by a rise in emotionalism, sentimentalism, and more egalitarian marriage relations. It has been suggested that partners in these egalitarian unions were better able to communicate and reach consensus about fertility, and achieve their preferred family size, than couples with less egalitarian relations (Coontz 2005; Matthijs 2002; Shorter 1975; Van De Putte et al. 2009).
2.2 Gender relations and social networks
2.3 Spousal age differences
In this study we use the spousal age gap as an indicator of couples’ gender relations. The age difference expresses the extent of power and equality in spousal relations. A large age gap, particularly between older husbands and younger wives, is usually understood as an indication of patriarchal gender relations, meaning that women have less power in the relationship (Atkinson and Glass 1985; Cain 1993; Carmichael 2011; Carmichael, de Moor, and Van Zanden 2011; Mitterauer and Sieder 1983; Skinner 1993; Therborn 2004; Wheeler and Gunter 1987). Unequal power may affect the quality of marital relations by impeding conjugal intimacy (Barbierbi and Hertrich 2005), the standard of marital sexuality (Mitterauer and Sieder 1983), and women’s bargaining position to realise her desired family size. The age difference also indicates whether the life courses of spouses were synchronous, that is, whether they were generational peers and could easily communicate about future life goals, such as contraception and the number of children, or were less able to do so (Barbieri and Hertrich 2005; Safilios-Rothschild 1972).
The spousal age gap is a widely available and convenient measure. It can be derived from marriage certificates, which are accessible for large parts of the population in most Western countries since the early 19th century. Yet, the age gap also has a number of limitations. First, age differences between spouses may result from demographic constraints and marriage market conditions. Age differences have also been found to differ by gender and fluctuate over time, partly because of changes in the age at marriage. There is often a positive association between the spousal age difference and the age of the groom (Ní Bhrolcháin 1992, 2005). Thus, when marriage age decreases over time, particularly of males, this automatically leads to smaller age gaps. Secondly, the spousal age gap may influence fertility not only via the nature of the gender relationship in terms of power or equality but also via the age at marriage and the accompanying fecundity of the spouses (Bongaarts and Potter 1983). Additionally, nonphysiological factors related to marriage age, such as marital satisfaction and sexuality, may also influence fertility (Casterline, Williams, and McDonald 1986; Feng et al. 2010). Hence, to be able to interpret the measure correctly, both the age-sex structure of the marriage market and the ages at marriage of both the bride and the groom need to be carefully controlled for.
3. Setting
mainland area that borders Belgium to the south. During the 16th and 17th centuries, Zeeland played an important role as a region of industry and trade and boasted influential trading towns such as Middelburg, Zierikzee, and Veere. After 1585, when the Spaniards conquered Antwerp, the significance of Zeeland’s trade and industry declined and a process of ruralisation took place, which made the region increasingly dependent on its agricultural sector (Priester 1998). During the 19th century, Zeeland’s economy was mainly based on market-oriented, capital-intensive farming specialising in the production of cash crops, such as wheat, flax, madder, and sugar beets (Priester 1998). The social structure of the countryside was highly polarised. A large gap existed between the wealthy gentlemen farmers, who imitated the lifestyle of the urban middle classes, and the mass of proletarianised agricultural labourers. In our sample, some 55% of all grooms were farmworkers, while 10% were farmers (see Table 1). During the 19th century, the occupational structure hardly changed. Social class barriers were rigid and only little social mobility took place (Kok 1998). Only as of 1900 did occupational heterogamy start to rise (Bras and Kok 2005).
The cash crops cultivated in Zeeland were labour intensive and stimulated the demand for cheap female labour. Both married and unmarried women were employed in agriculture. According to the occupational census of 1849, 16% of the female population was employed as a field labourer. Female fieldworkers were estimated to comprise half of all gainfully employed agricultural labourers (Jansen 1989:17). Women’s tasks did not differ much from those of men. Female workers for instance tied the grain, a job that in other parts of Europe was considered male work. In general, however, typical female agricultural activities, such as weeding, planting, cutting grain, lifting potatoes, and harvesting peas and beans, involved a lower level of productivity and technology. Thus, both the societal recognition of women’s work and female wages were lower than those of men. Despite of this, the remunerative contribution brought in by women and children was absolutely necessary to sustain the family income. The husband provided about two-thirds of the costs of maintenance, while the wife and coworking children contributed one-third. Because children were essential contributors to the family budget, most women bore and raised many children (Jansen 1989).
fieldwork. Therefore, around the turn of the century the costs and benefits of children had changed drastically (De Regt 2004).
Although the agricultural sector made up the largest part of Zeeland’s economy, part of our study population lived in urban areas. The Zeeland towns fulfilled a regional function in trade, industry, and administration. Industrialisation took off after about 1850 when shipbuilding, beer brewing, shoemaking, textiles, concrete production, and wood sawing started to grow. These industries were located in the two largest cities, Middelburg and Vlissingen (known historically in English as Flushing), and in several smaller communities (Franken and Adriaanse 2004; Zijdeman 2010).
The Zeeland population was a mixture of Catholics, liberal, and orthodox Protestants, differing considerably in religious rigidity. The Catholic Church was opposed to birth control and exerted a strong pronatalist pressure on married couples (Engelen and Kok 2003; Van Bavel and Kok 2005; Van Heek 1956; Van Poppel 1992). In predominantly Catholic communities, the power position of parents and the local clergy were strong, making it almost impossible for couples not to compel to the ideal of large families. Orthodox Protestants adhered to roughly the same firm morality and childbearing norms as Catholics, staying virulently opposed to birth control within marriage until at least the 1920s (Van Heek 1956; Van Poppel 1985).
The Netherlands had a relatively late fertility transition in comparison to other European countries, starting only after 1880, but with strong regional differences. Zeeland followed a more or less average path to low fertility. Until about 1880, fertility levels were higher than the Dutch average. The eventual fertility decline, which started around 1870, was much steeper with fertility levels dropping considerably below the Dutch average after about 1900 (see Figure 1).
Figure 1: General marital fertility (number of births per 1,000 married women aged 15 to 45) in the Netherlands and in the province of Zeeland,
1830‒1930
Source: Hofstee, E.W. (1981): 132.
Men and women in Zeeland married at relatively young ages. During the 19th century, men’s average age at marriage was 26.6 years while women married on average around 24.7 years (Kok 1998: 162). In other Dutch provinces, marriage ages were at least a couple of years higher. Moreover, as anywhere else in north-western Europe, strong social norms about spousal age differences existed (Bras and Suanet 2018). In Zeeland, large age differences were generally disapproved of. “A young woman is an old man’s coffin” was a common saying about marriages of men with much younger women. But a man who married a much older woman was also criticised (Van Poppel 1992). Couples who violated these standards could count on sanctions by parents, neighbours, and age peers.
4. Hypotheses
In our introduction we alluded to the long-standing yet unresolved debate about spacing versus stopping in the historical European fertility transition and asked the question whether a sequence analysis approach might provide new answers. A first hypothesis
100 150 200 250 300 350 400 450
1830 1840 1850 1860 1870 1880 1890 1900 1910 1920 1930
M
arital
fertility
Period
thus pertains to the shape of women’s childbearing trajectories over time. So far, the empirical evidence for stopping over spacing has been stronger (Knodel 1987; Timæus and Moultrie 2008). However, disagreement on how to correctly measure birth spacing has brought the debate to a dead-end. We thus start from the following hypothesis:
Hypothesis 1a: Across cohorts, we expect to observe an increasing share of fertility trajectories that were characterised by a shorter reproductive phase and a smaller number of children.
Hypothesis 1b: Alternatively, we expect that the childbearing trajectories of consecutive cohorts were marked by increasing intentional spacing during the reproductive phase, resulting in a smaller number of children.
Our second question pertained to the determinants of different types of childbearing trajectories and specifically the role of gender relations. In section 2 we presented two closely related branches of literature on the relationship between changing gender relations and declining fertility. One perspective emphasised that the fertility decline was a result of the rise of capitalism, growing opportunities for remunerative women’s work, and increased female bargaining power, while another strand of literature held that the fertility decline was a consequence of a cultural shift from instrumentality towards romantic love and more egalitarian partnerships. Given the fact that Zeeland agriculture, the province’s main economic sector, was already highly capitalised in the early 19th century – including full, and remunerative, labour participation of women – we expect that the rise of romantic love and egalitarian partner relations in particular must have been related to the fertility transition in Zeeland. We also argued that the gender relations in couples’ social networks should be taken into account. Hence, we formulate the following hypothesis:
Hypothesis 2a: It is expected that Zeeland couples with more egalitarian gender relations (marriages between spouses of equal age versus ones where the wife or husband is older), or whose parents, siblings, or community members had more egalitarian gender relations, experienced a childbearing trajectory characterised by a shorter reproductive phase and a smaller number of children.
5. Data, measures, and methods
5.1 Data
Our study is based on a large historical database, named GENLIAS, which contains all available birth, marriage, and death certificates from the province of Zeeland for the period 1811‒1911. Our point of departure is a data file that includes coded information from all birth certificates for the period 1811‒1866 that could be linked with the marriage certificates of the parents of the newborn child (N = 209,300, among which 40,939 girls and 36,595 boys who got married in the province of Zeeland). The restriction that the youngest cohort should be born no later than 1866 was based on the fact that we need to reconstruct the reproductive histories of these people, while we do not have access to documents more recent than 1911 (= 1866 + 45) for legal reasons implied by Dutch privacy laws. The precondition that a match could be made with the marriage of the parents was necessary to enable the inclusion of parental characteristics, specifically parental gender relations. Since we need information about the full reproductive lifespan, and since we only collected such information within the province of Zeeland, we dropped all individuals for which we could not find a death certificate because absence of a death certificate (in the province of Zeeland) is a strong indication of outmigration. Among the 40,939 women with observed marriage certificates, 15,014 remained married until age 45 (bride’s and groom’s death occurred after the bride’s 45th birthday, and no second marriage was observed for the bride until that date). Hence, a limitation of our sample is that it is quite selected. We will come back to this in the discussion section. The GENLIAS database (release Siblings.01) provides the exact dates of the births of the first six children, the total number of children ever born, and the exact date of the birth of the last child. Our sample of 15,014 full birth histories comprises a total of 87,204 observed births, which is on average 5.8 children ever born per woman (see Table 2).
5.2 Measures
5.2.1 Dependent variable: Childbearing trajectories
distinguish three categories of states, each corresponding to the main subsequences of the reproductive life course. The first state represents the starting component and spans from age 15 to the age at first birth. The second state stands for the reproductive subsequence, which starts at the age at first birth and ends at the age at last birth. It is divided into substates representing the number of children ever born. The last state is equal to the stopping phase in a fertility trajectory and corresponds to the period of completed family size between the age at last birth and the onset of sterility. Using the TraMineR package available in R (Gabadinho et al. 2011), we assess the share of behavioural fertility subtypes in each cohort by first computing pair-wise optimal matching distances between all trajectories of a given generation. Based on these dissimilarity matrices we then perform a cluster analysis (using the PAM algorithm; Kaufman and Rousseeuw 1990) to identify specific reproductive subtypes.
Figure 2 demonstrates how childbearing trajectories have been coded into state sequences by showing four individual birth histories. Birth history 1 refers to a woman who had her first child at the age of 33 and her second child at the age of 35. She remained therefore in the state ‘1 child ever born’ for two years. Further children followed at the ages of 36, 38, 39, and 41. Her ninth and last child was born when she was 47 years old, which means that in her case, the final state of ‘no more children born’ is not observed before age 45. Birth history 2 refers to a woman who had a first child at the age of 37 and a second and last child at the age of 40. She entered the last state of completed family size the following year of age. In birth history 3, the childbearing phase starts much earlier, at the age of 25 and lasts until the age of 43, when the eighth and last child was born. Birth history 4 refers to a woman who started early with a first child at age 24 and who also stopped early by having her third and last child when she was 28 years old.
Figure 2: Four examples of childbearing trajectories
birth history 1
birth history 2
birth history 3
birth history 4
age 15 16 17 18 19 20 21 22 23 24 25 26 27 28 29 30 31 32 33 34 35 36 37 38 39 40 41 42 43 44 45
no children 4 children ever born
1 child ever born 5 children ever born
2 children ever born 6 and more children ever born
5.2.2 Independent variables
Spousal age difference. We base our measure of gender relations on spousal age differences, one of the few indicators of gender relations, which are generally quantifiable and comparable across time, space, and social group. Following previous research we constructed nominal categories to distinguish between the different types of age gaps: spouses of more or less equal age (allowing 2 years older or younger), grooms 3 to 6 years older, grooms 7 or more years older, brides 3 to 6 years older, and brides 7 or more years older. These categories were constructed for the couple, the bride’s parents, the bride’s siblings, and the bride’s community of origin. Social connections were traced along only the bride’s line because brides were central in the construction of the birth histories. Moreover, information on grooms’ family members and communities of origin were missing for 3,000 cases because these family members were already dead and/or these grooms came from municipalities outside of Zeeland. As can be seen in Table 1, the data shows clear generational differences, with siblings having a similar distribution of spousal-age-difference categories as the couple, while in the parental generation a higher prevalence of marriages with older husbands were found.
Groom’s and bride’s ages. Because the size of the spousal age gap may be related to age at marriage, we controlled for the groom’s and bride’s marriage age, including four categories: groom/bride <24 years old, groom/bride 24 to 26 years old, groom/bride 27 to 29 years old, groom/bride 30 years or older.
Birth cohort. Dummies for six (in general one decade long) birth cohorts were included, with the cohort 1820‒1829, for example referring to individuals born between 1820 and 1829, the latter year included. Clearly, the oldest birth cohort contains the smallest number of cases.
Urbanisation. Furthermore, birth places were classified as urban or rural on the basis of the historical designation of the municipality as a town. As can be seen in Table 1, the sample consists for 88% of couples living in the countryside. Among the urban places were fairly large cities such as Middelburg and Vlissingen and somewhat smaller towns that primarily fulfilled a regional function in terms of trade, industry, and administration, like Goes, or that had been given legal rights as a town, like Veere.
fishermen, (4) unskilled workers, and (5) farmworkers. In Zeeland, more than half of all individuals belonged to the farmworkers class, 20% were skilled workers, and 10% were farmers.
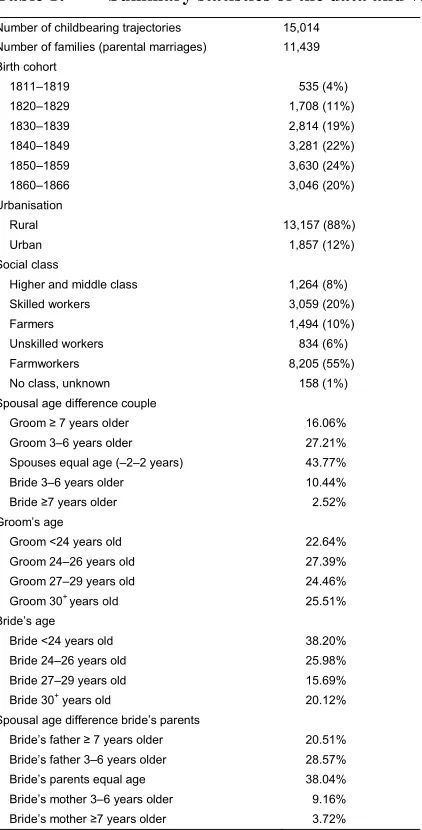
Table 1: Summary statistics of the data and variables used
Number of childbearing trajectories 15,014 Number of families (parental marriages) 11,439 Birth cohort
1811–1819 535 (4%)
1820–1829 1,708 (11%)
1830–1839 2,814 (19%)
1840–1849 3,281 (22%)
1850–1859 3,630 (24%)
1860–1866 3,046 (20%)
Urbanisation
Rural 13,157 (88%)
Urban 1,857 (12%)
Social class
Higher and middle class 1,264 (8%)
Skilled workers 3,059 (20%)
Farmers 1,494 (10%)
Unskilled workers 834 (6%)
Farmworkers 8,205 (55%)
No class, unknown 158 (1%)
Spousal age difference couple
Groom ≥ 7 years older 16.06%
Groom 3–6 years older 27.21%
Spouses equal age (–2–2 years) 43.77%
Bride 3–6 years older 10.44%
Bride ≥7 years older 2.52%
Groom’s age
Groom <24 years old 22.64%
Groom 24–26 years old 27.39%
Groom 27–29 years old 24.46%
Groom 30+years old 25.51%
Bride’s age
Bride <24 years old 38.20%
Bride 24–26 years old 25.98%
Bride 27–29 years old 15.69%
Bride 30+ years old 20.12%
Spousal age difference bride’s parents
Bride’s father ≥ 7 years older 20.51% Bride’s father 3–6 years older 28.57%
Bride’s parents equal age 38.04%
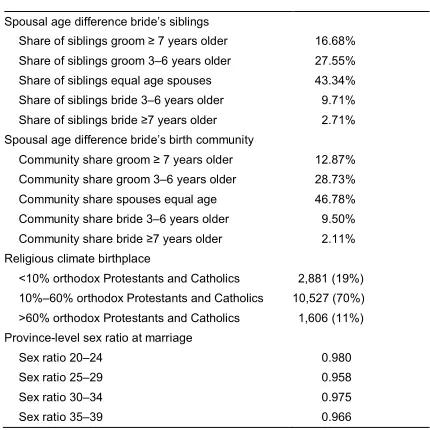
Table 1: (Continued)
Spousal age difference bride’s siblings
Share of siblings groom ≥ 7 years older 16.68% Share of siblings groom 3–6 years older 27.55% Share of siblings equal age spouses 43.34% Share of siblings bride 3–6 years older 9.71% Share of siblings bride ≥7 years older 2.71% Spousal age difference bride’s birth community
Community share groom ≥ 7 years older 12.87% Community share groom 3–6 years older 28.73% Community share spouses equal age 46.78% Community share bride 3–6 years older 9.50% Community share bride ≥7 years older 2.11% Religious climate birthplace
<10% orthodox Protestants and Catholics 2,881 (19%) 10%–60% orthodox Protestants and Catholics 10,527 (70%) >60% orthodox Protestants and Catholics 1,606 (11%) Province-level sex ratio at marriage
Sex ratio 20–24 0.980
Sex ratio 25–29 0.958
Sex ratio 30–34 0.975
Sex ratio 35–39 0.966
Source: GENLIAS_2010_01_Siblings.
Religious climate. Unfortunately we do not have the religious denomination of the wife and husband. In order to control for religious differences in childbearing trajectories, we used the religious climate in the wife’s birthplace as a proxy. This variable is based on two indicators: (1) the proportion of Catholics in the community in 1849 and (2) the proportion of eligible voters for the main orthodox Calvinist party for the municipal and provincial elections in 1935 (1935 being the first year when it was possible to chart voters for this party) (Knippenberg 2003). Although the year in which electoral support was measured lies outside our period of study, these election results largely reflect the religious landscape of Zeeland back in the 19th century.
5.3 Methods
In order to assess the impact of these factors on childbearing trajectories, we estimated multivariate binomial and multinomial logistic regressions predicting (sequence) cluster membership as a function of the independent variables. Although implying a certain loss of information, cluster analysis has often been used to split state sequences into meaningful categories that can then be used as dependent variables in regression models (Barbiano di Belgiojose and Terzera 2018; Fulda 2016; Madero-Cabib 2015). Specifically, we estimated a binomial logistic regression, modelling the probability that a woman’s reproductive trajectory belongs to the stopping trajectory in comparison to all other trajectories. Moreover, using multinomial logistic regressions we estimated the odds of belonging to the Stoppers trajectory versus each of the other pathways separately. In order to account for the multilevel structure of our sample (individuals nested in families and in communities), we computed robust standard errors for two-dimensionally clustered observations using proc surveylogistic in SAS.
6. Results
6.1 Descriptive statistics
6.1.1 Spousal age differences
One of the goals of our study is to understand the association of spousal age differences and reproductive careers. But to what extent did Zeeland brides and grooms differ in age and how did spousal age gaps change during the 19th century? Table 2 shows that almost 44% of all couples were of approximately the same age (allowing 2 years younger or older). In 27% of all unions, husbands were 3 to 6 years older than their wives, while in 16% of all marriages husbands were more than 7 years older than their wives. Only 10% of the sample consisted of couples of which the wife was 3 to 6 years older, while in 3% of all unions the bride was 7 or more years older than her husband. This indicates that despite social norms of marital age homogamy, there was quite some variation in the age differences between the spouses (see also Bras and Suanet 2018).
Table 2: Spousal age gaps in Zeeland (the Netherlands), by birth cohort
Age gap spouses
Birth cohort G 7+y older G 3–6y older Equal (–2–2y) B 3–6y older B 7+y older Total
All cohorts 16.1% 27.2% 43.8% 10.4% 2.5% 15,014
1811–1819 0.7% 20.7% 51.0% 19.4% 8.0% 535
1820–1829 14.3% 27.8% 41.2% 12.6% 4.2% 1,708
1830–1839 17.0% 26.8% 41.9% 11.4% 2.9% 2,814
1840–1849 19.0% 27.9% 41.2% 9.8% 2.0% 3,281
1850–1859 17.5% 27.5% 43.6% 9.3% 2.0% 3,630
1860–1866 14.0% 27.2% 48.6% 8.8% 1.4% 3,046
Total 2,411 4,086 6,571 1,568 378 15,014
Source: GENLIAS_2010_01_Siblings.
6.1.2 Childbearing trajectories
Our dependent variable entails women’s childbearing trajectories. Following a holistic approach often put forward by scholars of life course studies and inspired by earlier studies (Bras, Liefbroer, and Elzinga 2010; Schumacher, Matthijs, and Moreels 2013), we define three main phases of the reproductive life course. The starting or silent phase is defined as the interval between entry into the reproductive age (15 years) and the first birth. The reproductive phase comprises the period of successive childbearing, whereas the stopping phase is the (potentially reproductive) period between the last birth and entry into definitive sterility (age 45). Within the reproductive phase we further distinguish between subsequent child births (1 to 6 and more). This particular definition of the reproductive life course allows us to classify couples according to three different strategies employed in the 19th century to limit family size: starting, spacing, and stopping (Knodel 1987).
Inspired by Studer and Ritschard (2016) we used pair-wise OM distances between reproductive life courses to cluster the trajectories using the PAM (partitioning around medoid) algorithm, where silhouette widths were used for quality assessment. A five-cluster solution (average silhouette width = 0.4) was retained, dividing couples between Stoppers, Late Starters, Almost Childless, and Traditional Behaviours (with or without a certain amount of spacing) (see Figure 3).
more traditional trajectories. As we have described elsewhere, a trajectory with early childbearing and family formation became the new standard trajectory to adulthood between the late 19th century and the first half of the 20th century (Bras, Liefbroer, and Elzinga 2010).
In contrast, all other trajectories have a much longer reproductive phase. The Traditional 1 trajectory has a very short starting phase – women in this cluster marry on average when they are 21.5 years old. Most striking is the extremely long reproductive phase and the very short stopping phase. Hence, it is not surprising that the completed fertility of these women is very high (i.e., 10.5 children on average). The Traditional 2 pathway differs from the Traditional 1 trajectory in that women start childbearing more than three years later (average age at marriage is 24.9), space their births more, and stop reproducing earlier (have a longer stopping phase). However, Traditional 2 can still be considered a traditional pre-transition trajectory as completed fertility with on average 7.2 births per woman is still very high. This trajectory makes up the biggest share of women.
The next cluster is that of Late Starters, women who married and started childbearing at a very late age (on average around 30.8 years old) and who have, as a consequence, on average (only) 3.8 children. Late starting can be seen as a sign of either traditional or modern behaviour. When interpreted from the perspective of the West-European marriage pattern, late starting may result from the inability to set up a household according to one’s own standing and lifestyle. However, it may also express a conscious strategy to reduce family size (Knodel 1988). A fifth cluster, which we named Almost Childless, contains women who remained childless or who had only one or two births at a very late age.
Figure 3: Types of childbearing trajectories (transversal state distribution per
cluster)
Figure 3: (Continued)
Traditional 2 : 4,502 couples Late starters : 2,372 couples
Almost childless : 1997 couples
Figure 4: Length (in months) of different phases in childbearing trajectories, by birth cohort (N = 15,014)
To what extent did the prevalence of the trajectory characterised by early stopping increase over the successive cohorts? Figure 5 depicts for each birth cohort the percentage of women who experienced the different trajectories. The figure indeed shows that the Stoppers trajectory became more important over time. Whereas only 12% of all women in the oldest cohort experienced this pathway, a quarter of all women in the youngest cohort stopped early. However, at the same time, the high-fertility trajectory Traditional 1 did not decline significantly. On the contrary, we initially observe a relative increase among women in the later cohorts who followed this trajectory. It’s only in the last observed cohort (1860‒1866) that we see a start of decline. The proportion of women experiencing a Traditional 2 trajectory also increased across birth cohorts, but the 1830‒1839 cohort started to decrease. Hence, for both the Traditional 1 and 2 trajectories we discern a so-called ski-jump pattern of increasing fertility preceding fertility decline (Dyson and Murphy 1985; Van de Walle 1974). Figure 5 also shows that the Late Starters pathway decreased as the fertility transition progressed; 20.7% of all women belonging to the oldest birth cohort experienced this trajectory compared to 13.2% of the youngest cohort. Late starting was thus mostly a traditional way of fertility reduction. The same can be said for the Almost Childless pathway, which slightly decreased across cohorts as well, constituting 17.2% of all women in the oldest cohort and 12.6% in the youngest cohort. Given this decrease,
0 2 4 6 8 10 12 14 16 18
having no or only a few children most likely did not result from active fertility limitation but may have been a result of women’s or men’s reduced fecundity.
Figure 5: Percentage of women experiencing different reproductive
trajectories, by birth cohort (N = 15,014).
6.2 Determinants of childbearing trajectories
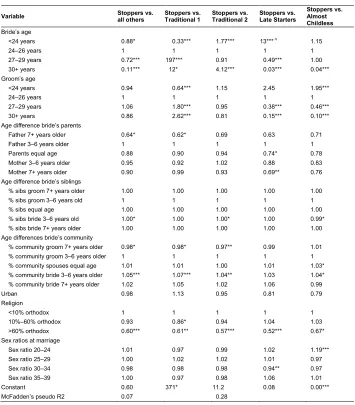
To examine whether couples with small age differences, signifying more equal gender relations, more often followed a ‘modern’ stopping trajectory, or whether other characteristics played a more important role, we conducted two types of multivariate analyses. First, we performed a binomial logistic regression to provide a broad overview of which characteristics distinguished those who followed the Stoppers trajectory from all others. Next, we conducted a multinomial logistic regression to understand what attributes differentiated Stoppers from couples following each of the other trajectories. Results of both analyses are presented in Table 3.
comparison to the Traditional 2 pathway, a finding which confirms the ski-jump pattern of the Traditional 2 trajectory found in Figure 5. Furthermore, the odds of following a Stoppers trajectory compared with following the Late Starters trajectory were strongly enhanced for the youngest birth cohort but not for the other cohorts. The odds of practicing stopping in comparison with experiencing an Almost Childless pathway were significantly lower for the three eldest cohorts (1811‒1819, 1820‒1829, and 1830‒
1839) in comparison with the other cohorts.
The results show that couples who followed a Stoppers trajectory distinguished themselves from those experiencing other trajectories in that they were more often from the higher and middle class, skilled workers class, and farmers class. Stopping was a reproductive pathway that was surprisingly often experienced by farmers. As indicated before, in Zeeland this social group (10% of the population) consisted mainly of wealthy gentleman farmers who imitated the lifestyle of the urban middle classes. The multinomial analyses show that the higher and middle classes, skilled workers, and farmers were particularly more prone to follow a Stoppers trajectory rather than the Traditional 1 trajectory. Skilled workers and farmers also had a relatively strong preference for stopping over a Traditional 2 pathway. Farmers had an elevated risk of stopping rather than late starting as well. Finally, the higher and middle classes had decreased odds of stopping in comparison to following an Almost Childless childbearing trajectory.
Our central hypothesis predicted that couples with more egalitarian gender relations (equal-age couples) more often practiced stopping than those in marriages with a husband or wife who was older. The results of our logistic regressions only partly confirm this hypothesis. The binomial regression shows that, in comparison to all others, stoppers did not distinguish themselves specifically from all others by smaller spousal age differences. The multinomial regression does however show that couples with older husbands were less likely to experience a Stoppers rather than a Traditional 1 trajectory. But they more often followed a Stoppers rather than a Traditional 2, Late Starters, or Almost Childless pathway. The results also show that couples with older wives had decreased odds of practicing stopping in comparison to late starting or remaining almost childless. But women who were the older one in their unions had higher odds of practicing stopping rather than following a Traditional 1 trajectory.
higher odds of practicing stopping rather than following the two traditional pathways. The binomial regression shows that, in comparison to all others, Stoppers did not distinguish themselves by the grooms’ age. According to the multinomial findings, however, men who married young had a reduced risk of practicing stopping in comparison to following a Traditional 1 pathway and an increased risk of stopping rather than remaining almost childless. Men who married at older ages (27 to 29 years and 30 or more years) had elevated odds of practicing stopping rather than experiencing a Traditional 1 trajectory and decreased odds of stopping in comparison to those who started late and remained almost childless.
Following theories on social influences on fertility behaviour, we predicted that the smaller the spousal age differences of parents, siblings, and community members, the higher the likelihood that couples’ childbearing trajectories would be characterised by smaller family size. Overall, we find a number of significant associations that are largely in line with the results for spousal age differences. The binomial regression shows that couples of whom the brides’ parents were in marriages in which the husband was older (father was 7 or more years older) had smaller odds of practicing stopping in comparison to all other trajectories. The multinomial regression shows that this is mainly the result of a reduced risk of stopping at the expense of a Traditional 1 trajectory. Brides with same-aged parents or parents in marriages in which the wife was older (mother was 7 or more years older) had a lower likelihood of stopping rather than late starting.
Sibling effects are less prevalent. The binomial regression shows that the higher the share of siblings in unions where the bride is 3 to 6 years older, the greater couples’ odds are of stopping rather than experiencing all other trajectories. The multinomial regression shows that this is due to a heightened likelihood of stopping versus following a Traditional 2 trajectory. Conversely, with a higher percentage of siblings in marriages with older brides, couples had a lower risk of stopping rather than remaining childless.
The results for community-level spousal age gaps replicate some of the parental and sibling effects. Brides from communities with higher percentages of unions with older husbands (grooms were 7 or more years older) had decreased odds of stopping, while brides from localities with a higher share of marriages with older wives (wives were 3 to 6 years older) had an increased likelihood of stopping versus all other trajectories. The multinomial results show that the decreased odds of stopping of brides from localities where the husbands were older occurred mainly at the expense of the Traditional 1 and Traditional 2 reproductive pathways. The increased likelihood of stopping of brides from communities where wives tended to be older happened at the expense of the Traditional 1, Traditional 2, and Almost Childless trajectories.
between brides born in urban compared to rural areas in opting for specific reproductive careers, most likely because social class already captures the largest part of the urban-rural differential in fertility. Those living in very religious communities with more than 60% orthodox Protestants had decreased odds of stopping rather than following one of the other trajectories. The results of the multinomial regression point out that this held true also for stopping versus each of the pathways separately. Those living in communities with 10% to 60% orthodox Protestants had decreased the odds of following a Stoppers rather than a Traditional 1 trajectory as well. Provincial sex ratios at marriage were not significantly related with the odds of a Stoppers trajectory rather than all other pathways. However, the findings of the multinomial regression show that the higher the sex ratio in the age group 30 to 34 years old, the lower was the chance of women experiencing a Stoppers versus a Late Starters trajectory. High sex ratios in the age category 20 to 24 years were associated with elevated odds of stopping rather than remaining almost childless.
Table 3: Results of binomial and multinomial logistic regression analyses of
the determinants of childbearing trajectories: Odds ratios (N = 15,014)
Variable Stoppers vs.all others Stoppers vs.Traditional 1 Stoppers vs.Traditional 2 Stoppers vs.Late Starters
Stoppers vs. Almost Childless
Birth cohort
1811–1819 0.70* 0.46*** 0.72 0.89 0.47**
1820–1829 0.70* 0.62** 0.74 0.72 0.38***
1830–1839 0.77* 0.72* 0.71** 0.76 0.68*
1840–1849 0.96 0.91 0.94 0.78* 0.96
1850–1859 (ref.) 1 1 1 1 1
1860–1866 1.27** 1.27* 1.17 1.38*** 1.23
Social class
Higher/middle class 1.19* 1.41** 1.19 1.12 0.73*
Skilled workers 1.17* 1.30*** 1.14* 1.10 0.85
Farmers 1.61*** 1.92*** 1.58*** 1.42** 1.06
Unskilled workers 0.92 0.97 0.87 0.81 0.91
Farmworkers 1 1 1 1 1
No class/unknown 1.50 1.57 1.68 3.32** 0.89
Spousal age differences
Groom 7+ years older 1.23 0.46*** 1.49** 4.84*** 4.26***
Groom 3–6 years older 1.01 0.68*** 1.21* 2.59*** 2.47***
Spouses equal age 1 1 1 1 1
Bride 3–6 years older 1.16 1.49* 0.95 0.43*** 0.56***
Table 3: (Continued)
Variable Stoppers vs.all others Stoppers vs.Traditional 1 Stoppers vs.Traditional 2 Stoppers vs.Late Starters Stoppers vs.Almost Childless
Bride’s age
<24 years 0.88* 0.33*** 1.77*** 13*** n 1.15
24–26 years 1 1 1 1 1
27–29 years 0.72*** 197*** 0.91 0.49*** 1.00
30+ years 0.11*** 12* 4.12*** 0.03*** 0.04***
Groom’s age
<24 years 0.94 0.64*** 1.15 2.45 1.95***
24–26 years 1 1 1 1 1
27–29 years 1.06 1.80*** 0.95 0.38*** 0.46***
30+ years 0.86 2.62*** 0.81 0.15*** 0.10***
Age difference bride’s parents
Father 7+ years older 0.64* 0.62* 0.69 0.63 0.71
Father 3–6 years older 1 1 1 1 1
Parents equal age 0.88 0.90 0.94 0.74* 0.78
Mother 3–6 years older 0.95 0.92 1.02 0.88 0.83
Mother 7+ years older 0.90 0.99 0.93 0.69** 0.76
Age difference bride’s siblings
% sibs groom 7+ years older 1.00 1.00 1.00 1.00 1.00
% sibs groom 3–6 years old 1 1 1 1 1
% sibs equal age 1.00 1.00 1.00 1.00 1.00
% sibs bride 3–6 years old 1.00* 1.00 1.00* 1.00 0.99*
% sibs bride 7+ years older 1.00 1.00 1.00 1.00 1.00
Age differences bride’s community
% community groom 7+ years older 0.98* 0.98* 0.97** 0.99 1.01
% community groom 3–6 years older 1 1 1 1 1
% community spouses equal age 1.01 1.01 1.00 1.01 1.03*
% community bride 3–6 years older 1.05*** 1.07*** 1.04** 1.03 1.04*
% community bride 7+ years older 1.02 1.05 1.02 1.06 0.99
Urban 0.98 1.13 0.95 0.81 0.79
Religion
<10% orthodox 1 1 1 1 1
10%–60% orthodox 0.93 0.86* 0.94 1.04 1.03
>60% orthodox 0.60*** 0.61** 0.57*** 0.52*** 0.67*
Sex ratios at marriage
Sex ratio 20–24 1.01 0.97 0.99 1.02 1.19***
Sex ratio 25–29 1.00 1.02 1.02 1.01 0.97
Sex ratio 30–34 0.98 0.98 0.98 0.94** 0.97
Sex ratio 35–39 1.00 0.97 0.98 1.06 1.01
Constant 0.60 371* 11.2 0.08 0.00***
McFadden’s pseudo R2 0.07 0.28
Source: GENLIAS_2010_01_Siblings.
7. Conclusion and discussion
Two central questions guided this study. First of all, we asked ourselves to what extent new light could be shed on the long-standing and unresolved debate on stopping versus spacing by applying a sequence analysis approach to chart changes in childbearing trajectories in a European society undergoing fertility decline. The second question was whether there was an association between changing gender relations and declining fertility during the historical fertility transition. On the basis of our analyses of the GENLIAS data, we can now answer these questions.
First, we expected the reproductive phase of childbearing trajectories to become shorter over time and result in fewer children. This hypothesis was supported by our data. On the basis of the cluster analysis we identified five types of often-experienced trajectories: two high-fertility traditional trajectories (differing in the length of the reproductive phase), a Stoppers trajectory, a Late Starters trajectory, and an Almost Childless trajectory. Our data shows that over consecutive cohorts the prevalence of women experiencing a trajectory of early stopping and completed fertility of around 3 children increased. However, besides the rise of parity-dependent family limitation, the Traditional 1 trajectory characterised by early starting and late stopping with on average more than 10 children per woman and the Traditional 2 trajectory characterised by women relatively postponing the first birth and spacing more between births, but still bearing on average more than 7 children, remained highly prevalent trajectories among all cohorts of women (1811‒1866) studied in this article. Conversely, Late Starters and Almost Childless trajectories were on the decline; they were associated with the traditional West-European marriage pattern. In summary, we find that while stopping increased over time, the incidence of high fertility reproductive pathways remained largely the same for the cohorts studied here.
results found at the couple level. Nevertheless, gender relations at the couple level were most strongly related to women’s childbearing trajectories.
The likelihood of practicing parity-dependent family limitation turned out to be most clearly linked to birth cohort and social class. Stopping was a trajectory that gradually gained significance among cohorts of women born as of 1850. In particular, women from the group of rich gentlemen farmers, the higher and middle classes, and the skilled workers, the latter two groups being predominantly located in the towns, were the forerunners of stopping in Zeeland. Instead of following their traditionally class-based trajectories of late childbearing or remaining (almost) childless, these social groups now increasingly turned to a new reproductive pathway: that of marrying early (indeed, much earlier than was common before), starting childbearing early, and also stopping early, thus limiting their families to around three children. During our study period, the two traditionally high-fertility reproductive pathways were followed mainly by the mass of farmworkers (55% of the sample) and the unskilled workers (6%). Our results regarding class differences in stopping trajectories confirm and supplement the results of an earlier study on the standardisation of trajectories to adulthood among cohorts born between 1850 and 1900 in the Netherlands. There we also found that farmers’ daughters were the forerunners of a standard trajectory to adulthood marked by early family formation (Bras, Liefbroer, and Elzinga 2010). Our results confirm this finding and extend it further into the reproductive life course: these women did not only marry early but also stopped childbearing early.
Our study has a number of limitations. A first constraint is our indicator of gender relations (i.e., the age difference between the spouses). Spousal age differences may not only reflect gender relations but may also result from demographic constraints and marriage market conditions. Although we controlled for the age-sex structure of Zeeland province and for the marriage ages of the bride and groom in our multivariate analyses, specific age-sex structures in particular communities may still explain part of our results. Moreover, the spousal age gap measures only initial gender relations (at the moment of marriage). Although this is meaningful by itself ‒ research in contemporary developing countries has found independent and significant effects of women’s initial empowerment conditions on their ensuing reproductive trajectories (Lee-Rife 2010) – a more dynamic proxy, charting gender relations over the life course, would have been better. And last but not least, age differences are likely not the only, or the best, indicator of romantic or intimate spousal relations.
Second, since we study only the reproductive trajectories of women who were born and died in Zeeland, and whose husbands, parents, and siblings remained their whole lives in Zeeland, too, our analytical sample is quite selected and biased towards a sedentary, mostly rural-based population. Most likely, a part of the more modern couples, displaying egalitarian gender relations and stopping behaviour, may have migrated to urban areas elsewhere. Had we followed Zeeland-born couples also outside the province in the urbanised provinces of South-Holland and North-Holland, we may have found more conclusive support for the association between egalitarian spousal relations and reproductive trajectories characterised by stopping. Third, with the data available to us (covering the period 1811‒1911) we could study only a relatively short period (about 30 years) since the onset of the fertility transition in Zeeland. In order to assess more fully whether changes in spousal relations were associated with earlier stopping, our window of observation should be extended further into the 20th century.
8. Acknowledgments
References
Abadian, S. (1996). Women’s autonomy and its impact on fertility.World Development
24(12): 1793–1809.doi:10.1016/S0305-750X(96)00075-7.
Anderton, D.L. and Bean, L.L. (1985). Birth spacing and fertility limitation: A behavioral analysis of a nineteenth century frontier population. Demography
22(2): 169–183.doi:10.2307/2061176.
Atkinson, M.P. and Glass, B.L. (1985). Marital age heterogamy and homogamy, 1900 to 1980. Journal of Marriage and the Family 47(3): 685–700. doi:10.2307/35 2269.
Balk, D. (1994). Individual and community aspects of women’s status and fertility in rural Bangladesh. Population Studies 48(1): 21–45. doi:10.1080/003247203100 0147456.
Barbiano di Belgiojose, E. and Terzera L. (2018). Family reunification: Who, when, and how? Family trajectories among migrants in Italy. Demographic Research
38(28): 737–772.doi:10.4054/DemRes.2018.38.28.
Barbieri, M. and Hertrich, V. (2005). Age difference between spouses and contraceptive practice in sub-Saharan Africa. Population 60(5): 671–654. doi:10.3917/pope. 505.0617.
Bates, L.M., Maselko, J., and Schuler, S.R. (2007). Women’s education and the timing of marriage and childbearing in the next generation: Evidence from rural Bangladesh. Studies in Family Planning 38(2): 101–112. doi:10.1111/j.1728-4465.2007.00121.x.
Benefo, K.D. (1995). The determinants of the duration of postpartum sexual abstinence in West Africa: A multilevel analysis. Demography 32(2): 139–157.
doi:10.2307/2061737.
Bernardi, L. (2003). Channels of social influence on reproduction.Population Research and Policy Review(5–6): 427–455.doi:10.1023/B:POPU.0000020892.15221.44.
Bernardi, L. and Klärner, A. (2014). Social networks and fertility. Demographic Research 30(22): 641–670.doi:10.4054/DemRes.2014.30.22.
Birg, H., Flöthmann E.J., and Reiter, I. (1991). Biographische Theorie der demographischen Reproduktion. Frankfurt: Campus Verlag.
Bongaarts, J. and Potter, R.J. (1983)Fertility biology and behavior: An analysis of the proximate determinants of fertility. New York: Academic Press.
Bongaarts, J. and Watkins, S.C. (1996). Social interactions and contemporary fertility transitions. Population and Development Review 22(4): 639–682. doi:10.2307/ 2137804.
Bras, H. (2014). Structural and diffusion effects in the Dutch fertility transition, 1870‒
1940.Demographic Research 30(5): 151‒186.doi:10.4054/DemRes.2014.30.5. Bras, H. and Kok, J. (2005). ‘They live in indifference together’: Marriage mobility in
Zeeland, The Netherlands, 1796‒1922.International Review of Social History
50(Supplement): 247‒274.
Bras, H., Liefbroer, A.C., and Elzinga, C.H. (2010). Standardization of pathways to adulthood? An analysis of Dutch cohorts born between 1850 and 1900.
Demography 47(4): 1013‒1034.doi:10.1007/BF03213737.
Bras, H. and Suanet, B. (2018). Family systems and spousal age differences in nineteenth and early twentieth century Netherlands. In: Puschmann, P. and Riswick, T. (eds.). Building bridges: Scholars, history and historical demography. A Festschrift in Honor of Professor Theo Engelen. Nijmegen: Valkhof Pers: 421‒446.
Cain, M. (1993). Patriarchal structure and demographic change. In: Federici, N., Mason, K.O., and Sogner, S. (eds.).Women’s position and demographic change. Oxford: Clarendon Press: 43‒60.
Carmichael, S. (2011). Marriage and power: Age at first marriage and spousal age gap in lesser developed countries. The History of the Family 16(4): 416–436.
doi:10.1016/j.hisfam.2011.08.002.
Carmichael, S., De Moor, T., and Van Zanden, J.L. (2011). ‘When the heart is baked, don’t try to knead it’: Marriage age and spousal age gap as a measure of female ‘agency’. Utrecht: Center for Global Economic History (CGEH Working Paper Series 19).
Casterline, J.B., Williams, L., and McDonald, P. (1986). The age difference between spouses: Variations among developing countries.Population Studies 40(3): 353– 374.doi:10.1080/0032472031000142296.
Cleland, J. (2001). Potatoes and pills: An overview of innovation-diffusion contributions to explanations of fertility decline. In: Casterline, J.B. (ed.).
Diffusion processes and fertility transition: Selected perspectives. Washington, D.C.: National Academy Press: 39–65.
Coontz, S. (2005). Marriage, a history. How love conquered marriage. New York: Viking Press.
Darak, S., Mills, M, Kulkarni, V., Kulkarni, S., Hutter, I., and F. Janssen (2015). Trajectories of childbearing among HIV infected Indian women: A sequence analysis approach. PLoS ONE 10(4): e0124537. doi:10.1371/journal.pone.0124 537.
De Regt, A. (2004). Children in the 20th-century family economy: From co-providers to consumers. The History of the Family 9(4): 371–384.doi:10.1016/j.hisfam.2003. 01.003.
DeRose, L.F. and Ezeh, A.C. (2010). Decision-making patterns and contraceptive use: Evidence from Uganda. Population Research and Policy Review 29(3): 423– 439.doi:10.1007/s11113-009-9151-8.
Duncan, S. and Smith, D. (2002). Geographies of family formations: spatial differences and gender cultures in Britain. Transactions of the Institute of British Geographers 27(4):471–493.doi:10.1111/1475-5661.00066.
Dyson, T., and Murphy, M. (1985). The onset of fertility transition. Population and Development Review11(3): 399–440.doi:10.2307/1973246.
Easterlin, R.A. (1978). The economics and sociology of fertility: A synthesis. In: Tilly, C. (ed.).Historical studies of changing fertility. Princeton: Princeton University Press: 57–134.
Easterlin, R.A., and E. Crimmins (1985). The fertility revolution: A supply‒demand analysis. Chicago: University of Chicago Press.
Engelen, T. and Kok, J. (2003). Permanent celibacy and late marriage in the Netherlands, 1890-1960.Population 58(1): 67‒96.doi:10.3917/pope.301.0067.
Feng, W., Lee, J.Z., Tsuya, N.O., Kurosu, S., Oris, M., Dribe, M., and Manfredini, M. (2010). Household organization, co-resident kin, and reproduction. In: Tsuya, N.O., Feng, W., Alter, G., and Lee, J.Z. (eds.). Prudence and pressure: Reproduction and human agency in Europe and Asia, 1700‒1900. Cambridge, MA: The MIT Press: 67‒95.
Fisher, K. (2000). ‘She was quite satisfied with the arrangements I made’: Gender and birth control in Britain 1920‒1950. Past and Present 169(1): 161‒193.
doi:10.1093/past/169.1.161.
Fisher, K. (2006).Birth control, sex and marriage in Britain, 1918–1960. New York: Oxford University Press.doi:10.1093/acprof:oso/9780199267361.001.0001. Fisher, K. and Szreter, S. (2003). They prefer withdrawal: The choice of birth control in
Britain, 1918–1950. Journal of Interdisciplinary History 34(2): 263–291.
doi:10.1162/002219503322649507.
Fisher, K. and Szreter, S. (2010). Sex before the sexual revolution: Intimate life in England 1918–1963. Cambridge: Cambridge University Press.
Folbre, N. (1983). Of patriarchy born: The political economy of fertility decisions.
Feminist Studies 9(2): 261–283.doi:10.2307/3177490.
Folbre, N. (1994). Who pays for the kids? Gender and the structures of constraints.
New York: Routledge.doi:10.4324/9780203168295.
Franken, T. and Adriaanse, L. (2004).Op stoom! Industrieel erfgoed in Zeeland (1850– 1970). Middelburg: Provincie Zeeland.
Fulda, B.E. (2016). The diversity in longitudinal partnership trajectories during the transition to adulthood: How is it related to individual characteristics and regional living conditions? Demographic Research 35(37): 1101–1134.
doi:10.4054/DemRes.2016.35.37.
Gabadinho, A., Ritschard, G., Müller, N.S., and Studer, M. (2011). Analyzing and visualizing state sequences in R with TraMineR.Journal of Statistical Software
40(4): 1–37.doi:10.18637/jss.v040.i04.
Gittins, D. (1992). Fair sex: Family size and structure 1900–1939. London: Hutchinson.
Greenhalgh, S. (1995). Anthropology theorizes reproduction: Integrating practice, political economic, and feminist perspectives. In: Greenhalgh, S. (ed.).Situating fertility: Anthropology and demographic inquiry. Cambridge: Cambridge University Press: 3–28.doi:10.1017/CBO9780511621611.002.
Hilevych, Y. (2015). Abortion and gender relationships in Ukraine, 1955–1970. The History of the Family 20(1): 86–105.doi:10.1080/1081602X.2014.996913.
Hilevych, Y. (2016). Strong families and declining fertility: A comparative study of family relations and reproductive careers in Soviet Ukraine [PhD thesis]. Wageningen: Wageningen University and Research, Faculty of Social Sciences. Hofstee, E.W. (1981).Korte demografische geschiedenis van Nederland van 1800 tot
heden [Short demographic history of the Netherlands from 1800 to the present]. Haarlem: Fibula-Van Dishoeck.
Hollerbach, P.E. (1980). Power in families, communication, and fertility decision-making.Population and Environment 3(2): 146–173.doi:10.1007/BF01254155.
Humphries, J. (2007). ‘Because they are too menny...’ Children, mothers and fertility decline: The evidence from working-class autobiographies of the eighteenth and nineteenth centuries. In: Janssens, A. (ed.).Gendering the fertility decline in the western world. Bern: Peter Lang: 113–150.
Jansen, M. (1989). Ik was niet de enige vrouw: Zeeuwse landarbeidsters in de tweede helft van de negentiende eeuw. In: Backerra, F. (ed.). Vrouwen van het land: Anderhalve eeuw plattelandsvrouwen in Nederland. Zutphen: De Walburg Pers: 15–27.
Janssens, A. (2007a). ‘Were women present at the demographic transition?’ A question revisited. The History of the Family 12(1): 43–49. doi:10.1016/j.hisfam.2007. 05.003.
Janssens, A. (2007b). Gendering the fertility decline in the western world. In: Janssens, A. (ed.).Gendering the fertility decline in the western world. Bern: Peter Lang: 1–23.
Kaufman, L. and Rousseeuw, P.J. (1990).Finding groups in data: An introduction to cluster analysis. New York: Wiley.doi:10.1002/9780470316801.
Kloek, E. (2009). Vrouw des huizes: Een cultuurgeschiedenis van de Hollandse huisvrouw. Amsterdam: Balans.
Knippenberg, H. (2003). Van verzuilde naar zwevende kiezers: De politieke kaart in de negentiende en twintigste eeuw. In: Beekink, E., Boonstra, O., Engelen, T., and Knippenberg, H. (eds.). Nederland in verandering: Maatschappelijke veranderingen in kaart gebracht 1800–2000. Amsterdam: Aksant: 123–152. Knodel, J. (1987). Starting, stopping, and spacing during the early stages of fertility
transition: The experience of German village populations in the 18th and 19th centuries.Demography 24(2): 143–162.doi:10.2307/2061627.
Knodel, J. (1988). Demographic behavior in the past: A study of fourteen German village populations in the eighteenth and nineteenth centuries. Cambridge: Cambridge University Press.doi:10.1017/CBO9780511523403.
Knodel, J. and Van de Walle, E. (1979). Lessons from the past: Policy implications of historical fertility studies.Population and Development Review 5(2): 217‒245. Kok, J. (1998). ‘Vrijt daar je zijt’: Huwelijk en partnerkeuze in Zeeland tussen 1830 en
1950. Zeeland: Tijdschrift van het Koninklijk Zeeuwsch genootschap der wetenschappen 7(3): 131–143.
Lee-Rife, S.M. (2010). Women’s empowerment and reproductive experiences over the life course. Social Science and Medicine 71(3): 634–642. doi:10.1016/j.socsci med.2010.04.019.
Lyngstad, T.H. and Prskawetz, A. (2010). Do siblings’ fertility decisions influence each other?Demography 47(4): 923–934.doi:10.1007/BF03213733.
MacKinnon, A. (1995). Were women present at the demographic transition? Questions from a feminist historian to historical demographers.Gender and History 7(2): 222–240.doi:10.1111/j.1468-0424.1995.tb00022.x.
MacKinnon, A., Batson, C., and Petersen-Gray, J. (2007). ‘...But I’m so embarrassed, I said, if it’s another baby!’: Schooling, girls and declining fertility in urban South Australia in the late nineteenth and early twentieth century. In: Janssens, A. (ed.). Gendering the fertility decline in the western world. Bern: Peter Lang: 205–235.