Iranian Journal of Fisheries Sciences 10(4) 689-707 2011
Implementation of Value Engineering for strategy formulation
(Case study: Fisheries sector)
Mostafaeipour A.
1*; Mortazavi M.
2; Sadra-Abarghouei N.
3Received: September 2010 Accepted: January 2011
Abstract
This paper analyzes the results of implementing Value Engineering (VE) into SWOT methodology undertaken in Yazd province of Iran. This is the first time that these techniques have been undertaken for fisheries sector in Iran. The study mainly aims at applying Value Engineering and SWOT techniques to achieve the best out of decision-making, and also of management issues as a whole, through the consideration of creative ideas for improvement. The analyses use scientific trawl data and standardized analysis techniques. Based upon the analysis of fisheries issues, findings indicate that the optimized policy is to introduce new sea food chain restaurants into the studied province. Moreover, other suggestions could be as follows: advertising and good standard packaging for export, building facilities for processing and refrigeration by investors, producing Salmon for export in good packaging, producing crabs and other new species, encouraging people to consume more fish, paying great attention to research works, government supporting for transportation, loan, and subsidies, and finally encouraging investors.
Keywords: Fishery, Value Engineering (VE), SWOT methodology, Strategy, Yazd province, Iran.
_________________________
1- Industrial Engineering Department, Yazd University, Yazd, Iran
2- Institute of Scientific Applied Higher Education of Jahad-e-AgricultureTehran, Iran 3- Institute of Scientific Applied Higher Education of Jahad-e-Agriculture, Yazd, Iran
* Corresponding author’s email: [email protected]
Introduction
Iran is connected to open seas via the Persian Gulf and Hormoz Strait, connecting it to the Oman Sea and Indian Ocean. Iranian fishermen are able to catch fish with 2250 km coastline along the Persian Gulf and Oman Sea. Moreover, there is around 750 km coastline along the Caspian Sea at the north of the country (Fig. 1). While the weather in the south of the Caspian Sea is moderate, humid and usually very pleasant, the weather in the Persian Gulf and Oman Sea coasts are hot, dry, and unfavorable (Pak and Farajzadeh, 2007).
Iran’s lengthy southern coastlines along the Persian Gulf and Sea of Oman are good strategic locations for fisheries. Fish in Yazd province come mainly from two sources – marine and inland. Marine fish come mainly from the Persian Gulf and sea of Oman in south of Iran; however, different inland fishery species provide significant livelihood opportunities for the people of Yazd. Recently, an attempt was made to increase production of inland fish species like
Salmon in some different locations of the
province (Moogouei et al., 2010). The inland fisheries of Yazd operate under complex biological and institutional conditions. Basic mechanisms for managing the fisheries in inland waters had been based on the allocation of fishery rights through ownership of land and wells. The fishers must get permission from Yazd Water Municipality District in order to supply required water, because of the water shortage.
The reality of a fishery system, in its broadest sense, is that of a plexus of
sub-systems. It consists of biophysical, ecological and socio-economic components, along with interconnecting processes, fluxes of matter, energy and information, as well as a range of stocks and controls, that together are responsible for the system’s characteristics and performance, composition, productivity, historical changes, resilience and sustainability (Garcia and Charles, 2008). Fishers’ knowledge can be useful in both biological and management contexts (Scholz et al., 2004; Leslie, 2005). Many governments have subsidized the development of under exploited fisheries (Sumaila and Pauly, 2006; Harte et al., 2008). Government subsidies are recognized as encouraging over-exploitation and overcapitalization of fisheries (OECD, 2005; Harte et al., 2008). The accelerating crises of fisheries management failures have intensified the demands from policymakers on science, precipitating scientists into a vicious circle of partial analyses for short term quick-fixing of management problems, with little time or incentives available for longer-term strategic research (Catanzano and Rey, 1995; Garcia and Charles, 2008).
In its early stages, the development of Yazd fisheries was accelerated by several national fisheries development programs. These programs, which included loans and aid funds from government sources, provided an essential basis for the rapid growth and development of fisheries in province. Later, since recent global economic recession and global climate change have affected Iran, fishery business needs a creative strategy to survive.
Iranian Journal of Fisheries Sciences, 10(4), 2011 691 Therefore, there is much room for further
development of the fishing industry in the province. Some believe a subsidy program to support fishing industry is a good option, but all proposed ideas must be evaluated in order to be implemented. The objective of this study is to implement value engineering and SWOT techniques for fishery development issues for the province of Yazd in Iran to achieve best opinions in fishery issues. Recently, there have been many problems related to fisheries in Iran. Yazd is also one of the provinces in Iran which has suffered too. Yazd province is considered as the case study for this purpose. This study is of great importance as it implemented two different methods in order to suggest the
best ideas for fisheries issues. Conventional research methodologies are often costly, take a longer time to accomplish and require the services of experts. Hence, practitioners are continuously developing applied research methodologies that: (1) are cost-effective; (2) can quickly generate information; (3) maximize the participation of concerned stakeholders; and (4) produce relevant results to managers and politicians (Garces et al., 2010). Hence, we use a different methodology to be more effective and reliable. In order to do this, two different methods of SWOT and VE were used in this work. Field study, implementation and analysis of different phases were also discussed.
Figure 1: Coastline length at the north and south of Iran
Value Engineering
Value engineering (VE) is one way to improve efficiency and seek the best balance between the cost, reliability and performance of a product or service (Fong, 1998). The main emphasis of value engineering is to reduce unnecessary costs,
also improve quality and productivity (Male and Kelly, 2007).
Value Engineering has two primary elements:
Creating functions at a minimum cost.
Considering the opinions of others and avoiding dictatorship by group brainstorming sessions.
Many value engineering recommendations or decisions are borne of necessity involving perhaps the availability of equipment or material, or physical limitations of time and topography.
Value is the main factor key in marketing (Alderson, 1957; Drucker, 1973; Anderson, 1982; Woodruff, 1997; Anderson and Narus, 1999; Doyle, 2000). Clearly, the marketing role is "to assist the firm to create value for its customers that is superior to competition" (Doyle, 2000; Rust et al., 2000).
This is important because customers, who are satisfied with a firm’s goods or services that offer them value, ceteris paribus, remain loyal to that firm and place their future purchases with that firm (Fornell, 1992; Rust and Zahorik, 1993; Scheuing, 1995; Reichheld, 1996; Bolton and Drew, 1999; Eriksson and Lofmarck-Vaghult, 2000). Outstanding studies in this area have been the Profit Impact of Market Strategy (PIMS) research, which examines the relationships between service, quality, and profitability (Chusil, and Downs, 1979; Buzzell and Gale, 1987), as well as synthesis of evidence about the profit consequences of service quality(Zeithaml, 2000).
By implementing Value Analysis, performance would increase and it yields to a lower cost of products. We must consider that implementing this system should not affect the quality. If this effort yields to an acceptable result, then it would be beneficial for all farmers to
implement the new system to their farms (Mostafaeipour et al., 2007).
SWOT Analysis
SWOT Analysis is a strategic planning tool used to evaluate the strengths, weaknesses, opportunities, and threats involved in different fields. It involves specifying the objective of the business venture or project and identifying the internal and external factors that are favorable and unfavorable to achieving that objective.
A SWOT analysis is a technique commonly used to assist in identifying strategic direction for an organization or practice (Ritu, 2006). As an alternative to SWOT, J. Scott Armstrong (1982) describes a 5-step approach alternative that leads to better corporate performance (Armstrong, 1996). Many of the threats are based on weaknesses (Ritu, 2006). It is prudent not to eliminate too quickly any candidate SWOT entry.
The importance of individual SWOTs will be revealed by the value of the strategies it generates. A SWOT item that produces valuable strategies is important. A SWOT item that generates no strategies is not important (Armstrong, 1996; Armstrong, 2006). The SWOT approach involves systematic thinking and comprehensive diagnosis of factors relating to a new product, technology, management, or planning. It is used extensively in strategic planning, where all factors influencing the operational environment are diagnosed with greater detail (Weihrich, 1982; Kotler, 1994; Hill and Westbrook 1997; Smith, 1999; Ram et al., 2004). Specifically, it allows analysts
Iranian Journal of Fisheries Sciences, 10(4), 2011 693 to categorize factors into internal
(strengths, weaknesses) and external (opportunities, threats) as they relate to a decision and thus enables them to compare opportunities and threats with strengths and weaknesses.
If used in combination with analytic hierarchy process, however, SWOT approach can provide a quantitative measure of importance of each factor on decision-making (Saaty, 1993; Kurttila et al., 2000; Ananda and Herath, 2003; Ram et al., 2004). Even if the cost is comparatively low, setting targets to reduce cost of the system can lead to high savings (Mostafaeipour, 2009).
Materials and methods
The data was collected from the city of Yazd where there are fishers who have recently introduced inland fishery. The proposed method includes some steps which are discussed. Brainstorming sessions were provided in order to obtain creative ideas. There were 11 fishery specialists at the brainstorming session which was held in ten days.
The study identified some limitations while conducting the research work. First, a well-defined stakeholder group and their participation in the communication planning process are an essential necessity in developing the communication strategy. To overcome these limitations, the study team used various tools to develop and create new ideas by organizing a brainstorming session to collect the opinions of different participants.
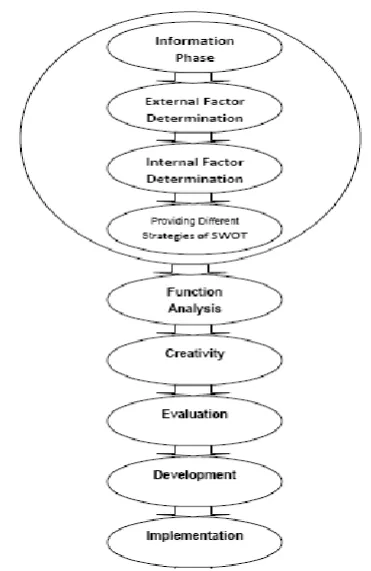
For this research, the new model (Fig. 2) was introduced as follows:
Figure 2: New proposed model
The six step value engineering model was implemented with SWOT in order to get acceptable strategy
Administrative process of SWOT analysis and development of strategy
When the information was collected from different sources and the analysis done, a list was prepared based on the internal and environmental factors of cluster and the summation of the parameters by the help of the Delphi method. Each parameter is weighed, the strengths, weaknesses, opportunities and threats were studied and the matrix was formed. Finally, the strategies regarding the fishery were developed. The procedures involved are as follows (Mostafaeipour et al., 2007): Stage 1
1) Collection of information from different sources and the summation of specialists and elites ideas with the help of Delphi method.
2) Determination of the internal factors. 3) Determination of the external factors.
Stage 2
1) The development of the matrix studying the external factors.
2) The development of the matrix studying the internal factors.
Stage 3
Development of SWOT matrix for fishery and provision of strategy.
Collection of information from different sources:
At the first stage, the information was gathered from different sources including interviewing the experts and elites, and then a primary list based on the weaknesses, strengths, threats, and advantages was made. Then the summation was done by a selected group of 11 people and with the help of the Delphi technique. Therefore, the following issues were taken into consideration to provide the external factor matrix and internal factor matrix.
Internal and external factors
When the internal and external factors are found and the key and non-key factors are distinguished, the time will come to propose suggestions. The SWOT model normally consists of a two-aspect coordinate table, each part of which represent some strategies, in other words, four branches of strategies are always provided in this model (Mostafaeipour et al., 2007).The aim of any SWOT analysis is to identify the key internal and external factors that are important to achieving the objective. SWOT analysis groups key pieces of information into two main categories (Armstrong, 1996; Armstrong, 2006):Internal factors – The strengths and
weaknesses internal to the organization.
- External factors – The
opportunities and threats
presented by the external environment.
The internal factors may be viewed as strengths or weaknesses depending upon their impact on the organization's objectives. What may represent strengths with respect to one objective may be weaknesses for another objective. The factors may include personnel, finance, manufacturing capabilities, and so on. The external factors may include macroeconomic matters, technological change, legislation, and socio-cultural changes, as well as changes in the marketplace or competitive position. The results are often presented in the form of a matrix. SWOT analysis is just one method of categorization and has its own weaknesses. For example, it may tend to persuade companies to compile lists rather than think about what is actually important in achieving objectives. It also presents the resulting lists uncritically and without clear prioritization so that, for example, weak opportunities may appear to balance strong threats. Dehghani (2007) used the methodology with external and internal factors. All tables in this article are provided based on a standard and known methodology used by Dehghani (2007).
Determination of external factors
The external factor or environment refers to the group of phenomena or events that affect the activities of a firm and at the same time they are out of control. In order to find out the external factors surrounding a firm or organization, the incoming
695
Iranian Journal of Fisheries Sciences, 10(4), 2011 opportunities and threats facing the industry must be studied.
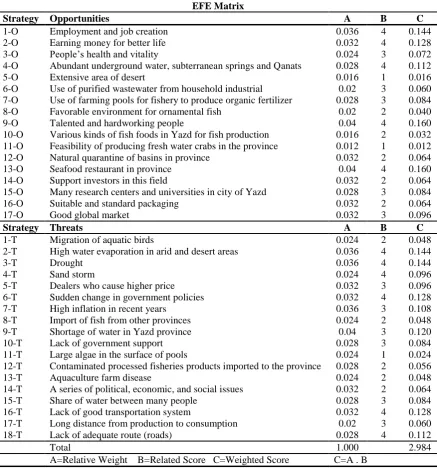
Development of External Factor Examining (EFE) Matrix
The strategists manage to study the economic, social, cultural, ecological, environmental, political, governmental and technological factors as well as the competitive information with the help of external factor examining matrix. In order
to provide the external factor examining matrix, some stages are involved. The matrix is intended to examine the opportunities and threats (Tables 1 and 2) of units (departments) of the organization.
Table 1: External factor examining (EFE) matrix
EFE Matrix
Strategy Opportunities A B C
1-O Employment and job creation 0.036 4 0.144
2-O Earning money for better life 0.032 4 0.128
3-O People’s health and vitality 0.024 3 0.072
4-O Abundant underground water, subterranean springs and Qanats 0.028 4 0.112
5-O Extensive area of desert 0.016 1 0.016
6-O Use of purified wastewater from household industrial 0.02 3 0.060 7-O Use of farming pools for fishery to produce organic fertilizer 0.028 3 0.084 8-O Favorable environment for ornamental fish 0.02 2 0.040
9-O Talented and hardworking people 0.04 4 0.160
10-O Various kinds of fish foods in Yazd for fish production 0.016 2 0.032 11-O Feasibility of producing fresh water crabs in the province 0.012 1 0.012 12-O Natural quarantine of basins in province 0.032 2 0.064
13-O Seafood restaurant in province 0.04 4 0.160
14-O Support investors in this field 0.032 2 0.064
15-O Many research centers and universities in city of Yazd 0.028 3 0.084
16-O Suitable and standard packaging 0.032 2 0.064
17-O Good global market 0.032 3 0.096
Strategy Threats A B C
1-T Migration of aquatic birds 0.024 2 0.048
2-T High water evaporation in arid and desert areas 0.036 4 0.144
3-T Drought 0.036 4 0.144
4-T Sand storm 0.024 4 0.096
5-T Dealers who cause higher price 0.032 3 0.096
6-T Sudden change in government policies 0.032 4 0.128
7-T High inflation in recent years 0.036 3 0.108
8-T Import of fish from other provinces 0.024 2 0.048
9-T Shortage of water in Yazd province 0.04 3 0.120
10-T Lack of government support 0.028 3 0.084
11-T Large algae in the surface of pools 0.024 1 0.024
12-T Contaminated processed fisheries products imported to the province 0.028 2 0.056
13-T Aquaculture farm disease 0.024 2 0.048
14-T A series of political, economic, and social issues 0.032 2 0.064
15-T Share of water between many people 0.028 3 0.084
16-T Lack of good transportation system 0.032 4 0.128
17-T Long distance from production to consumption 0.02 3 0.060
18-T Lack of adequate route (roads) 0.028 4 0.112
Total 1.000 2.984
A=Relative Weight B=Related Score C=Weighted Score C=A . B
Table 2:Relative weight for use in (IFE) Matrix
Determination of internal factors
The internal factors are those that are under the control of the organization. The internal factors are usually divided into the strengths and weaknesses. In order to
achieve its goals, each organization attempts to strengthen weak points to avoid its negative consequences.
For Use in IFE Matrix
Strategy Relative Weight Importance Degree
1-O 0.036 4.5
2-O 0.032 4
3-O 0.024 3
4-O 0.028 3.5
5-O 0.016 2
6-O 0.02 2.5
7-O 0.028 3.5
8-O 0.02 2.5
9-O 0.04 5
10-O 0.016 2
11-O 0.012 1.5
12-O 0.032 4
13-O 0.04 5
14-O 0.032 4
15-O 0.028 3.5
16-O 0.032 4
17-O 0.032 4
Strategy Relative Weight Importance Degree
1-T 0.024 3
2-T 0.036 4.5
3-T 0.036 4.5
4-T 0.024 3
5-T 0.032 4
6-T 0.032 4
7-T 0.036 4.5
8-T 0.024 3
9-T 0.04 5
10-T 0.028 3.5
11-T 0.024 3
12-T 0.028 3.5
13-T 0.024 3
14-T 0.032 4
15-T 0.028 3.5
16-T 0.032 4
17-T 0.02 2.5
18-T 0.028 3.5
Total 1.000 124.5
Iranian Journal of Fisheries Sciences, 10(4), 2011 697
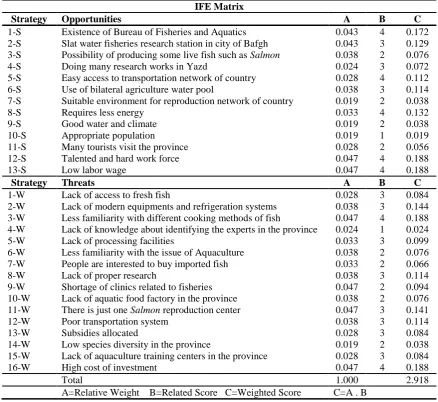
Table 3: Internal factor examining (IFE) matrix
IFE Matrix
Strategy Opportunities A B C
1-S Existence of Bureau of Fisheries and Aquatics 0.043 4 0.172 2-S Slat water fisheries research station in city of Bafgh 0.043 3 0.129 3-S Possibility of producing some live fish such as Salmon 0.038 2 0.076
4-S Doing many research works in Yazd 0.024 3 0.072
5-S Easy access to transportation network of country 0.028 4 0.112 6-S Use of bilateral agriculture water pool 0.038 3 0.114 7-S Suitable environment for reproduction network of country 0.019 2 0.038
8-S Requires less energy 0.033 4 0.132
9-S Good water and climate 0.019 2 0.038
10-S Appropriate population 0.019 1 0.019
11-S Many tourists visit the province 0.028 2 0.056
12-S Talented and hard work force 0.047 4 0.188
13-S Low labor wage 0.047 4 0.188
Strategy Threats A B C
1-W Lack of access to fresh fish 0.028 3 0.084
2-W Lack of modern equipments and refrigeration systems 0.038 3 0.144 3-W Less familiarity with different cooking methods of fish 0.047 4 0.188 4-W Lack of knowledge about identifying the experts in the province 0.024 1 0.024
5-W Lack of processing facilities 0.033 3 0.099
6-W Less familiarity with the issue of Aquaculture 0.038 2 0.076 7-W People are interested to buy imported fish 0.033 2 0.066
8-W Lack of proper research 0.038 3 0.114
9-W Shortage of clinics related to fisheries 0.047 2 0.094 10-W Lack of aquatic food factory in the province 0.038 2 0.076 11-W There is just one Salmon reproduction center 0.047 3 0.141
12-W Poor transportation system 0.038 3 0.114
13-W Subsidies allocated 0.028 3 0.084
14-W Low species diversity in the province 0.019 2 0.038 15-W Lack of aquaculture training centers in the province 0.028 3 0.084
16-W High cost of investment 0.047 4 0.188
Total 1.000 2.918
A=Relative Weight B=Related Score C=Weighted Score C=A . B
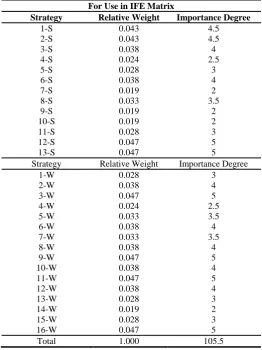
Development of Internal Factor Examining (IFE) Matrix
The internal factor examining matrix is obtained by studying the internal factors of an organization strategically. The matrix is intended to examine the strengths, and weaknesses (Table 3 and 4) of units (departments) of the organization. It also renders some methods by which the relations between the units are provided. In
order to prepare such a matrix, the witnesses’ judgments should be focused on, so the scientific methods can’t be interpreted in a way that they are considered to be effective, comprehensive and valuable. A thorough understanding of these factors is more important than the real numbers and figures.
Table 4: Relative weight for use in internal factor examining (IFE) Matrix
Establishing of SWOT matrix and providing a strategy
After recognizing, studying and classifying the internal and external factors, considering tables 1 and 3, these factors
were inserted in the margin of SWOT suggested in 4 areas (Tables 5, 6, 7 and 8) as follows:
Table 5: Final strategy based upon S & O
Final Strategy Based Upon S & T
No. S O Strategy
1 4 1 Creating jobs for researchers
2 11,12 1 Development of the city and job creation for workers
3 11,9 13 Sea food restaurants to attract more tourists in Yazd with good climate 4 4 9 Doing more research with lowest cost
5 8 16,17 Export products with good quality packaging with less energy cost 6 6 6 Construction bilateral pools to use purified waste water from different
sources
7 3,5 14 Support investors to produce Salmon fish, then export to other cities For Use in IFE Matrix
Strategy Relative Weight Importance Degree
1-S 0.043 4.5
2-S 0.043 4.5
3-S 0.038 4
4-S 0.024 2.5
5-S 0.028 3
6-S 0.038 4
7-S 0.019 2
8-S 0.033 3.5
9-S 0.019 2
10-S 0.019 2
11-S 0.028 3
12-S 0.047 5
13-S 0.047 5
Strategy Relative Weight Importance Degree
1-W 0.028 3
2-W 0.038 4
3-W 0.047 5
4-W 0.024 2.5
5-W 0.033 3.5
6-W 0.038 4
7-W 0.033 3.5
8-W 0.038 4
9-W 0.047 5
10-W 0.038 4
11-W 0.047 5
12-W 0.038 4
13-W 0.028 3
14-W 0.019 2
15-W 0.028 3
16-W 0.047 5
Total 1.000 105.5
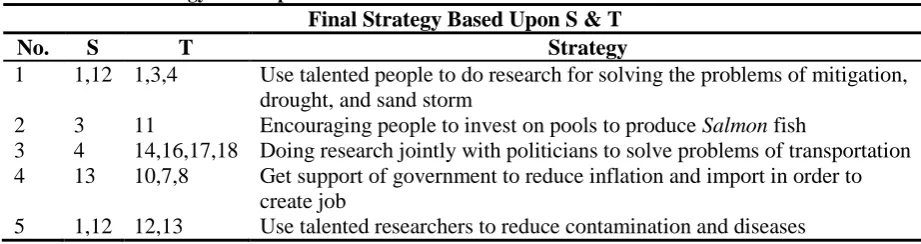
Iranian Journal of Fisheries Sciences, 10(4), 2011 699 Table 6: Final strategy based upon S &T
Final Strategy Based Upon S & T
No. S T Strategy
1 1,12 1,3,4 Use talented people to do research for solving the problems of mitigation, drought, and sand storm
2 3 11 Encouraging people to invest on pools to produce Salmon fish
3 4 14,16,17,18 Doing research jointly with politicians to solve problems of transportation 4 13 10,7,8 Get support of government to reduce inflation and import in order to
create job
5 1,12 12,13 Use talented researchers to reduce contamination and diseases
Table 7: Final strategy based upon W & O
Final Strategy Based Upon W & O
No. W O Strategy
1 5,2 4 Construction of processing facilities and refrigeration system by investors 2 13 11 Producing crabs by government support and also subsidies allocation 3 11 3 Encourage people to consume fish for their health by advertisement 4 16 15 Do more research to lower cost of investment
5 14 13,14,17 Increase species diversity by support of investors for domestic and export
Table 8: Final strategy based upon W & T
Final Strategy Based Upon W & T
No. W T Strategy
1 4 1,3,4 Get opinion of experts to solve problems of migrating birds, drought, and sand storm
2 5,11 10 Government support for processing facilities and Salmon fish production 3 12 8,17 Poor transportation system and long distance to market affects export 4 15 1,2,3,4,11 Aquaculture centers in the province solve many barriers
Value Engineering Analysis
Clearly, Value Engineering (VE) is a systematic effort to improve the value of a product, project or system and optimize the life cycle cost. It is a process that identifies opportunities to remove unnecessary costs while assuring that the quality, reliability, performance, and other critical factors meet the customer’s expectations. There are some different job plans including five to eight steps in order to do the analysis, but the most important part is the creative phase and also evaluation of the ideas created in brainstorming sessions.
Creativity phase
In today's rapidly evolving global economy, organizations need to continuously improvise and innovate. Because customers expect new and better products and services all the time, organizations have to be creative and innovative. It is a common belief that many of the really fundamental and seminal ideas are to a large extent lucky and unpredictable accidents. Innovations are more of a chance event than a milestone or outcome of a managed process (Wiener, 1993; Goel and Singh, 1998). However, there are circumstances favorable and unfavorable for innovations, creativity and original ideas. There are
certain procedures and techniques, which will increase the chance of occurrence of the occasional and sporadic phenomenon of invention (Wiener, 1993). Creativity and innovation involve the translation of our unique gifts, talents and vision into an external reality that is new and useful. Creativity refers to all activities that involve the generation of ideas. Innovation refers to the implementation of viable business ideas generated as a result of the organization's creativity-supporting culture and structure (Prather and Gundry, 1995; Goel and Singh, 1998). This is the most important part of the job plan in which the ideas would be mentioned in order to be evaluated for consideration. It is interesting in Value Engineering process that all ideas would be respected and considered even if they apparently look strange, unaccepted or outrageous. Everybody is free to suggest his/her own idea. All the members of the VE team have the same right and nobody could act as a dictator for applying his/her idea to the group. It is not necessary to have only professionals in the group, because it is possible that a person with different profession would suggest an idea, which others may have never thought of it before. It is better to invite different people for discussing problems, but it is recommended to also use specialists in mentioned fields too.
Evaluation phase
In the evaluation phase, the objective is to evaluate the alternatives identified in the creativity phase. We should eliminate impractical useless or unfeasible alternatives and those that obviously do
not meet the requirements established in the pre-study for the purpose of project. The suggested alternatives from creative phase should be grouped by their similarities and then each group should be analyzed for the advantages and disadvantages, which could be expected. Groups would then be evaluated as to their importance to the project. With a ranking of the groupings and the advantages and disadvantages of each, the alternatives are evaluated both as a group and individually to determine which alternatives offer the greatest potential for improvement and should therefore be further developed in order to solve the problems of the subject. Information should be gathered on each of the remaining alternatives to allow for effective analysis of these alternatives. If for example every alternative is eliminated during the evaluation phase, then other new ideas should be suggested in the creative phase (Mostafaeipour et al., 2007). For evaluation phase regarding fishery issues in Yazd, some of the most important suggestions were chosen in order to be developed. It should be noted that most of the suggestions in creative phase were important, but the aim is to choose the best amongst them. We also must consider choosing alternatives, which we would also be able to implement, but not to suggest. It should also be noted that one idea from each group has been chosen. Between all the created ideas, some of them, which were more effective, were chosen.
There are only nine suggestions, which were chosen between many ideas at the brainstorming process. Each of these nine proposals is in different groups in
Iranian Journal of Fisheries Sciences, 10(4), 2011 701 which must be considered for development
phase. In the creative phase, we only note down the creative ideas. No evaluation of the ideas is done at this stage. All evaluations are done in evaluation phase and decision phase. The criteria for evaluation which have been selected in evaluation phase as well as weighting is given for each criterion. The matrix shown below (Table 9) in the evaluation phase fixes the scores/weightages. In the matrix (Table 10), the criteria which are considered to be more important are written and then the difference between
them is noted. For example if you consider the first cell of the matrix, between A and B, A is considered to be important but B is also important with the difference in importance considered to be Minor. So in the first cell its written B1. Similarly, in the second cell (right of first cell), between A and C, C is more important with a medium difference between importance level of A and C. So C2 is written. Again, these are only examples and if the VE team feels these need to be changed, they can be changed accordingly. Similarly all cells of the matrix need to be filled up.
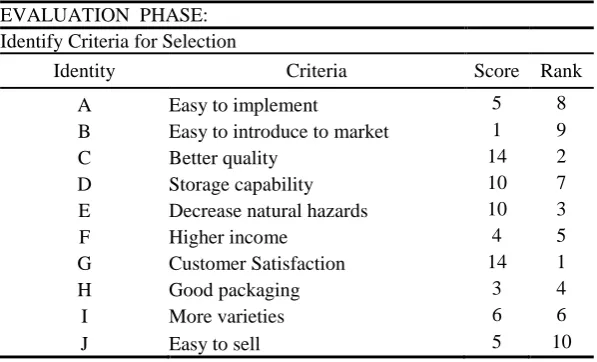
Table 9:Identifying Criteria for Selection with Rank and Score EVALUATION PHASE:
Identify Criteria for Selection
Identity Criteria Score Rank
A Easy to implement 5 8
B Easy to introduce to market 1 9
C Better quality 14 2
D Storage capability 10 7
E Decrease natural hazards 10 3
F Higher income 4 5
G Customer Satisfaction 14 1
H Good packaging 3 4
I More varieties 6 6
J Easy to sell 5 10
Table 10: Scores for Using in Decision Matrix
B C D E F G H I J SCORE A B1 C2 D1 A2 A1 A1 A1 I1 J1 5
B C3 D3 E1 F4 G2 A2 I2 B0 1 C C0 C1 C1 G1 C3 C2 C1 14 D D0 D2 G1 D1 D2 D1 10 E E2 G1 E3 E1 E3 10 F G3 H2 I2 J2 4 Comparision Pts G G1 G3 G2 14 Major Difference 3 H H1 J1 3
Medium Difference 2 I J1 6
Minor Difference 1 J 5
No Difference 0
There are 10 criteria in table 9 from A to J, which would be used in Decision Matrix. The scores were found from table 10. The highest rank belongs to criteria C and G with 14 points and the lowest rank belongs to "Easy to introduce to market" with one point. In “Evaluation” phase, for the scores calculation in the matrix, the scores for particular criteria are calculated along the row as well as along the column. These scores are updated in the top table of evaluation phase. Ranking is done just to perceive that prioritization has been done properly. If something is not so important according to all team members and it appears with a high rank then it indicates something went wrong somewhere in evaluating the criteria and thus necessary corrections should be carried out.
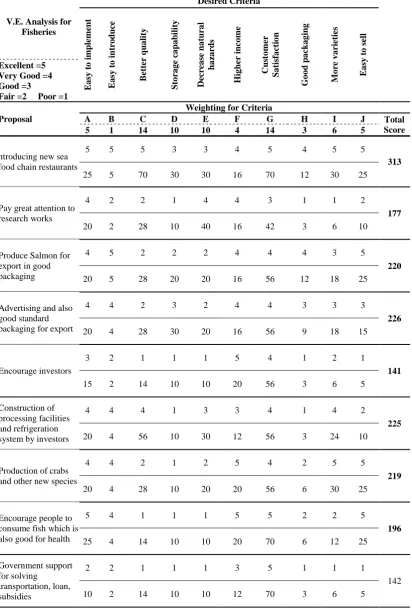
Development and final decision phase
The decision matrix in table 11 is the last step for choosing the best proposal. The total score could be seen in the last column in the right side in which proposed idea No 1 with the highest score of 313 was selected. Clearly, introducing new sea food chain restaurants could be the best alternative to be implemented based upon the VE analysis which was done for this purpose. The criteria and ideas are copied in the decision matrix. The scores against each criterion are copied in the decision matrix which denotes the weightings against each criterion. Then, each of the ideas is evaluated against each criterion. The score of an idea against criteria is calculated by multiplying the score against criteria with the weight of the criteria.
Score of idea against criteria = (score in scale of 1-5) × (weigh of the criteria).
Implementation phase
It is very important to consider an adequate strategy in general to develop fishery industries in Yazd. By introducing new seafood chain restaurants, fish consumption by people would then be increased. This strategy could directly yield to development of the fishery business and higher income in long term.
Results
The SWOT technique was used to gain the best strategy. External factor examining matrix (Table 1) and internal factor examining matrix (Table 3) were provided, then relative weight for use in external factor examining matrix (Table 2) and internal factor examining factor (Table 4) were calculated.
Different strategies were provided by establishing four different criteria which are as follows:
Seven different strategies based upon Strengths and Opportunities (S&O) (Table 5) were identified, five different strategies based upon Strengths and Threats (S&T) (Table 6) were identified, four different strategies based upon Weaknesses and Opportunities (W&O) (Table 7) were identified and four different strategies based upon Weaknesses and Threats (W&T) (Table 8) were identified. For VE analysis, nine proposed ideas from SWOT analysis were selected for the brainstorming sessions. A decision matrix (Table 11) was built in order to select the best proposed strategy.
Iranian Journal of Fisheries Sciences, 10(4), 2011 703 Table 11: Decision Matrix
V.E. Analysis for Fisheries Desired Criteria Ea sy t o im p lem en t Ea sy t o in tr o d u ce Be tte r q u a li ty S to ra g e ca p a b il it y De cr ea se n a tu ra l h a za rd s H ig h er in co m e Custo m er S a tisfa cti o n G o o d p a ck a g in g Mo re v a rietie s Ea sy t o se ll Excellent =5 Very Good =4 Good =3
Fair =2 Poor =1
Proposal
Weighting for Criteria
A B C D E F G H I J Total
Score
5 1 14 10 10 4 14 3 6 5
ntroducing new sea food chain restaurants
5 5 5 3 3 4 5 4 5 5
313
25 5 70 30 30 16 70 12 30 25
Pay great attention to research works
4 2 2 1 4 4 3 1 1 2
177
20 2 28 10 40 16 42 3 6 10
Produce Salmon for export in good packaging
4 5 2 2 2 4 4 4 3 5
220
20 5 28 20 20 16 56 12 18 25
Advertising and also good standard packaging for export
4 4 2 3 2 4 4 3 3 3
226
20 4 28 30 20 16 56 9 18 15
Encourage investors
3 2 1 1 1 5 4 1 2 1
141
15 2 14 10 10 20 56 3 6 5
Construction of processing facilities and refrigeration system by investors
4 4 4 1 3 3 4 1 4 2
225
20 4 56 10 30 12 56 3 24 10
Production of crabs and other new species
4 4 2 1 2 5 4 2 5 5
219
20 4 28 10 20 20 56 6 30 25
Encourage people to consume fish which is also good for health
5 4 1 1 1 5 5 2 2 5
196
25 4 14 10 10 20 70 6 12 25
Government support for solving
transportation, loan, subsidies
2 2 1 1 1 3 5 1 1 1
142
10 2 14 10 10 12 70 3 6 5
Therefore, tables 9 and 10 were used to rank and calculate the scores for nine different proposed strategies. Final scores were calculated in which the best strategy would gain the highest score (Table 11). Based upon the analysis, which was done for implementing the SWOT and VE into the fishery business, it was found that the best idea is to introduce some seafood chain restaurants. The proposed idea with the highest score of 313 was selected. The second alternative with the score of 226 was advertisement and also using good packaging of products for export. Clearly, there were nine creative ideas which finally were evaluated and could be implemented for appropriate situations in the future.
Discussion
This study showed that people in business of fisheries lack hope for a better future for the province of Yazd in Iran. Indeed, increasing operational costs may lead to eventual economic extinction of the fisheries. Elimination of subsidies could reduce willingness of people to remain in this business. An increasing price of fuel cost would clearly be a disaster in the future for this issue. Hence, it is necessary to introduce new creative ideas in order to solve present and upcoming problems. Value engineering and SWOT analysis were used for strategic planning in order to suggest new ideas to resolve present fishery problems in Yazd city. There are five to nine step value engineering models, but we used the six step value engineering model which was implemented with SWOT in order to achieve an acceptable strategy.
In our study, there were many suggested ideas, but findings indicate that the optimized policy is to introduce new sea food chain restaurants into the studied province. Other obtained important results in the present study were: 1) advertising and good standard packaging for export, 2) building facilities for processing and refrigeration by investors, 3) producing Salmon for export in good packaging, 4) producing crabs and other new species, 5) encouraging people to consume more fish, 6) paying great attention to research works, 7) government supporting for transportation, loan, and subsidies and 8) encouraging investors. Considering the obtained strategies in this research, it is suggested that by implementing the new strategies, a positive step would be initiated in this field.
Acknowledgements
The authors would sincerely thank the Executive & Technical Manager of IJFS, Dr. Kakoolaki for making this a valuable work for publication at this journal. Also we appreciate Dr. Ro. Moog for his valuable comments.
References
Albrecht, K., 1992. The only thing that matters. Executive Excellence, 9(7). Alderson, W., 1957. Marketing behavior
and executive action, Homewood, IL, Irwin.
Ananda, J. and Herath, G., 2003. The use of Analytic Hierarchy Process to incorporate stakeholder preferences into regional forest planning. Forest
Policy and Economics, 5, 13–26.
Iranian Journal of Fisheries Sciences, 10(4), 2011 705 Anderson, P., 1982. Marketing, strategic
planning and the theory of the firm.
Journal of Marketing, 46(2), 15– 26.
Anderson, J. C. and Narus, J. A., 1999. Business market management: Understanding, creating, and delivering value, Upper Saddle River, NJ. Prentice Hall.
Armstrong, J. S., 1982. The Value of Formal Planning for Strategic Decisions. Strategic Management
Journal, 3, 197-211.
Armstrong, M., 1996. Management Processes and Functions, London CIPD (ISBN 0-85292-438-0).
Armstrong, M., 2006. A handbook of Human Resource Management Practice (10th edition), Kogan Page, London (ISBN 0-7494-4631-5). Bolton, W. and Drew, J. H., 1999. A
multistage model of customers’ assessment of service quality and value. Journal of Consumer Research, 17(4), 375– 384.
Buzzell, R. D. and Gale, B. T., 1987. The PIMS principles, New York, The Free Press.
Catanzano, J. and Rey H., 1995. La recherche halieutique entre science et action: re´flexions sur fond de crise. Nature, Science et Socie´ te´s, 25. Chusil, M. and Downs, S., 1979. When
value helps, The PIMSLETTER on business strategy, Cambridge, MA, The Strategic Planning Institute.
Dehghani, M. H., 2007. Industrial and economic development survey for textile SMEs: Case study. Industrial Engineering Department, Yazd University.
Doyle, P., 2000. Value-based marketing: Marketing strategies for corporate growth and shareholder value, Chichester, John Wiley & Sons. Drucker, P., 1973. Management: Tasks,
responsibilities, practices. New York, Harper & Row.
Eriksson, K. and Lofmarck-Vaghult, A., 2000. Customer retention, purchasing behavior and relationship substance in professional services, Industrial.
Marketing Management, 19, 363–372.
Fong, S.W., 1998. Value Engineering in Hong Kong: A powerful tool for a changing society. Computers
industrial Engineering, 35(3-4),
627-630.
Fornell, C., 1992. A national satisfaction barometer: The Swedish experience.
Journal of Marketing, 56(1), 1–21.
Garces, L. R., Pido, M. D., Pomeroy, R. S., Koeshendrajana, S., Prisantoso, B. I., Fatan, N. A., Adhuri, D. et al., 2010. Rapid assessment of community needs and fisheries status in tsunami-affected communities in Aceh Province, Indonesia. Ocean & Coastal
Management, 53, 69–79.
Garcia, S. M., Charles, A. T., 2008. Fishery systems and linkages: Implications for science and governance. Ocean & Coastal
Management, 51, 505–527.
Goel, P. S. and Singh, N., 1998. Creativity and Innovation in Durable Product Development. Computers industrial Engineering, 35(1-2), 5-8. Harte, M., Endreny, P., Sylvia, G. and
Mann, H. M., 2008. Developing underutilized fisheries: Oregon’s
developmental fisheries program.
Marine Policy, 32, 643–652.
Hill, T. and Westbrook, R., 1997. SWOT Analysis: It’s Time for a Product Recall. Long Range Planning, 30(1), 46-52.
Hosseini, H., Majid Cheraghali, A., Yalfani, R. and Razavilar, V., 2004. Incidence of Vibrio spp. in shrimp caught off the south coast of Iran. Food Control, 15: 187–190.
Kotler, P., 1994. Marketing Management: Analysis, Planning, Implementation and Control, eighth ed. Printice-Hall, Englewood Cliffs, NJ.
Kurttila, M., Pesonen, M., Kangas, J. and Kajanus, M., 2000. Utilizing the analytic hierarchy process (AHP) in SWOT analysis: A hybrid method and its application to a forest certification case. Forest Policy and Economics, 1(1), 41–52.
Leslie, H.M., 2005. A synthesis of marine conservation planning approaches.
Conservation Biology, 19,1701–1703.
Male, S. and Kelly, J., 2007. A Re-appraisal of Value Methodologies in Construction, SAVE International. Moogouei R., Karbassi A.R., Monavari
S.M., Rabani M., Taheri Mirghaed A., 2010. Effect of the selected physico-chemical parameters on growth of rainbow trout (Oncorhynchus mykiss) in raceway system in Iran. Iranian Journal of
Fisheries Sciences, 9(2), 245-254.
Mostafaeipour, A., Roy, N. and
Samaddar, A. B., 2007.
Implementation of VE technique on Pistachio farm management in city of Yazd in Iran. International conference
of Industrial Engineering, Cancun, Mexico.
Mostafaeipour, A., 2009. Implementation of Value Engineering Technique for Improvement of Humidifier System. The 14th Annual International Conference on Industrial Engineering, Theory, Practices & Applications, Anaheim, California, USA.
OECD, 2005. Subsidies: a way towards sustainable fisheries? Policy brief. Paris: Organization for Economic Cooperation and Development.
Pak, A. and Farajzadeh, M., 2007. Iran’s Integrated Coastal Management plan: Persian Gulf, Oman Sea, and southern Caspian Sea coastlines. Ocean & Coastal Management, 50, 754–773. Prather, C.W., 1995. Gundry L K,
Blueprints for Innovation, AMA Membership Publication Division, New York.
Ram, K., Shrestha, K., Janaki, R., Alavalapati, R., Robert, S. and Kalmbacher, S., 2004. Exploring the potential for silvopasture adoption in south-central Florida: an application of SWOT–AHP method. Agricultural Systems, 81,185–199.
Reichheld, F. F., 1996. The loyalty effect: The hidden force behind growth, profits, and lasting value. Boston, MA. Harvard Business School Press. Ritu, P., 2006. EIA practice in India and
its evaluation using SWOT analysis.
Environmental Impact Assessment
Review, 26, 492–510.
Rust, R. T. and Zahorik, A., 1993. Customer satisfaction, customer retention and market share. Journal of
Retailing, 69(2), 193– 216.
707
Iranian Journal of Fisheries Sciences, 10(4), 2011 Rust, R. T., Zeithaml, V. and Lemon, K.
N., 2000. Driving customer equity: How customer lifetime value is reshaping corporate strategy, New York, The Free Press.
Saaty, T.L., 1993. The analytic hierarchy process: a 1993 overview. Central
European Journal of Operation
Research and Economics, (2), 119–
137.
Scheuing, E. E., 1995. Creating customers for life, Portland, Oregon, USA, Productivity Press.
Scholz, A., Bonzon, K., Fujita, R., Benjamin, N., Woodling, N. and Black, P., et al., 2004. Participatory socioeconomic analysis: drawing on fishermen’s knowledge for marine protected area planning in California.
Marine Policy, 28,335–349.
Smith, J.A., 1999. The behavior and performance of young micro firms: evidence from businesses in Scotland.
Small Business Economics, 13, 185–
200.
Sumaila U.R. and Pauly, D., 2006. Catching more bait: a bottom-up re-estimation of global fisheries subsidies. Fisheries Centre research reports, 14 (6). Canada: Fisheries Centre, University of British Columbia.
Weihrich, H., 1982. The TOWS matrix – a tool for situation analysis. Long
Range Planning, 15 (2), 54–66.
Wiener, N., 1993. Invention: The Care and Feeding of Ideas, The MIT Press. Woodruff, R. B., 1997. Customer value:
The next source of competitive advantage. Journal of the Academy of
Marketing Science, 25(2), 139– 153.
Zithaml, V., 2000. Service quality, profitability, and the economic worth of customers: What we know and what we need to learn. Journal of the
Academy of Marketing Science, 28(1),
67– 85.
یاهشور دربراك
یسذنهم
شزرا
رد
نیوذت
اهدربهار
(
یدروم هعلاطم
:
شخب
دسی رهش تلایش
)
روپ یئافطصم یلع
1
*
،
یوضترم یذهم
2
،
یئوقربا ارذص رصان
3
هذیکچ
کیىکت ي شسرا یسذىُم یفزعم ٍب ٍلبمم هیا رد SWOT
رد دشی نبتسا تلایض صخب رد دزبَار هیيذتي لئبسم لیلحتي ٍیشجترد
زپ نازیا دًض یم ٍتخاد .
دًبُب هیىچمَ ي ٍىیشَ صَبک جعبب فلتخم یبَ ٍىیمس ي دراًم سا یربیسب رد کیىکت يد زَ سا ٌدبفتسا
ذوا ٌدزب ربک ٍب ذیفم یراشبا ناًىع ٍب ار بُوآ فلتخم یبَ تکزض سا یربیسب یتح ٍک تسا ٌذض تیفیک سا یربیسب بُوآدزبربک بب ي
میمصت رد بسبىمبو ي ذمآربکبو لماًع ذوًض لصف ي لح ذىواًت یم بُیزیگ
. یبتساررد ذواًت یم ٍعلبطم هیاسا لصبح جیبتو
کیىکت ي شسرا یسذىُم یزیگربکب SWOT
سا تیزیذم ٍب طًبزم لئبسم یتح ي یزیگ میمصت ،ٍجیتو هیزتُب ٍب نذیسر یازب
دزیگ رازل ٌدبفتسا درًم قلاخ یبَ ٌذیا ٍب ٍجًت كیزط .
لئبسم لیلحت ي ٍیشجت سبسا زب تسبیس ٍک ذىَد یم نبطو بَ ٍتفبی ،تلایض
ذوًض ثاذحا نبتسا رد ذیذج ییبیرد ییاذغ داًم یا ٌزیجوس یبُوارًتسر ٍک تسا نآ ٍىیُب .
او ناگش یذیلك :
،شسرا یسذىُم ،تلایض SWOT
یژتازتسا ، دشی ،
______________________
1 -نازیا ،دشی ،دشی ٌبگطواد عیبىص یسذىُم ٌذکطواد .
2 -ًم نازیا ،نازُت یسريبطک دبُج یدزبربک یملع یلبع شسًمآ ٍسس .
3 -نازیا ،دشی، یسريبطکدبُج یدزبربک یملع یلبع شسًمآ ٍسسًم .
* سردآ لًئسم ٌذىسیًو یکیويزتکلا تسپ :