98
University of Mazandaran doi:10.22080/jgr.2017.12953.1068
Iranian Biology Society
Direct Assay of miR-16, miR-145 and miR-223 by a Novel Method of Mimic
PCR in Serum of Breast Cancer Patients
Elham Ghazizadeh1, Faranak Hadi2* and Maryam Zare3
1Department of Medicine Biotechnology, Mashhad University of Medical Sciences, Mashhad, Iran 2Department of Biology, Faculty of Science, Lorestan University, Khoramabad, Iran
3Department of Biology, Faculty of Science, Payame Noor University, PO Box 19395-3697, Tehran, Iran
*Corresponding Author: hadi.f@lu.ac.ir
Received: 15 October 2016 Accepted: 01 December 2016
Abstract
The role of microRNAs (miRs) is shown as a biomarker whose expression level changes have been associated with cancer development and progression. Circulating miRNAs has been postulated as biomarkers for breast cancer. Detection and diagnosis of miRNA markers could provide an improved and sensitive method in clinical application. In this study, we applied and improved the effective approach by coupling a deoxyuridine-incorporated RT oligonucleotide with a secondary structure and a mimic PCR for assessment and direct detection of circulating miRs in serum. We designed mut miR-16, mut miR-145 and mut miR-223 as mimic miRs. These mimic miRs were used in RT-PCR for detection and quantification assay. As normalization of these mut miRs was performed with themselves, our mimic construct with 80 bp of these miRs shows the best normalization for this method in blood samples. This assay was tested in serum from 15 patients with different stages of breast cancer and 10 healthy female donors. According to our results, using a combination of miR-16 and miR-145 could represent as one of the best biomarker (p<0.001) for sensitive and specific discrimination of breast cancer and yielded a ROC curve area of 96%. Applying the plasmid of multiple mut miR is suitable as a calibrator for clinical use without requiring prob. Using multivariate logistic regression analysis, the best combination (p<0.0001) for breast cancer detection was miR-223 and miR-145.
Key words: Biomarker; Micro RNA; Mimic PCR; Breast Cancer
Introduction
Screening for breast cancer allows diagnosis at an early stage of malignancy which can reduce the mortality rate of patients. Regarding this, introducing new valuable biomarkers is necessary for early diagnosis and prognosis (Duffy 2012; Moon et al., 2015; Schummer et al., 2015; Shimomura et al., 2016; Zhu, et al., 2016). The cost and expertise required for mammography have reduced the broad application of mammography. In addition, the sensitivity of mammography is limited in young women with dense breasts. On the other hand,
sensitivity and specificity of the alternative methods such as ultrasound screening are very operator-dependent (Stout et al., 2014; Loberg et al., 2015; Sprague et al., 2015). Therefore, developing a cost-effective and accurate screening method for breast cancer is on demand.
99 et al., 2015; Stearns 2016; Kazarian et al. 2017). miRNAs are small noncoding RNAs that serve as post-transcriptional regulators of eukaryotic gene expression. Furthermore, in tumor cells, miRNAs are released into the circulatory system. Pattern of miRNAs in plasma and serum have been shown to be altered in a variety of human solid tumors, including lung, breast, liver, thyroid and ovarian cancers (Iorio et al., 2007; Iorio and Croce 2012; Berindan-Neagoe et al., 2014; Lan et al., 2015), which demonstrated that circulating miRNAs could be used as blood-based markers for molecular diagnosis. The circulating miRNAs could be a potential specific biomarker for breast cancer screening (Mathe et al., 2015; van Schooneveld et al., 2015). Differential expression of miR-16 has been reported in several cancers, including leukemia, pituitary adenomas, prostate carcinoma, lung cancer and cancers of the head and neck (Bottoni, et al., 2005; Hui et al., 2010; Patnaik et al., 2012; Gu et al., 2015; Renjie and Haiqian 2015; Bonci and De Maria 2016).
Ma et al. showed that miR-10b was highly expressed in metastatic breast cancer cells (Ma et al., 2007; Ma, 2010). Some studies reported that miR-145 is a putative tumor suppressive gene that is downregulated in several types of tumors (Iorio, et al., 2007; Iorio and Croce 2012; Berindan-Neagoe et al., 2014; Lan et al., 2015; Mathe et al., 2015; Han et al., 2016). A Recent finding has shown that downregulation of miR-145 contributes to the progression of breast cancer (Zheng et al., 2016). Increased level of miR-223 derived from platelets in modulating lung cancer is correlated with cell invasion (Liang et al., 2015). An elevated level of miR-223 secreted by tumor-associated macrophages (TAMs) is significantly involved in invasiveness of breast cancer cells via Mef2c-β-catenin pathway (Yang et al., 2011). Identification of miRNA markers which are specific to breast cancer would lead to a fast, easy, and optimal tool for assessment of the distribution and regulation of miRNAs in a clinical lab. For sensitivity and specificity of normalization, the result of this method (deoxyuridine-incorporated RT oligonucleotide with a secondary structure and a mimic) could be validated by using an external standard. Also, it could be used for the identification of biomarkers and potential
therapeutic targets required by other methods such as real-time and Q-miR by using mutated miR as the calibrator plasmid In this study, to assess the potential of serum miRs as biomarkers for breast cancer, we examined the transcript levels of miR-223, miR-16 and miR-145 in blood by a modified QC-PCR (coupling a deoxyuridine-incorporated RT oligonucleotide with a secondary structure and a mimic PCR) in serum of breast cancer patients. So, a mutated plasmid containing mutant miRs (16, miR-145, miR-223) sequences were designed and a new RT-PCR applying this plasmid was developed. These assays were further extended for multiplexed PCR for miRNAs.
Materials and Methods Patients and healthy controls
A total of 15 patients who were clinically diagnosed with breast cancer were recruited from Namazi Hospital in Shiraz and Shiraz Institute for Cancer Research (ICR) between September 2011 and July 2012. A total of 10 normal control subjects was applied, which pathologically confirmed not to have breast cancer and no history of other cancers.
Samples processing and RNA extraction
Total RNA containing small RNA was extracted from 5 ml of plasma using Trizol LS reagent (Invitrogen) and miRNeasy Mini Kit (Qiagen,
Hilden, Germany) according to the
manufacturer’s protocol with the following modifications [15]: 1 ml Trizol LS reagent was added to 5 ml plasma samples. After phase separation, 1.5 volume of 100% ethanol was added to the aqueous phase and the mixture was loaded into the miRNeasy column (Qiagen,
Hilden, Germany) according to the
100
Primer design
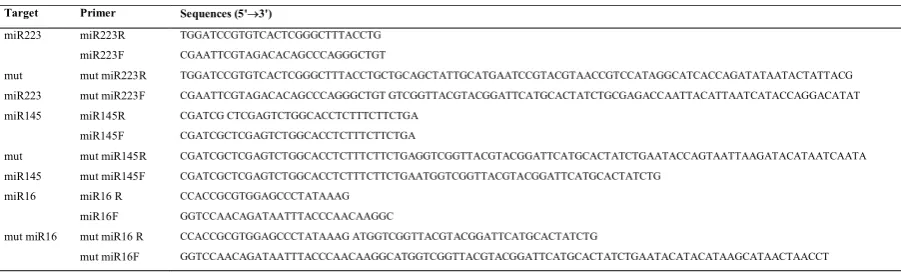
Eight sets of primers were designed for this study using primer 3 online software: biotools.umassmed.edu/bioapps/primer3_www.c gi (Table 1). For the wild type form of each miR (16, 223 and 145), two sets of primers (miR F and miR R) were designed. For the mutated
form of these primers, two primers (mut miR F and mut miR R) containing an extra fragment at their 5' ends, were designed and used for production of two intermediate fragments with a few nucleotide overlaps (Table 1). These two large fragments were fused together by splicing overlapping extension PCR (SOE-PCR)
Table 1. The primer information
Target Primer Sequences (5'3')
miR223 miR223R TGGATCCGTGTCACTCGGGCTTTACCTG
miR223F CGAATTCGTAGACACAGCCCAGGGCTGT
mut miR223
mut miR223R TGGATCCGTGTCACTCGGGCTTTACCTGCTGCAGCTATTGCATGAATCCGTACGTAACCGTCCATAGGCATCACCAGATATAATACTATTACG
mut miR223F CGAATTCGTAGACACAGCCCAGGGCTGT GTCGGTTACGTACGGATTCATGCACTATCTGCGAGACCAATTACATTAATCATACCAGGACATAT
miR145 miR145R CGATCG CTCGAGTCTGGCACCTCTTTCTTCTGA
miR145F CGATCGCTCGAGTCTGGCACCTCTTTCTTCTGA
mut miR145
mut miR145R CGATCGCTCGAGTCTGGCACCTCTTTCTTCTGAGGTCGGTTACGTACGGATTCATGCACTATCTGAATACCAGTAATTAAGATACATAATCAATA
mut miR145F CGATCGCTCGAGTCTGGCACCTCTTTCTTCTGAATGGTCGGTTACGTACGGATTCATGCACTATCTG
miR16 miR16 R CCACCGCGTGGAGCCCTATAAAG
miR16F GGTCCAACAGATAATTTACCCAACAAGGC
mut miR16 mut miR16 R CCACCGCGTGGAGCCCTATAAAG ATGGTCGGTTACGTACGGATTCATGCACTATCTG
mut miR16F GGTCCAACAGATAATTTACCCAACAAGGCATGGTCGGTTACGTACGGATTCATGCACTATCTGAATACATACATAAGCATAACTAACCT
Construction of mutated miR plasmid as an internal standard (IS)
For amplification of a mutated form of each miR, PCR reaction was carried out in a 25 μl volume containing 1X PCR buffer, 1.5 mM MgCl2, 2 mM dNTP mixture, 0.5 unit Taq DNA polymerase, 20 ng template DNA, and 1 pmol of each primer (miR F/ mut miR R primers were used in PCR I and mut miR F/ miR R primers were used in PCR II). Thermocycling conditions started with an initial denaturation step at 95ºC for 5 min, followed by 35 additional cycles at 95ºC for 1 min, annealing temperature of 70ºC for 1 min, and extension at 72ºC for 1 min. The PCR products were electrophoresed on a 1.5% agarose gel, and the DNA was purified using the DNA Extraction Kit (Bioneer). The two intermediate fragments were fused together by a two-step PCR; step 1 of the SOE-PCR involved in 15 cycles with annealing temperature of 56ºC; in step 2, SOE-PCR was continued by adding 1.5 pmol of miR F and R primers, which were annealed at 63.4ºC for another 30 cycles. The PCR reaction was set up with 0.2 mM dNTP, 1 mM MgCl2, 1X PCR buffer, and 1 unit Taq
DNA polymerase. After separation of Mut miR -16, -145 and -223 with an additional fragment at the 5' end, PCR was performed using
miR-145F and miR-223R primers, respectively. Subsequently, the PCR products were purified and inserted into the pGEM-T assay vector (Promega), which was then sequenced and used as an internal standard in QC-PCR. At the end, the DNA plasmid was digested by ScaI restriction enzyme. The copy number of the mutant plasmid was calculated based on the concentration of plasmid using the ds copy number analyzer online software which can be
found at
(www.uri.edu/research/gsc/resources/cndna.html). The estimated copy number was 5/6 x 107
copies/μl. The plasmid was serially diluted and stored at -70°C.
Quantifying expression levels of miRs (miR-16, -145 and -223) using quantitative- competitive (QC)- PCR
101 inactivation of UDG. UDG cleaves the uracil base from the phosphodiester backbone of uracil-containing DNA, but has no effect on natural (i.e., thymine-containing) DNA. So The RT oligonucleotides with deoxyuridine (dU) incorporation were synthesized by Integrated
DNA (mutation segments of miRs)
Technologies. The cDNA samples were then treated with 5 U UDG (New England Biolabs) at 37°C for 10 min. The reaction was inactivated at 95°C for 10 min and subjected to QC-PCR. Equal volumes (4 μl) of target cDNA and serial dilutions of the internal standard plasmid (9 x 10⁶, 8.0 x 10⁵, 7.97 x 10⁴, 6.86 x 10³, 5.0 x 10³,
4.56 x 10², 3.11 x 101 copies/μl) were used in
each QC-RT-PCR reaction in order to quantify the unknown mRNA expression level. PCR reactions were conducted in each QC-RT-PCR series. Each QC-RT-PCR reaction mixture contained 1 unit of Taq DNA polymerase, 1 mM MgCl2, and 1 pmol of each primer (miR F and
R). Nuclease-free water (Sigma) was added to bring the final volume to 50 μl. PCR cycling conditions were one cycle of 1 min at 94ºC, followed by 30 cycles of 30 sec. at 94ºC, 60 sec. at 67.3°C, 60 sec. at 72ºC, and finally, a 300 sec. extension at 72ºC. The amplified products were separated by gel electrophoresis, and the images were digitally recorded. The intensity of amplified wild type and mutated products was directly measured using an Image program (Java version of NIH image developed at the US National Institute of Health) and available on the internet at http://rsb.info.nih.gov/ig. And total lab and SAS software (statistical analysis system, version 7.12; SAS, Cary, N.C.)
Validation of experiments was biased on MCAS (multiple comparative assay system). This method was accomplished by the normalization
of the expression level of each miR-223, and miR-145 beside as CF (control foreign: miR-16) relative to CI (internal control: standard plasmid)
Statistical analysis
The relevance of plasma miRNA levels was determined by, the Mann-Whitney test, Wilcoxon test, κ2 test or Kruskal-Wallis test
where appropriate. The sensitivity and specificity were calculated according to the standard formulas. A multivariate logistic regression model was established and leave-one-out cross validation to find the best logistic model. ROC curves were established for discriminating patients with or without breast cancer.
Results
Patient characteristics
In this study, 15 breast cancer patients and 10 healthy donors as normal control were participated. Additionally, 15 colorectal cancer, 15 gastric cancer, 15 lung cancer, and 15 hematopoietic cancer patients were recruited. There were no significant differences in mean age between breast cancer patients and healthy controls.
Quantifying the expression of the mut miRs by QC-RT PCR
The specificity of the primers was examined with different type of cancers for these miR-16, miR-145 and miR-223 (Table 2).
Table 2. Quantification of miRs levels in different cancers by QC-RT-PC
PCR amplicons of each miR were observed for all types of cancers. For sensitivity tests, the detection limit was first evaluated using a
dilution series of cDNA used in at least 1 pg for miR-145, so, the detection level was 1 pg on agarose gel (Fig. 1).
R2
Regression equations from QC-RT-PCR and R2
Quantified by qRT- PCR Different type of cancers
0.98 Y=-1.10X + 5. 41
1.14 HCC
0.98 Y=-0.96X + 6.66
1.69 LC
0.94 Y=-0.98X + 3.47
2.76 CRC
0. 63 Y=-0. 95X + 6.28
1.98 GC
0.98 Y=-0. 94X + 5.87
102
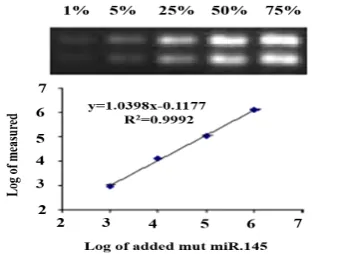
Fig. 1. Normalization of miR-145 relative to standard for 1% detection: The MCAS PCR products of the co-amplified serially diluted competitor and the fixed amount of target DNA separated on the 2% agarose gel. lane1: containing 1%; lane 2: 5%; lane 3: 25%; lane 4: 50% and lane 5: 75%.
We could detect 250 copies of mut miR with this pair of primers. The most consistent result was obtained by spiking a dilution series of cloned miRs into 10 ng of each miR DNA. Specific amplification was observed from 1 pg of plasmid DNA, which was equivalent to 250 copies of each miR-145. The regression equations from QC-RT-PCR and R2 equation for the miR-145 primers as the case of breast biomarker was examined with different type of cancers for these (Table 2).
Foreign control of miR-16 for miR-223 and miR-145
The validation amplification efficiency was examined by co-amplifying equal molar quantities of miR-16 and the target miR-145 fragment. Similar amplification efficiencies were obtained with the template over 4 orders of magnitude that were examined. The PCR reactions reached plateau periods after 30, 32, 34 and 38 cycle, respectively, when 105,106 and107
copies of miR-223, miR-16 and miR-145 were used as templates. To obtain accurate quantitation, competitive PCR should be performed within the exponential phase (Wiesner et al., 1993). Thus, competitive PCR for quantitation of 107, 106, 105 to 103 copies of
each miR should be performed for less than 32, 34, 36 and 41 cycles, respectively (Fig. 2 A, B, C).
Fig. 2. Co-amplification of miRs and standard plasmid: (A) 105 copies of miR-223 and standard
plasmid; (B) 107 copies of miR-145 and standard
plasmid; (C): 106 copies of miR-16 and standard
plasmid. Similar plot patterns were observed in a replicate experiments.
Accuracy and quantitation limit
The accuracy of quantitative competitive PCR was evaluated by using a known amount of cloned miR-145 fragments, ranging from 103 to
107copies. To evaluate how heterogeneous
103 cDNA from miRs to maintain the amplification within the exponential phase, a total of 30, 32, 34 and 38 cycles were used for quantitation of 107,106,105 and 104 copies of 145 and
miR-223 fragments, consecutively. Validation of combined plasma miRs (miR-145 and miR-223) by multiple comparative assay system was done for participants, including 15 breast cancer patients, 10 normal control subjects, 15 colorectal cancer, 15 gastric cancer, 15 lung cancer, and 15 hematopoietic cancer patients. The Real accuracy of this method was checked for every normal and other cancers relative to breast cancer participants. The results showed that there is no significant correlation for other types of cancer by this method. A two-fold dilution series of standard plasmid were used to co-amplify with a constant amount of each miRs. Linear regression of ratios of internal standard to each of the miRs (log2) and added to
mut miRs (log2) were obtained for all assays
with an R2 of 0.9867, and for 107 copies of
miR-145, 0.9917, and for 107 copies of miR-145,
0.9899, and for 105 copies of miR-223 and
0.9846, and for 106 copies of miR-16. The
correlation between measured and added values was extremely high (slope=1.0398), which indicated that a precise quantitation was over a wide range. When there were less than 103
copies of miR-145 fragments in the competitive PCR reaction, no acceptable linear regression was achieved (R2= 0.9); thus, we were unable to
quantify less than 103 using this system. To
further verify the discriminating power of the miRNAs identified for breast cancer diagnosis, plasma levels of miR-16, miR-145, miR-223 were assessed in plasma of an independent group of 90 cancer patients. Efficiency and specificity of the competitive RT-PCR were determined as described. In brief, 10-fold dilutions of mine were subjected to the quantitative competitive RT-PCR. Changes in the plasma levels of miR-145 and miR-223 in breast cancer patients (n = 15) relative to the normal participants were obvious. Expression levels of the miRNAs were normalized to mut miR-16 in quantitative competitive RT-PCR. The standard curve of the miRNA was obtained
by plotting Ct versus Log (copies) of the standard plasmid dilutions. The assay efficiency was calculated by (101/S–1) 3 100%, where S is the slope of the standard curve (Fig. 3A, B).
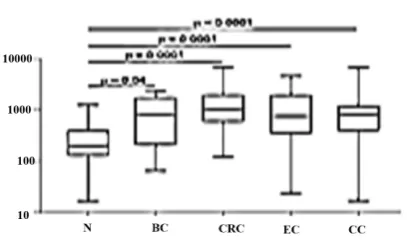
Fig. 3. Validation of combined plasmid mut miR-145 and miR-223 by multiple comparative assay system: Accuracy of this RT method was checked for normal and other cancers relative to breast cancer.
For the calculation of specificity, we used identical amounts (107 copies per RT) of
104
Fig. 4. The differential expression of microRNAs in patients with breast cancer. Changes of 223(A1) and miR-145(A2) plasma levels in breast cancer patients (n=15) relative to normal. Correlation between miR223 and miR145 in these patients (B1). Logaritmic value of miR-223 expression level relative to miR-145 (B2). Statistically significant differences were determined using Wilcoxon tests.
Discussion
For miRNAs detection, direct methods including fluorescent, colorimetric, and electrical-based methods or indirect methods including northern blotting, microarray which are semi-quantitative, as well as RT-PCR can be applied. The sensitivity and discrimination power of direct methods are low (Hunt et al., 2009). Otherwise, miRNA assessment with isothermal methods is labor exhaustive (Cheng et al., 2009; Yao et al., 2009). At present, the broadly used and capable, accurate method for RNA measurement is real-time RT-PCR, but it is not cost effective and may also accompany with technical problems (Benes and Castoldi, 2010; Marabita et al., 2016). Therefore, improving the other reliable and sensitive miRNA detection has been more considered.
In the current study, we applied and improved the rapid and effective approach by coupling a deoxyuridine-incorporated RT oligonucleotide with a secondary structure and a mimic PCR for miRNAs quantification from serum which represented high efficiency and sensitivity for microRNA detection.
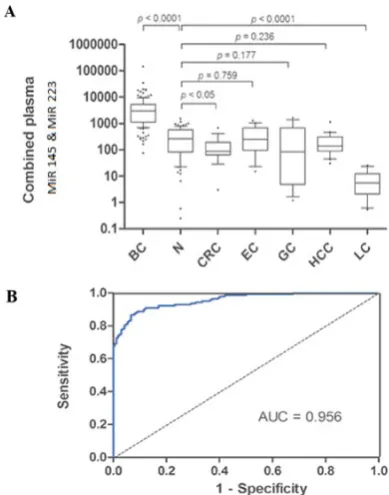
We have identified a significant alteration of the miR-16, miR-145, and miR-223 by this novel method of mimicking PCR for breast cancer prediction which yield in a ROC curve area of 96% (Fig. 5). The odds ratio for the cases with combined miR-145 and miR-223 level being associated with breast cancer was 44.2. The combination of plasma miR-16 and miR-145 levels provided the best markers for breast cancer prediction and yielded a ROC curve area of 96% previously, qRT-PCR was applied for miR-16 and miR-145 separately. This
demonstrates that a reduction of plasma miR-16 level occurred in breast cancer patients alone. But normalization miR-16 relative to external genes (mut miR-16) can be the best optimization.
105 Combination of miR-16 and miR-145 plasma levels is very specific to the breast cancer. Aberrant expression of plasma miR-16 in breast cancer patients supports the notion that miR-16 is not suitable for normalization (Davoren et al., 2008). Our study could detect miR-16 clearly as a constant standard. It also could detect normalization with mut miR-16 by mut plasmid, and because of this identification, our study may be unique. Thus, miR-16 can be used as an internal normalization control for miRNA quantitation by mimicking RT-PCR. In other studies of miRNAs in breast cancer diagnosis (Murakami et al., 2006; Kodahl et al., 2014; Zhao et al., 2014; Vilquin et al., 2015; Shimomura et al., 2016), a combination of miRNA markers were applied which were very specific only to breast cancer, but not other cancers such as gastric, lung and HCC. Interestingly, these plasma levels were significantly decreased in lung cancer when compared with breast cancer and even the normal control. When the sample size is small, validations in large cohort studies or in different ethnic groups is recommended.
It is uncertain whether this method of assessment is specific for certain subtypes of breast cancer. It is desirable to examine whether such plasma miRNAs would change in patients undertaking various treatments. In addition, plasmid calibration can greatly be changed (intention CV plasmid=0.9)
In conclusion, change of miR-16, miR-223, and miR-145 in plasma of breast cancer patients has been reported in this study for detecting acute metastasis of breast cancer. Noticeably, we showed that the plasma miR-145 level is reduced in breast cancer patients. The combination of miR-223 and miR-145 in our plasma quantitative assay could provide a very promising and specific breast cancer screening test. Although the sensitivity and specificity of these markers for breast cancer prediction is 90%, the positive predictive value was determined to be approximately 90% and the negative predictive value was approximately 92%. A combination of other potential markers using this plasma quantitation may further enhance the assessment discriminating ability in the future. We developed a simple technique for
miRNA analysis in blood serum. This method can be parallelized to quantitatively detect multiple miRNA-based biomarkers in different biological samples. In some countries, real-time PCR is used for screening and quantification. In Iran and developing countries, it could be used for screening and detection by miR-145 and miR-223 levels.
Because this plasmid is calibrated and normalized by real-time PCR, it can be used as an appropriate standard. The reference materials for analysis are not easily obtained. Several RMs have been developed by standard plasmid, and a series of these can be purchased from Fluka. However, the cost of these standard plasmids is very high, and the samples may degrade during use, so, this construct can be used in Qc-RT analysis instead of RM.
Real-time PCR is the most reliable technique, but it is an expensive method and additionally, needs qualified staff to set up the protocol. So, improved miR-based methods with optimized
multi-elements and reference genes
(housekeeping) can be used in order to detect multi–miRNA. Application of the methods introduced in this project can be used for diagnosis other novel miRNA markers.
The greatest advantage of this method is the greater sensitivity of these micro-RNA normalization relative to themselves, especially to housekeeping miR. Moreover, this method was able of detecting miRNAs as little as 1 pg.
References
Benes V, Castoldi M. 2010. Expression profiling of microRNA using real-time quantitative PCR, how to use it and what is available. Methods 50: 244-249.
Berindan-Neagoe I, Monroig Pdel C, Pasculli B, Calin GA. 2014. MicroRNAome genome: a treasure for cancer diagnosis and therapy. CA Cancer J Clin 64(5): 311-336.
Bonci D, De Maria R. 2016. miR-15/miR-16 loss, miR-21 upregulation, or deregulation of their target genes predicts poor prognosis in prostate cancer patients. Mol Cell Oncol 3: e1109744.
106 and miR-16-1 down-regulation in pituitary adenomas. J Cell Physiol 204: 280-285. Brooks M. 2009. Breast cancer screening and
biomarkers. Methods Mol Biol 472: 307-321. Cheng Y, Zhang X, Jiao X, Wang Y, Zhang Y.
2009. Highly sensitive determination of microRNA using target-primed and branched rolling-circle amplification. Angew Chem Int Ed Engl 48: 3268-3272.
Davoren PA, McNeill RE, Lowery AJ, Kerin MJ, Miller N. 2008. Identification of suitable endogenous control genes for microRNA gene expression analysis in human breast cancer. BMC Mol Biol 9: 76.
Duffy MJ. 2012. Tumor markers in clinical practice: a review focusing on common solid cancers. Med Princ Pract 22: 4-11.
Gu Y, Wang XD, Lu JJ, Lei YY, Zou JY, Luo HH. 2015. Effect of mir-16 on proliferation and apoptosis in human A549 lung adenocarcinoma cells. Int J Clin Exp Med 8: 3227-3233.
Han Q, Zhang HY, Zhong BL, Wang XJ, Zhang B, Chen H. 2016. MicroRNA-145 inhibits cell migration and invasion and regulates epithelial-mesenchymal transition (EMT) by targeting connective tissue growth factor (CTGF) in esophageal squamous cell carcinoma. Med Sci Monit 22: 3925-3934. Hossienzadeh Colagar A, Moradi Firouzjah H,
Halalkhor S. 2015. Vitamin D receptor poly (A)-microsatellite polymorphism and serum levels of 25-hydroxyvitamin D: association with susceptibility to breast cancer. J Breast Cancer 18(2):119-125.
Hui AB, Lenarduzzi M, Krushel T, Waldron L, Pintilie M, Shi W, Perez-Ordonez B, Jurisica I, O'Sullivan B, Waldron J, Gullane P, Cummings B, Liu FF. 2010. Comprehensive MicroRNA profiling for head and neck squamous cell carcinomas. Clin Cancer Res 16: 1129-1139.
Hunt EA, Goulding AM, Deo SK. 2009. Direct detection and quantification of microRNAs. Anal Biochem 387: 1-12.
Iorio MV, Croce CM. 2012. MicroRNA dysregulation in cancer: diagnostics, monitoring and therapeutics. A comprehensive review. EMBO Mol Med 4: 143-159.
Iorio MV, Visone R, Di Leva G, Donati V, Petrocca F, Casalini P, Taccioli C, Volinia S, Liu CG, Alder H, Calin GA, Ménard S, Croce CM. 2007. MicroRNA signatures in human ovarian cancer. Cancer Res 67: 8699-8707. Kazarian A, Blyuss O, Metodieva G,
Gentry-Maharaj A, Ryan A, Kiseleva EM, Prytomanova OM, Jacobs IJ, Widschwendter M, Menon U, Timms JF. 2017. Testing breast cancer serum biomarkers for early detection and prognosis in pre-diagnosis samples. Br J Cancer 116: 501-508.
Kodahl AR, Lyng MB, Binder H, Cold S, Gravgaard K, Knoop AS, Ditzel HJ 2014. Novel circulating microRNA signature as a potential non-invasive multi-marker test in ER-positive early-stage breast cancer: a case control study. Mol Oncol 8: 874-883.
Lan H, Lu H, Wang X, Jin H. 2015. MicroRNAs as potential biomarkers in cancer: opportunities and challenges. Biomed Res Int 2015: 125094.
Liang H, Yan X, Pan Y, Wang Y, Wang N, Li L, Liu Y, Chen X, Zhang CY, Gu H, Zen K. 2015. MicroRNA-223 delivered by platelet-derived microvesicles promotes lung cancer cell invasion via targeting tumor suppressor EPB41L3. Mol Cancer 14: 58.
Loberg M, Lousdal ML, Bretthauer M, Kalager
M. 2015. Benefits and harms of
mammography screening. Breast Cancer Res 17: 63.
Ma L, Teruya-Feldstein J, Weinberg RA. 2007. Tumour invasion and metastasis initiated by microRNA-10b in breast cancer. Nature 449: 682-688.
Ma L. 2010. Role of miR-10b in breast cancer metastasis. Breast Cancer Res 12: 210.
Marabita F, de Candia P, Torri A, Tegnér J, Abrignani S, Rossi RL. 2016. Normalization of circulating microRNA expression data obtained by quantitative real-time RT-PCR. Brief Bioinform 17: 204-212.
Mathe A, Scott RJ, Avery-Kiejda KA. 2015. MiRNAs and other epigenetic changes as biomarkers in triple negative breast cancer. Int J Mol Sci 16: 28347-28376.
Moon PG, Lee JE, Cho YE, Lee SJ, Jung JH, Chae YS, Bae HI, Kim YB, Kim IS, Park HY,
107 developmental endothelial locus-1 on circulating extracellular vesicles as a novel biomarker for early breast cancer detection. Clin Cancer Res 22: 1757-1766.
Murakami Y, Yasuda T, Saigo K, Urashima T, Toyoda H, Okanoue T, Shimotohno K. 2006. Comprehensive analysis of microRNA expression patterns in hepatocellular carcinoma and non-tumorous tissues.
Oncogene 25: 2537-2545.
Patnaik S, Patnaik, Sai Yendamuri, Eric Kannisto, John C. Kucharczuk, Sunil Singhal, Anil Vachani. 2012. MicroRNA expression
profiles of whole blood in lung
adenocarcinoma. PLoS One 7: e46045.
Raymond CK, Roberts BS, Garrett-Engele P, Lim LP, Johnson JM. 2005. Simple, quantitative primer-extension PCR assay for direct monitoring of microRNAs and short-interfering RNAs. RNA 11: 1737-1744.
Renjie W, Haiqian L. 2015. MiR-132, miR-15a and miR-16 synergistically inhibit pituitary tumor cell proliferation, invasion and migration by targeting Sox5. Cancer Lett 356: 568-578.
Schummer M, Thorpe J, Giraldez MD, Bergan L, Tewari M, Urban N. 2015. Evaluating serum markers for hormone receptor-negative breast cancer. PLoS One 10: e0142911.
Sharbati-Tehrani, S, Kutz-Lohroff B, Bergbauer R, Scholven J, Einspanier R. 2008. miR-Q: a novel quantitative RT-PCR approach for the expression profiling of small RNA molecules such as miRNAs in a complex sample. BMC Mol Biol 9: 34.
Shimomura A, Shiino S, Kawauchi J, Takizawa S, Sakamoto H, Matsuzaki J, Ono M, Takeshita F, Niida S, Shimizu C, Fujiwara Y, Kinoshita T, Tamura K, Ochiya T. 2016. Novel combination of serum microRNA for detecting breast cancer in the early stage. Cancer Sic 107: 326-334.
Sprague BL, Stout NK, Schechter C, van Ravesteyn NT, Cevik M, Alagoz O, Lee CI, van den Broek JJ, Miglioretti DL, Mandelblatt JS, de Koning HJ, Kerlikowske K, Lehman CD, Tosteson AN. 2015. Benefits, harms, and
cost-effectiveness of supplemental
ultrasonography screening for women with dense breasts. Ann Intern Med 162: 157-166.
Stearns V. 2016. Novel biomarkers in the continuum of breast cancer. Anticancer Res 36: 3224.
Stout NK, Stout NK, Lee SJ, Schechter CB, Kerlikowske K, Alagoz O, Berry D, Buist DS, Cevik M, Chisholm G, de Koning HJ, Huang H, Hubbard RA, Miglioretti DL, Munsell MF, Trentham-Dietz A, van Ravesteyn NT, Tosteson AN, Mandelblatt JS. 2014. Benefits, harms, and costs for breast cancer screening after US implementation of digital mammography. J Natl Cancer Inst 106: dju092.
van Schooneveld E, Wildiers H, Vergote I, Vermeulen PB, Dirix LY, Van Laere SJ. 2015. Dysregulation of microRNAs in breast cancer and their potential role as prognostic and predictive biomarkers in patient management. Breast Cancer Res 17: 21.
Vilquin P, Donini CF, Villedieu M, Grisard E, Corbo L, Bachelot T, Vendrell JA, Cohen PA. 2015. MicroRNA-125b upregulation confers aromatase inhibitor resistance and is a novel marker of poor prognosis in breast cancer. Breast Cancer Res 17: 13.
Wan G, Lim QE, Too H.P. 2010. High-performance quantification of mature microRNAs by real-time RT-PCR using deoxyuridine-incorporated oligonucleotides and hemi-nested primers. RNA 16: 1436-1445. Yang M, Chen J, Su F, Yu B, Su F, Lin L, Liu
Y, Huang JD, Song E. 2011. Microvesicles secreted by macrophages shuttle invasion-potentiating microRNAs into breast cancer cells. Mol Cancer 10: 117.
Yao B, Li J, Huang H, Sun C, Wang Z, Fan Y, Chang Q, Li S, Xi J. 2009. Quantitative analysis of zeptomole microRNAs based on isothermal ramification amplification. RNA 15: 1787-1794.
Zhao FL, Dou YC, Wang XF, Han DC, Lv ZG, Ge SL, Zhang YK. 2014. Serum microRNA-195 is down-regulated in breast cancer: a potential marker for the diagnosis of breast cancer. Mol Biol Rep 41: 5913-5922.
108 Zhu Y, Guo M, Zhang L, Xu T, Wang L, Xu G.
2016. Biomarker triplet NAMPT/VEGF/HER2 as a de novo detection panel for the diagnosis