April 2013, Volume 2 Number 1, 3-20
Exploring the Quality Function Deployment method:
A case study on the restaurant industry in Taiwan
Wang, Wen Sheng
Graduate School of Business and Management, Lunghwa University of Science and Technology, Taiwan, ROC ([email protected])
Received: 18 June 2012 Revised: 2 July 2012 Accepted: 25 July 2012
Available Online: 1 August 2012 DOI: 10.5861/ijrsm.2012.160
ISSN: 2243-7770 Online ISSN: 2243-7789
OPEN ACCESS
Abstract
Economic development is always one of the most crucial issues being discussed in the world,
which various industries are directly involved such as: agriculture, commerce, and recently
the so-called Hi-Technology (Information Technology). With the notion that industry
competition could brought about developments, such as improved product, cost cutting, and
shortening of the time to market. Companies are continuously looking into what strategies
that is beneficial and less risky. In Taiwan, the current economic situations have caused people
to exert even more time and effort in earning money. Such phenomenon sparks the high
frequency of eating out (or dining out). In addition, the current low birthrate situation in
Taiwan, people tends to spend more money on leisure and less time at home. Hence, the
restaurant industry has become quite demanding. The current study shall utilize the Quality
Function Deployment (QFD) method and the matrix House of Quality (HOQ), to evaluate and
analyze the trade-off decisions between service quality and customer satisfaction in Taiwan’s
restaurant industry. Recommendations and implications are then given to aid future
researchers on similar areas of studies.
Wang, W. S.
Exploring the Quality Function Deployment method: A case study on the restaurant
industry in Taiwan
1. Introduction
In recent years, Taiwanese economy is attaining higher development. Obviously, the economic development has also enhanced the national annual average income to higher levels. Such events have pushed Taiwanese traditional agriculture industry into a more commercial model; especially within the service industries. Based on the data stated by Directorate General of Budget, Accounting and Statistics (DGBAS, 2012), Taiwan exhibits that the current ratio of gross of domestic product (GDP) has increased from 67.08% (in 2004) to 69.45% (in 2011). Besides, the Department of Statistics, Ministry of Economic Affairs (MEA, 2012) also stated that the annual rate of change (ARC) in restaurant is from 1.82% (in 2008) and increased to 7.94% (in 2011). It appears there is much change that is happening in the current Taiwan economic development.
Just these few years, the Taiwan government formulated a new holiday policy which has been promoted by the media with regards to the concept of leisure. People have started to notice the demand of leisure activities in human life. More so, with the increased GDP have caused people to get more chance of work, more money to shop; hence, people have more chance of dining or eating out. According to Shiu (2007) people who are dining out in Taiwan has almost reach 3.3 million each day and it is still increasing. Thus, we can say that the restaurant (food) industry is quite promising.
1.1 Research motivation
People who lived in Taiwan are quite susceptible to the concept of leisure activities, more so with the current high economic development. Consequently, people are quite cautious with the issue of physiological needs in daily life. Maslow (1943) mentioned the hierarchy of needs, which is focus on the physiological needs, safety needs, belongingness needs (social needs), esteem needs, and self-actualization. Maslow believed that within these human needs, food is the most basic of them all. Thus, physiological needs are the most dominant of all the other needs.
For Taiwan people, dining in restaurants is not only considered for physiological needs, but also takes into account the multifunctional factors in restaurants. For instance, people like to have a meeting in restaurant, people like to development relationship in restaurant, and people like to have a party in restaurant. These are actually caused by market demands, which is the extension beyond the basic physiological needs of daily life. Similarly, the restaurants industry managers have to reconsider the issue of firm performance by means of the responses in customer service. Furthermore, restaurants need to provide a changeable and renewable menu that could attract returning customers. Moreover, manager has to contribute to quality meal and expert services, in order to meet the market demands that lead to building up the competitive advantages of restaurant industry in Taiwan.
1.2 Research objectives
Exploring the Quality Function Deployment method: A case study on the restaurant industry in Taiwan
strategies, purchasing, and ethnic environments, in order to evaluate the business performance. In essence, the current study shall utilize the Quality Function Deployment (QFD) method and the matrix House of Quality (HOQ), to evaluate and analyze the trade-off decisions between service quality and customer satisfaction in Taiwan’s restaurant industry. Recommendations and implications are then given to aid future researchers on similar areas of studies.
2. Literature review
In 2004, the Ministry of Economic Affairs (MEA); which is focused on enhancing the purpose of well-development economic system, emphasizes the promotion of service quality to comply with the global economic development. Hence, the government formulated the policy of certificate to Good Service Practice (GSP). This project includes the various activities such as: organization leadership, strategy management, customer satisfy, information analysis, human resource, equipment and instrument management, environment facility security management, service processing management, social responsibility, internal audit, and business performance.
MEA stated that the turnover of restaurant industry in 2010 was NT$ 344.7 billion. It is believed that the restaurant industry is quite promising for young entrepreneur. Therefore, restaurants of the same types are quickly being saturated; managers have to create an innovative menu and enhance their customization services in order to increase their competitive advantage and market share. Besides, people have lots of choices to have food in restaurants; people have multiple choices of food by menu. This trend has been explained that people could have the cognition subjectively, which resulted from the restaurant environment, employee service, material quality, and material sourcing. However, this study is shall be concentrated on the research of service quality and customers satisfaction.
2.1 Service Quality
Researchers Cronin and Taylor (1992) stated that the so-called service-quality means the notion of customers evaluating the level of service in a subjective cognitive way. Furthermore, service-quality is a method, which customers perceived as a good feeling in services. Besides, Parasuraman, Zeithaml, and Berry (1988) argued that service-quality is an evaluation to which customers recognized the service performance in person. They created a criterion named SERVQUAL (please see Table 1) to evaluate service quality, which are used to apply in the service industry very popular. However, in 1994, they modified the criteria to meet the customer perceived quality service. Cronin and Taylor (1992) mentioned that the criterion SERVQUAL will be challenged by satisfaction and attitude.
Table 1
Dimensions of SERVQUAL
Dimension Definition Number of items
Tangibles Physical facilities, equipment, and appearance of personnel 4 Reliability Ability to perform the promised service dependably and
accurately
5
Responsiveness Willingness to help customers and provide prompt service 4 Assurance Knowledge and courtesy of employees and their ability to
inspire trust and confidence
4
Empathy Caring, individualized attention the firm provides its customers
5
Source. Parasuraman, Zeithaml, and Berry (1988)
Wang, W. S.
location includes ambient conditions, facility aesthetics, layout, electronic equipment, and seating comfort. In short, the different definitions and criteria were created by many researchers. However, Buttle (1996); Carman (1990) argued that SERVQUAL (Parasuraman et al., 1988) has been widely used in research studies across a range of service industries. This study adapted the SERVQUAL and ruled out the other models to evaluate the service quality in the restaurant industry of Taiwan.
2.2 Customer Satisfaction
Since service quality is evaluated by customers, it is expected to judge the service function whether to meet with the customer expectation or not. Thus, Huang and Fu (2004) mentioned that customer satisfaction is resulted from their shopping experiences, which is accumulated by the customer subjective evaluation and emotional cognition. Bitner and Mohr (1995) argued that satisfaction will be affected by service outcome which is held constant. Furthermore, the more customer cognized the value than preceding expectation, customer will be satisfy. On the contrary, the less customer cognized the value than preceding expectation, customer will feel more dissatisfaction (Churchill & Surprenant, 1982; Tse & Wilton, 1988).
Zeithaml, Berry, and Parasuraman (1988) and Kolter (1996) argued that satisfaction is an extent of one who cognized the pleasant or displeasing. When customer cognized the value exceeded the preceding expectation they had, the customer will cognize to the satisfaction. In the other words, when customer cognized the value is lower than the preceding expectation they had, the customers will cognize to dissatisfaction (Wen, 2002). Oliver (1980) pointed that satisfaction is the preceding variable of attitude. That means the first attitude of customers who shopped the product was based on the expectation, after that, attitude will be adjusted by shopping experiences based on the satisfaction.
Kolter (1996) referred many researchers’ opinions that indicated satisfaction is the differential equation between the function of cognition and expectation. Hence, customer satisfaction is resulted from customer who cognized the products by special function and feedback. In the other words, the special function did not meet the customer expectation, customer will cognize dissatisfaction. Fornell (1992) mentioned that customer can evaluate the cognition directly by compelling the product value, service level with its standard ideal. Hence, customer could be changing their satisfaction in service level through the different period of compelling and cognition.
It is believed that the issue of customer satisfaction can enhancing the restaurant competitive advantage, and it is the crucial factors to affect the customer shopping repeatedly (Liang, 2001). However, how to evaluate restaurant service using criterion to force industry enhancing the competitive advantage and service quality, this is the key point to win the market share, it is the best strategy in marketing as well (Tseng, 2005). This study referred the researchers modified the dimensions of customer satisfaction below (please see Table 2):
Table 2
Dimensions of customer satisfaction
Dimension Items
Customer satisfaction The service at this facility provides value The service at this facility is effective The service at this facility is efficient I am satisfied with service at this facility
Source. Caruana, Money, and Berthon (200); Kotler (1996)
2.3 Service quality and customer satisfaction
Exploring the Quality Function Deployment method: A case study on the restaurant industry in Taiwan
gain the service and the personal cognition after service. The PZB analysis result showed that the higher service quality means the customer cognition higher than customer expectation; on the contrary, the lower service quality means the customer expectation higher than customer cognition.
The relationship between service quality and customer satisfaction which stated by PZB that the differential is customer satisfaction generated from the comparing prediction and cognitive service, while service quality is generated from expected and cognitive service. Lewis and Booms (1983) argued that there are different essences between predicted and expected such like, the expected of service quality is customer wants or desires the service offered by enterprise. Similarly, the predicted of customer satisfaction is customer predicts the service offered by enterprise.
Based on the PZB model, criterion has been designed to explore the gap between customer expectation and cognition in service quality. Thus, the PZB model is explaining how service industry provided service quality without satisfied to customer while emphasizing the customer is played a key role in service quality as well. This study, hence, expected to explore the evaluation of service quality in customer personal cognition and the relationship between service quality and customer satisfaction in restaurant industry through the PZB model.
3. Research methodology
3.1 Quality function deployment (QFD)
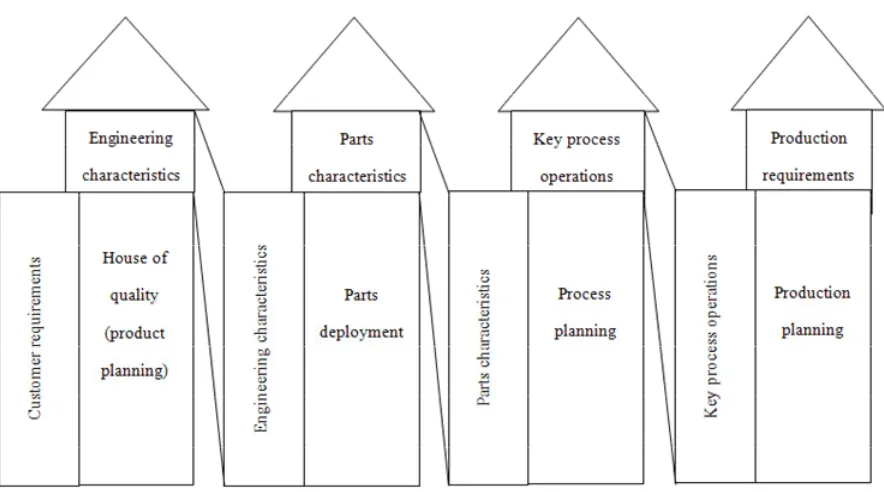
Quality Function Deployment (QFD) was originated in Japan, and then developed in 1972. QFD intend to transform customer requirements into engineering characteristics, parts characteristics, key process operations, and production requirements sequentially. The transformation requires a series of matrices or so-called houses in four phases of a customary QFD as given in figure 1 (Bossert, 1991).
Wang, W. S.
The basic concept is using a series of houses to transform qualitative requirements into quantitative specifications. The House of Quality (HOQ) is the most crucial of QFD (Bergquist & Abeysekera, 1996). Figure 2 shows a standard structure of HOQ.
Figure 2. General House of Quality (HOQ) (Bergquist & Abeysekera, 1996)
HOQ consists of the following six elements (Bossert, 1991):
1. Customer requirements (WHATs) are one of the most important cause and effect relation that QFD can be resulted by the process since organized to proper classifications;
2. Planning matrix (WHY) are related by means of customer requirements and the customer’s satisfaction levels;
3. Technical or engineering characteristics (HOWs) are showed the customer requirements which transforming qualitative requirements into quantitative characteristics;
4. Relationship matrix is indicated the relationship of the HOW and the WHAT;
5. Correlation matrix shows the individual HOWs to obtain the trade-offs relationship with other various engineering parameters; and
Exploring the Quality Function Deployment method: A case study on the restaurant industry in Taiwan
In addition, the crucial profits of using QFD are stated by ASI (1992), Govers (1996), Griffin (1992), Hauser (1993), and Sullivan (1986) that:
QFD can help companies to consider the cost between customers demands and affordable producing factors;
QFD can enhance effectively communication between company divisions and team member;
QFD can increase customer satisfaction by the product development process;
QFD takes into account the data required and the product development; and
QFD can shorten logistic time-to-market.
The application of QFD in the restaurant industry is quite limited in the current literature especially in Taiwan. Only a few articles claimed that QFD is a proper and probable method to ease the restaurant product development process. Thus, the applications of QFD have a much more possibility of development and application (Costa, Dekker, & Jongen, 2000). Hence, this study shall be utilized as an exemplar on actual industry in Taiwan.
3.2 Sampling and respondents
Restaurant A was located in Taipei city which closed to the subway station, business center, night market, and school. There are many visitors to get shopping over this district especially in holiday, it conducted 300~500 customers/day in weekday, 900~1500 customers/day in weekend which people dine in sample restaurant. The space of this sample size is 900 m2, a total of 50 employees are working in this restaurant, and the menu was designed to provide a special Taiwanese traditional food for customers.
Respondents are communicated to the sample restaurant to get the basic information and visit the 20 respondents: 2 are managers, 5 are employees who are working in this restaurant; besides; they have more than 5 years work experience in the restaurant industry. While, the remaining 13 are customers who have more than 10 times of dining experiences in this restaurant.
3.3 Questionnaires
Based on the literatures stated that service quality and customer satisfaction associate the relationship, referred the criterion factors that formed to the questionnaire (translated to Chinese). The extent of effects between two factors which referred to Likert Scale method by numbered in 1~5 (1: no significant, 2: low significant, 3: significant, 4: high significant, and 5: very high significant) based on the factors compelling between the service quality and customer satisfaction criteria.
Wang, W. S.
3.4 Criteria
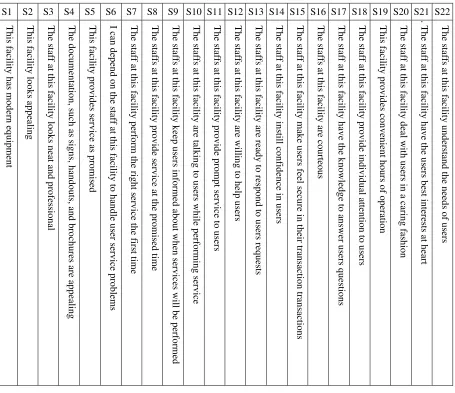
3.4.1 Criteria of SERVQUAL
Table 3
Criteria of SERVQUAL
Original PZB Dimension (1985)
Modified PZB
Dimension (1988) Items
Tangibles Tangibles 1. This facility has modern equipment
2. This facility looks appealing
3. The staff at this facility looks neat and professional 4. The documentation, such as signs, handouts, and brochures are
appealing
Reliable Reliable 5. This facility provides service as promised
6. I can depend on the staff at this facility to handle user service problems
7. The staff at this facility perform the right service the first time 8. The staffs at this facility provide service at the promised time 9. The staffs at this facility keep users informed about when services will be performed
Responsiveness Communication
Responsiveness 10. The staffs at this facility are talking to users while performing service
11. The staffs at this facility provide prompt service to users 12. The staffs at this facility are willing to help users
13. The staffs at this facility are ready to respond to users’ requests Credibility
Security Competence Courtesy
Assurance items 14. The staff at this facility instill confidence in users 15. The staff at this facility make users feel secure in their transactions
16. The staffs at this facility are courteous
17. The staff at this facility have the knowledge to answer users’ questions
Understanding Access
Empathy items 18. The staff at this facility provide individual attention to users 19. This facility provides convenient hours of operation 20. The staff at this facility deal with users in a caring fashion 21. The staff at this facility have the users’ best interests at heart 22. The staffs at this facility understand the needs of users
Source. Parasuraman, Zeithaml, and Berry (1988)
3.4.2 Criteria for Customer Satisfaction
Table 4
Criteria of Customer Satisfaction
Dimensions Items
Customer satisfaction
1. I am pleased to dine in this restaurant
2. I am satisfied the service of this restaurant offering 3. This is a wise chosen to dine in this restaurant 4. I never regret to dine in this restaurant
Sources. Modified from Caruana, Money, & Berthon, 2000; Kotler (1996)
3.5 Method of QFD
Exploring the Quality Function Deployment method: A case study on the restaurant industry in Taiwan
Table 5
Matrix of service quality and customer satisfaction
S1 S2 S3 S4 S5 S6 S7 S8 S9 S10 S11 S12 S13 S14 S15 S16 S17 S18 S19 S20 S21 S22
T h is fa ci lit y h as m o d er n e q u ip m en t T h is fa ci lit y lo o k s a p p ea lin g T h e s ta ff a t t h is fa ci lit y lo o k s n ea t a n d p ro fe ss io n al T h e d o cu m en ta tio n , s u ch a s s ig n s, h an d o u ts , a n d b ro ch u re s a re a p p ea lin g T h is fa ci lit y p ro v id es s er v ic e a s p ro m is ed I c an d ep en d o n th e sta ff a t t h is fa ci lit y to h an d le u se r s er v ic e p ro b le m s T h e s ta ff a t t h is fa ci lit y p er fo rm th e r ig h t s er v ic e t h e f irs t t im e T h e s ta ff s a t t h is fa ci lit y p ro v id e se rv ic e a t t h e p ro m is ed ti m e T h e s ta ff s a t t h is fa ci lit y k ee p u se rs in fo rm ed a b o u t w h en s er v ic es w ill b e p er fo rm ed T h e s ta ff s a t t h is fa ci lit y a re ta lk in g to u se rs w h ile p er fo rm in g s er v ic e T h e s ta ff s a t t h is fa ci lit y p ro v id e p ro m p t s er v ic e t o u se rs T h e s ta ff s a t t h is fa ci lit y a re w ill in g to h el p u se rs T h e sta ff s a t t h is fa ci lit y a re re ad y to re sp o n d to u se rs re q u es ts T h e s ta ff a t t h is fa ci lit y in sti ll co n fid en ce in u se rs T h e s ta ff a t t h is fa ci lit y m ak e u se rs fe el s ec u re in th ei r t ra n sa ct io n s T h e sta ff s a t t h is fa ci lit y a re c o u rte o u s T h e s ta ff a t t h is fa ci lit y h av e t h e k n o w le d g e t o a n sw er u se rs q u es tio n s T h e s ta ff a t t h is fa ci lit y p ro v id e in d iv id u al a tte n tio n to u se rs T h is fa ci lit y p ro v id es c o n v en ie n t h o u rs o f o p er at io n T h e s ta ff a t t h is fa ci lit y d ea l w ith u se rs in a c ar in g fa sh io n . T h e sta ff a t t h is fa ci lit y h av e t h e u se rs b es t i n te re sts a t h ea rt T h e s ta ff s a t t h is fa ci lit y u n d er st an d th e n ee d s o f u se rs
C1 I am pleased to dine in this restaurant
C2 I am satisfied the service of this restaurant
offering
C3 This is a wise chosen to dine in this restaurant
C4 I never regret to dine in this restaurant
The process of exploring of QFD is achieved through the following phases:
Phase 1: Computed and resulted the average from the important extent of service quality (S1-S22) items (please see Table 6).
Phase 2: Computed and resulted the average from the important extent of customer satisfaction (C1-C4) items (please see Table 7).
Phase 3: Computed and resulted the average from relation between service quality (S1-S22) and customer satisfaction (C1-C4) matrix (please see Table 5).
Phase 4: Computed and resulted the average from the interrelationship of service quality (S1-S22) items (please see Table 6).
Wang, W. S.
Table 6
Items of service quality (S1-S22)
S1 S2 S3 S4 S5 S6 S7 S8 S9 S10 S11 S12 S13 S14 S15 S16 S17 S18 S19 S20 S21 S22
T h is fa ci lit y h as m o d er n e q u ip m en t T h is fa ci lit y lo o k s a p p ea lin g T h e sta ff a t t h is fa ci lit y lo o k s n ea t a n d p ro fe ss io n al T h e d o cu m en ta tio n , s u ch a s s ig n s, h an d o u ts , a n d b ro ch u re s a re a p p ea lin g T h is fa ci lit y p ro v id es s er v ic e as p ro m is ed I c an d ep en d o n th e s ta ff a t t h is fa ci lit y to h an d le u se r s er v ic e p ro b le m s T h e sta ff a t t h is fa ci lit y p er fo rm th e rig h t s er v ic e th e fir st tim e T h e sta ff s a t t h is fa ci lit y p ro v id e se rv ic e at th e p ro m is ed ti m e T h e sta ff s a t t h is fa ci lit y k ee p u se rs in fo rm ed a b o u t w h en s er v ic es w ill b e p er fo rm ed T h e sta ff s a t t h is fa ci lit y a re ta lk in g to u se rs w h ile p er fo rm in g s er v ic e T h e sta ff s a t t h is fa ci lit y p ro v id e p ro m p t s er v ic e to u se rs T h e sta ff s a t t h is fa ci lit y a re w ill in g to h el p u se rs T h e sta ff s a t t h is fa ci lit y a re re ad y to re sp o n d to u se rs re q u es ts T h e sta ff a t t h is fa ci lit y in sti ll co n fid en ce in u se rs T h e sta ff a t t h is fa ci lit y m ak e u se rs fe el s ec u re in th ei r t ra n sa ct io n tr an sa ct io n s T h e sta ff s a t t h is fa ci lit y a re c o u rte o u s T h e sta ff a t t h is fa ci lit y h av e th e k n o w le d g e to a n sw er u se rs q u es tio n s T h e sta ff a t t h is fa ci lit y p ro v id e in d iv id u al a tte n tio n to u se rs T h is fa ci lit y p ro v id es c o n v en ie n t h o u rs o f o p er at io n T h e sta ff a t t h is fa ci lit y d ea l w ith u se rs in a c ar in g fa sh io n . T h e sta ff a t t h is fa ci lit y h av e t h e u se rs b es t i n te re sts a t h ea rt T h e sta ff s a t t h is fa ci lit y u n d er sta n d th e n ee d s o f u se rs Table 7
Items of customer satisfaction (C1-C4)
C1 I am pleased to dine in this restaurant
C2 I am satisfied the service of this restaurant offering
C3 This is a wise chosen to dine in this restaurant
C4 I never regret to dine in this restaurant
4. Results
4.1 Phase 1: The important degree of service quality
Exploring the Quality Function Deployment method: A case study on the restaurant industry in Taiwan
Table 8
Items in average of service quality
Items S1 S2 S3 S4 S5 S6 S7 S8 S9 S10 S11 S12 S13 S14 S15 S16 S17 S18 S19 S20 S21 S22
Average Scores
3
.3
7
5
3
.7
5
3
.8
7
5
3
.2
5
4
.6
2
5
4
.7
5
4
.6
2
5
4
.5 3.12
5
4
.0
0
4
.3
7
5
4
.3
7
5
4
.3
7
5
4
.3
7
5
4
.6
2
5
4
.5 4.00 3.12
5
4
.2
5
4
.0
0
3
.5 3.75
Important Index
Score 1 2 3 1 5 5 5 5 1 3 4 4 4 4 5 5 3 1 4 3 2 2
Table 8.1
The important degree of service quality
Important degree range Important degree score
3.125 ~ 3.44 1
3.45 ~ 3.783 2
3.784 ~ 4.118 3
4.119 ~ 4.452 4
4.453 ~ 4.75 5
4.2 Phase 2: The important degree of customer satisfaction
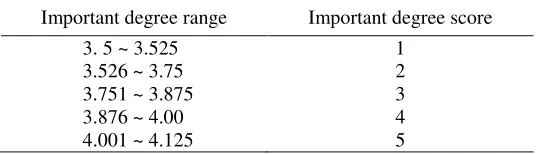
Computing and average weighting the sum of the data collected in parts of customer satisfaction which resulted in Table 9. In addition, the maximum data (4.125) minus the minimum data (3.5) and divided 5 to obtain the average range (0.125), plus the average range subsequently to the 5 levels which conducted to the important degree (please see Table 9.1). Thus, based on the important degree range, the score meanwhile has been showed in Table 9.
Table 9
Items in average of customer satisfaction
Items Average Scores Important degree score
C1 4.00 4
C2 4.125 5
C3 3.5 1
C4 3.875 3
Table 9.1
The important degree of customer satisfaction
Important degree range Important degree score
3. 5 ~ 3.525 1
3.526 ~ 3.75 2
3.751 ~ 3.875 3
3.876 ~ 4.00 4
Wang, W. S.
satisfaction matrix which resulted in Table 10.
Table 10
Data of relation in average of service quality and customer satisfaction
S1 S2 S3 S4 S5 S6 S7 S8 S9 S10 S11 S12 S13 S14 S15 S16 S17 S18 S19 S20 S21 S22
C1 3.7 3.9 4.5 4.1 4.1 4.2 3.9 3.9 3.4 3.5 3.6 3.9 3.9 4 3.8 4 3.9 3.7 3.5 3.8 3.6 3.5
C2 3.5 3.7 4.2 4 4.3 4.5 4.1 4 4 3 4 3.8 3.6 3.8 4 3.5 3.9 3.7 3.6 4 3.5 3.9
C3 4 4 4 4.2 4 4.2 3.9 4 3.2 3.5 3.8 3.6 3.9 3.7 3.9 4 4 3.2 4 3.5 3.5 4
C4 3.8 3.8 3.7 3.7 4.4 4.1 4.3 4 3.6 3.7 4.1 3.6 3.9 4 4 4 3.7 3.6 4 3.6 3.6 4.3
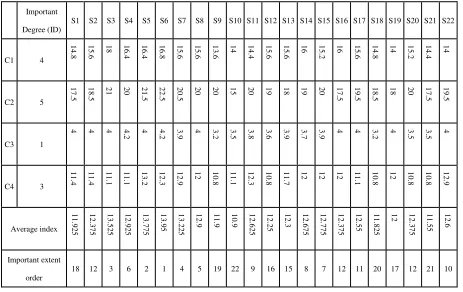
In addition, based on the data of relation in average of service quality and customer satisfaction (Table 10), this study further measured with the important degree score of customer satisfaction (Table 9) to explore the effect of result while input the customer satisfaction in important degree. Formulation comes from the average of ID1-4 × Sn, results showed in Table 10.1.
Table 10.1
The important degree to the customer satisfaction in service quality
Important
Degree (ID)
S1 S2 S3 S4 S5 S6 S7 S8 S9 S10 S11 S12 S13 S14 S15 S16 S17 S18 S19 S20 S21 S22
C1 4
1 4 .8 1 5 .6 1
8 16
.4 1 6 .4 1 6 .8 1 5 .6 1 5 .6 1 3 .6 1
4 14
.4 1 5 .6 1 5 .6 1
6 15
.2
1
6 15
.6
1
4
.8
1
4 15
.2 1 4 .4 1 4
C2 5
1 7 .5 1 8 .5 2
1 20 21
.5 2 2 .5 2 0 .5 2
0 20 15 20 91 18 19 20 17
.5 1 9 .5 1 8 .5 1
8 20 17
.5
1
9
.5
C3 1
4 4 4 4
.2 4 4.2 3.9 4 3.2 3.5 3.8 3.6 3.9 3.7 3.9 4 4 3.2 4 3.5 3.5 4
C4 3
1 1 .4 1 1 .4 1 1 .1 1 1 .1 1 3 .2 1 2 .3 1 2 .9 1
2 10
.8 1 1 .1 1 2 .3 1 0 .8 1 1 .7 1
2 12 12 11
.1
1
0
.8
1
2 10
.8 1 0 .8 1 2 .9 Average index 1 1 .9 2 5 1 2 .3 7 5 1 3 .5 2 5 1 2 .9 2 5 1 3 .7 7 5 1 3 .9 5 1 3 .2 2 5 1 2 .9 1 1 .9 1 0 .9 1 2 .6 2 5 1 2 .2 5 1 2 .3 1 2 .6 7 5 1 2 .7 7 5 1 2 .3 7 5 1 2 .5 5 1 1 .8 2 5 1
2 12
.3 7 5 1 1 .5 5 1 2 .6 Important extent order
18 12 3 6 2 1 4 5 19 22 9 16 15 8 7 12 11 20 17 12 21 10
4.4 Phase 4: The interrelationship of service quality
Exploring the Quality Function Deployment method: A case study on the restaurant industry in Taiwan
Table 11
Matrix in average of the interrelationship of service quality
S1 S2 S3 S4 S5 S6 S7 S8 S9 S10 S11 S12 S13 S14 S15 S16 S17 S18 S19 S20 S21 S22
S1 1 3.5 3.2 3.5 3.8 3.6 3.4 3.7 3.9 3.1 4 3.7 3.4 3.4 3.8 3.5 3.2 3.4 3.5 3.7 3.7 3.9
S2 3.5 1 3.5 3.4 3.6 2.9 3.3 3 3.6 3.4 3.9 3.6 3.7 3.5 3.5 3.5 3.2 3 3.5 3.2 3.2 3.6
S3 3.2 3.5 1 2.9 3.7 3.5 3.5 3.7 3.7 3.1 4.1 3.5 3.7 4 4 4 3.4 3.6 2.8 3.7 3.5 4
S4 3.5 3.4 2.9 1 3.5 3.2 3.5 3.3 3.3 3 3.6 3.5 3.2 3.5 3.5 3.8 3.8 3.4 3.4 3.3 3.1 3.8
S5 3.8 3.6 3.7 3.5 1 3.9 3.7 3.3 3.5 3.2 4.1 3.9 3.8 4 3.5 4.2 3.8 3.7 3.9 4 4.2 4.1
S6 3.6 2.9 3.5 3.2 3.9 1 3.9 4.1 3.6 3.1 3.8 3.9 3.9 4.1 3.5 3.8 3.7 4.1 3.8 3.8 3.9 4.1
S7 3.4 3.3 3.5 3.5 3.7 3.9 1 3.3 3.6 3.5 3.3 3.7 4.2 4.1 3.9 4.1 4.3 4 3.7 3.6 4.3 4.1
S8 3.7 3 3.7 3.3 3.3 4.1 3.3 1 3.8 3.1 3.6 3.4 3.9 3.8 3 4 3.7 3.4 3.6 3.9 4.1 3.9
S9 3.9 3.6 3.7 3.3 3.5 3.6 3.6 3.8 1 3.9 3.7 3.5 4.1 3.5 3.8 4.2 3.8 3.6 3.7 4.2 3.8 4
S10 3.1 3.4 3.1 3 3.2 3.1 3.5 3.1 3.9 1 3.4 3.6 3.8 3.4 3.6 3.6 3.6 3.4 3.6 3.6 3.6 3.8
S11 4.2 3.9 4.1 3.6 4.1 3.8 3.3 3.6 3.7 3.4 1 3.3 3.7 3.5 3.2 3.6 3.9 3.3 3.6 3.8 3.7 4
S12 3.7 3.6 3.5 3.5 3.9 3.9 3.7 3.4 3.5 3.6 3.3 1 3.7 4.1 3.8 3.7 3.5 3.5 3.9 3.9 4.1 4
S13 3.4 3.7 3.7 3.2 3.8 3.9 4.2 3.9 4.1 3.8 3.7 3.7 1 3.7 3.6 4 3.5 3.6 3.2 3.8 4.1 4
S14 3.4 3.5 4 3.5 4 4.1 4.1 3.8 3.5 3.4 3.5 4.1 3.7 1 3.8 3.7 3.7 3.5 3.7 3.8 3.7 3.9
S15 3.8 3.5 4 3.5 3.5 3.5 3.9 3 3.8 3.6 3.2 3.8 3.6 3.8 1 3.8 3.5 3.7 3.6 3.5 3.8 4
S16 3.5 3.5 4 3.8 4.2 3.8 4.1 4 4.2 3.6 3.6 3.7 4 3.7 3.8 1 4.3 3.8 3.5 3.4 4 3.6
S17 3.2 3.2 3.4 3.8 3.8 3.7 4.3 3.7 3.8 3.6 3.9 3.5 3.5 3.7 3.5 4.3 1 3.6 3.6 3.6 3.4 3.7
S18 3.4 3 3.6 3.4 3.7 4.1 4 3.4 3.6 3.4 3.3 3.5 3.6 3.5 3.7 3.8 3.6 1 3.6 3.1 3.6 4.1
S19 3.5 3.5 2.8 3.4 3.9 3.8 3.7 3.6 3.7 3.6 3.6 3.9 3.2 3.7 3.6 3.5 3.6 3.6 1 3.9 4.1 4
S20 3.7 3.2 3.7 3.3 4 3.8 3.6 3.9 4.2 3.6 3.8 3.9 3.8 3.8 3.5 3.4 3.6 3.1 3.9 1 3.8 3.8
S21 3.7 3.2 3.5 3.1 4.2 3.9 4.3 4.1 3.8 3.6 3.7 4.1 4.1 3.7 3.8 4 3.4 3.6 4.1 3.8 1 3.8
S22 3.9 3.6 4 3.8 4.1 4.1 4.1 3.9 4 3.8 4 4 4 3.9 4 3.6 3.7 4.1 4 3.8 3.8 1
4.5 Phase 5: The interrelationship of customer satisfaction
Computing and average weighting the sum of the data collected in parts of the interrelationship of customer satisfaction which resulted in Table 12.
Table 12
Matrix in average of the interrelationship of customer satisfaction
C1 C2 C3 C4
C1 1 4.40 4.50 4.40
C2 4.40 1 4.20 4.30
Wang, W. S.
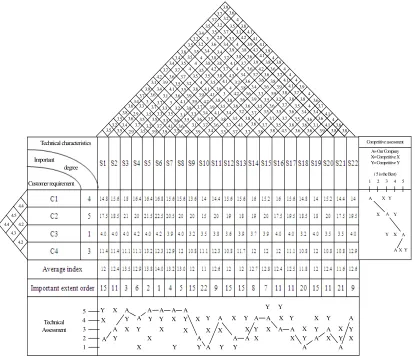
4.6 House of QFD
Based on the data collected from the above tables, this study concludes to establish the House of Quality (HOQ) (please see Figure 3), which is extended from Bergquist and Abeysekera (1996) model (please see Figure 2).
Figure 3. Extended HOQ Model
This study explains the extended HOQ (House of Quality) Model below:
Customer requirements (WHAT) showed on the left part of this model that included the important degree and its correlation in customer satisfaction (please see Tables 9 and 12).
Planning matrix (WHY) showed on the right part that can be used for assessment sample restaurant (A) and competitors (X) and (Y) in beneficial advantage (further research).
Technical characteristics (HOW) showed by S1-S22 which are items for service quality (please see Table 6).
Relationship matrix (WHAT vs. HOW) showed that the relationship between service quality and customer service (please see Table 10).
Correlations on the middle part showed that service quality items S1-S22 were assessment the correlation in one and another (please see Table 11).
Technical characteristic importance rankings that on the bottom of this model which was the 3.5 3.5 3.5 3.5 3.5 3.5 3.5 3.5 3.5 3.5 3.5 3.5 3.5 3.5 3.5 3.5 3.5 3.5 3.5 3.5 3.5 3.5 3.5 3.5 3.5 3.5 3.5 3.5 3.5 3.5 3.5 4.2 4.4 4.5 4.3 4.2 5 3 4 2 1 Technical Assessment A A A
A A A
A A A A A
A A A A
A A A A
A A A
X X X X X X X X X X X X X X X X X X X X X X Y Y Y Y Y Y Y Y Y Y Y Y Y Y Y Y Y Y Y Y Y Y 3.2 3.2 3.2 3.2 3.2 4 3.7 3.8 3.2 3.2 3.2 3.2 3.2 3.8 3.8 3.8 3.8 3.8 3.8 3.8 3.8 3.8 3.8 3.8 3.8 3.8 3.8 3.8 3.8 3.8 3.8 3.8 3.8 3.8 3.8 3.8 3.8 3.8 3.8 3.8 3.6 3.6 3.6 3.6 3.6 3.8 3.6 3.6 3.6 3.6 3.6 3.6 3.6 3.6 3.6 3.6 3.6 3.6 3.6 3.6 3.6 3.6 3.6 3.6 3.6 3.6 3.6 3.6 3.6 3.6 3.6 3.4 3.4 3.4 3.4 3.4 3.4 3.4 3.4 3.4 3.4 3.4 3.4 3.4 3.4 3.4 3.7 3.7 3.7 3.7 3.7 3.73.7 3.7 3.7 3.7 3.7 3.7 3.7 3.7 3.7 3.7 3.7 3.7 3.7 3.7 3.7 3.7 3.7 3.7 3.7 3.7 3.7 3.7 3.9 3.9 3.9 3.9 3.9 3.9 3.9 3.9 3.9 3.9 3.9 3.9 3.9 3.9 3.9 3.9 3.9 3.9 3.9 3.9 3.1 3.1 3.1 3.1 3.1 4.2 4.2 4.2 4.2 4.2 4.2 3.4 2.9 2.9 3.3 3.3 3.3 3.3 3.3 3.3 3.3 3.3 3.3 3 3 3 3 3.1 4.1 4.1 4.1 4.1 4.1 4.1 4.1 4.1 4.1 4.1 4.1 4.1 4.1 4.1 4.1 4.1 4.1 3.5 4 4 4 4 4 4 4 4 4 4 4 4 4 4 4 2.8 4.3 4.3 4.3 Competitive assessment A= Our Company X= Competitive X Y= Competitive Y ( 5 is the Best) 1 2 3 4 5
Exploring the Quality Function Deployment method: A case study on the restaurant industry in Taiwan
service quality computed by the customer satisfaction important degree showed the extent and order. However, further research can compare sample restaurant (A) and competitors (X) and (Y) in beneficial advantage with this reach.
5. Discussions
5.1 The important degree of service quality
Data analysis of important degree in service quality showed that “This facility provides service as promised”, “I can depend on the staff at this facility to handle user service problems”, “The staff at this facility perform the right service the first time”, “The staffs at this facility provide service at the promised time”, “The staff at this facility make users feel secure in their transaction transactions”, and “The staffs at this facility are courteous” were the most important items which customer argued that they dinning in the restaurant.
On the contrary, there are “This facility has modern equipment”, “The documentation, such as signs, handouts, and brochures are appealing”, “The staffs at this facility keep users informed about when services will be performed”, and “The staff at this facility provide individual attention to users” 4 items that showed the less of important extent in service quality. Thus, it is believed that customers dinning in restaurant require useful, politic, and suitable service circumstance rather than equipment, design, and individual attention service.
5.2 The important degree of customer satisfaction
According to the analysis of important degree in customer service showed that the most important degree item is “I am satisfied the service of this restaurant offering”, the less important degree item is “This is a wise chosen to dine in this restaurant”. Hence, it can be recognized that customer have only few consider the wise reason to dine in restaurant, but emphasized the service which restaurant offering.
5.3 The relationship between service quality and customer satisfaction
The matrix (Table 10) showed that “The staff at this facility looks neat and professional” and “I am pleased to dine in this restaurant”, “I can depend on the staff at this facility to handle user service problems” and “I am satisfied the service of this restaurant offering”, “This facility provides service as promised” and “I never regret to dine in this restaurant” have a significant correlation, meanwhile “The staffs at this facility are talking to users while performing service” and “I am satisfied the service of this restaurant offering”, “The staffs at this facility keep users informed about when services will be performed” and “This is a wise chosen to dine in this restaurant”, “The staff at this facility provide individual attention to users”, and “This is a wise chosen to dine in this restaurant” on the other hands, there are not exit significant correlation.
Based on this result in matrix, customer pleased to dine in a professional, neatly, and believable service restaurant, evidence also showed that customer less care of the service record and time schedule which restaurant provided.
5.4 The important degree to the customer satisfaction in service quality
Wang, W. S.
important as well.
5.5 The interrelationship of service quality
There are 3 sets item “The staff at this facility perform the right service the first time” and “The staff at this facility have the knowledge to answer users questions”, “The staff at this facility perform the right service the first time” and “The staff at this facility have the users best interests at heart”, “The staffs at this facility are courteous” and “The staff at this facility have the knowledge to answer users questions” have a most significant interrelationship among service quality. Meanwhile, there are 3 sets item “The staff at this facility looks neat and professional” and “The documentation, such as signs, handouts, and brochures are appealing”, “This facility looks appealing” and “I can depend on the staff at this facility to handle user service problems”, “The staff at this facility looks neat and professional”, and “This facility provides convenient hours of operation” have not significant interrelationship.
Based on the result, it showed obviously that the front service person need not only have a politic attitude but also have ability to solve the customer problem in service. Besides, the result showed that customer less believes among restaurant design, staff looks neat, and convenient business hour have significant interrelationship.
5.6 The interrelationship of customer satisfaction
The item set of “I am pleased to dine in this restaurant” and “This is a wise chosen to dine in this restaurant” have a most significant interrelationship among customer service have been showed in Table 12. Besides, there are 2 item sets “I am satisfied the service of this restaurant offering” and “This is a wise chosen to dine in this restaurant”, “This is a wise chosen to dine in this restaurant”, and “I never regret to dine in this restaurant” do not have significant interrelationship. Thus, it is recognized that restaurant offering have significant interrelationship with customer satisfaction, the less significant interrelationship in feedback and satisfaction.
6. Conclusions
6.1 Findings
Although, the results are limited and constrained by the small sample size and the geographical factor; however, this study explored the customers dinning in restaurant require a useful, politic, and suitable service circumstance, besides, customer emphasized the service which restaurant offering. In addition, customer pleased to dine in a professional, neatly, and believable service restaurant, it is also explored the most important level in service is included in available and honorable service. However, the front line service person need not only have a politic attitude but also have ability to solve the customer problem in service, hence, this study found that the restaurant offering have significant interrelationship with customer satisfaction as well.
6.2 Implications
Based on the quantitative assessment of service quality and customer satisfaction in Taiwan restaurant, some implications can be described on the below:
First, this study has conducted that it is feasible to evaluate the relationship between service quality and customer satisfaction in restaurants. Companies can regularly conduct service quality assessments simply and inexpensively by means of the instrument SERVQUAL.
Exploring the Quality Function Deployment method: A case study on the restaurant industry in Taiwan
Third, the restaurant manager can periodically conduct the surveys to know the significant data by which customers access the restaurant service quality, the tangible and feasible criteria can led to restaurateurs improve their service offerings, enhance their benefit and competitive advantages.
6.3 Suggestions
Based on the foregoing description, it is believed that if QFD can be applied for the development of restaurant industry, the method has to be customized for the purpose of the restaurant industry. This study suggests that further research on the application of QFD about restaurant industry development can be described:
Exploring more study case; because there are not many (completed) examples are published currently;
Wide research in restaurant industry, because most of the literature only discussed the House of Quality in other industry;
Deeply exploring QFD in restaurant industry, because it should be customized for companies.
7. References:
ASI. (1992). Quality function deployment. American Supplier Institute.
Bergquist, K., & Abeysekera, J. (1996). Quality function deployment a means for developing usable products. International Journal of Industrial Ergonomics, 18(4), 269-275.
<http://dx.doi.org/10.1016/0169-8141(95)00051-8>
Bitner, J. M., & Mohr, A. L. (1995). The role of employee effort in satisfaction with service transactions. Journal of Business Research, 32(3), 239-252. <http://dx.doi.org/10.1016/0148-2963(94)00049-K> Bitner, M. J. (1992). Servicescape: The impact of physical surroundings on customers and employees. Journal of
Marketing, 56(2), 57–67. <http://dx.doi.org/10.2307/1252042>
Bossert, J. L. (1991). Quality function deployment: A practitioner’s approach. NY: ASQC Quality Press. Buttle, F. (1996). SERVQUAL: Review, critique, and research agenda. European Journal of Marketing, 30(1),
8–32. <http://dx.doi.org/10.1108/03090569610105762>
Carman, J. M. (1990). Consumer perceptions of service quality: An assessment of SERVQUAL dimensions. Journal of Retailing, 66(1), 33–35.
Caruana, A., Money, A. H., & Berthon, P. R. (2000). Service quality and satisfaction: The moderating role of value. European Journal of Marketing, 34(11/12), 1338-1352.
<http://dx.doi.org/10.1108/03090560010764432>
Churchill, G. A., Jr., & Surprenant, C. (1982). An investigation into the determinants of customer satisfaction. Journal of Marketing Research, 19, 491-504. <http://dx.doi.org/10.2307/3151722>
Costa, A. I. A., Dekker, M., & Jongen, W. M. F. (2000). Quality function deployment in the food industry: a review. Trends in food science & Technology, 11(9-10), 306-314.
<http://dx.doi.org/10.1016/S0924-2244(01)00002-4>
Cronin, J. J., Jr., & Taylor, S. A. (1992). Measuring service quality: A reexamination and extension. Journal of Marketing, 56(3), 55-68. <http://dx.doi.org/10.2307/1252296>
DGBAS. (2012). Directorate general of budget, accounting and statistics. Retrieved July 15, 2012, from <http://eng.dgbas.gov.tw/mp.asp?mp=2>
Fornell, C. (1992). A national customer satisfaction barometer: The Swedish experience. Journal of Marketing, 56(1), 6-21. <http://dx.doi.org/10.2307/1252129>
Wang, W. S.
Innovation Management, 9, 171–187. <http://dx.doi.org/10.1016/0737-6782(92)90028-B>
Hauser, J. R. (1993). How Puritan-Bennet used the House of Quality. Sloan Management Review, Spring, 61–70. Huang, S. T., & Fu, H. Y. (2004). The concept, theory, and method of quality control [In Chinese]. Taipei: Chien
Cheng Publishing Company.
Kim, W. G., & Moon, Y. J. (2009). Customers` cognitive, emotional, and actionable response to the servicescape: A test of the moderating effect of the restaurant type. International Journal of Hospitality Management, 28, 144-156. <http://dx.doi.org/10.1016/j.ijhm.2008.06.010>
Kotler, P. (1996). Marketing management analysis, planning, implementation, and control (9th ed.). Upper Saddle, NJ: Prentice-Hall Inc.
Lewis, R. C., & Booms, B. H. (1983). The marketing aspects of services quality in emerging perspectives on service marketing. In L. Berry, G. Shostack, & G. Upah (Eds.), Emerging perspectives on services marketing (pp. 99-107). Chicago: American Marketing.
Liang, S. W. (2001). Market research theory practice manuals [In Chinese]. Taipei: Shih Hsin University. Maslow, A. H. (1943). A theory of human motivation. PsychologicalReview, 50(4), 370-396.
<http://dx.doi.org/10.1037/h0054346>
MEA. (2012). Department of statistics, ministry of economic affairs. Retrieved July 15, 2012, from http://2k3dmz2.moea.gov.tw/gnweb/English/Indicator/wFrmEnIndicator.aspx
Oliver, R. L. (1980). A cognitive model of the antecedents and consquare of satisfaction decisions. Journal of Marketing Research, 17, 460-469. <http://dx.doi.org/10.2307/3150499>
Parasuraman, A., Zeithaml, V. A., & Berry, L. L. (1994). Reassessment of expectations as a comparison in measuring service quality: Implications for further research. Journal of Marketing, 58(1), 111–124. <http://dx.doi.org/10.2307/1252255>
Parasuraman, A., Zeithaml, V., & Berry, L. (1988). SERVQUAL: Multiple-item scale for measuring consumer perceptions of service quality. Journal of Retailing, 64(1), 12-40.
Selnes, F. (1993). An examination of the effect of product performance on brand reputation, satisfaction and loyalty. European Journal of Marketing, 27(9), 19-35. <http://dx.doi.org/10.1108/03090569310043179 Shiu, R. C. (2007). Taiwan restaurant industry today [In Chinese]. Global View Monthly, June (252).
Sullivan, L. P. (1986). Quality function deployment: A system to assure that customer needs drive the product design and production process. Quality Progress, (June), 39–50.
Tse, D. K., & Wilton, P. C. (1988). Models of consumer satisfaction formation: An extension. Journal of Marketing Research, 25(2), 204-212. <http://dx.doi.org/10.2307/3172652>
Tzeng, M. Y. (2005). The effects of service quality between tourist satisfy and loyalty in Sha Mao Shan Hot Springs Restaurants: A case study of Coconut Grove Hot Springs Restaurants [In Chinese]. Unpublished Masteral thesis, Department of Tourism Management and Institute of Tourism Management, Nanhua University, Chiayi City, Taiwan.
Wen, S. L. (2002). Exploring the mobile phone associate with customer satisfy and loyalty: A case study of high (vocational) school students in Taipei city [In Chinese].
Zeithaml, V. A. (1988). Consumer perceptions of price, quality and value: A means-end model and synthesis of evidence. Journal of Marketing, 52(7), 2-22. <http://dx.doi.org/10.2307/1251446>
Zeithaml, V. A., Berry, L. L., & Parasuraman, A. (1988). Communication and control processes in the delivery of service quality. Journal of Marketing, 52(2), 35-48. <http://dx.doi.org/10.2307/1251263>