AGRONOMY & SOILS
The Impact of Variable, Cold Minimum Temperatures on Boll Retention,
Boll Growth, and Yield Recovery of Cotton
Stephen J. Yeates*, Mike F. Kahl, Andrew J. Dougall, and Warren J. Müller
S.J. Yeates*, CSIRO Plant Industry, The Australian Cotton Catchment Communities CRC, Ayr Research Station, PO Box 15, Ayr, Qld, 4807, Australia; M.K. Kahl and A.J. Dougall,
Northern Territory Department of Resources, The Australian Cotton Catchment Communities CRC, Katherine Research Station, Katherine, NT, 0850, Australia; and W.J Müller, CSIRO Mathematics, Informatics and Statistics, GPO Box 664, Canberra, ACT 2601, Australia
*Corresponding author: stephen.yeates@csiro.au ABSTRACT
A previous field experiment reported that
cotton grown in the tropical dry season, where
minimum temperatures during flowering can
be cold (< 10°C), yielded a greater proportion of cotton from bolls pollinated when minima were warmer. The retention and growth of bolls was postulated to be reduced by cold night tem-peratures. However, biotic stresses (e.g., pests) might have confounded this response. Reported
herein is a pot experiment where biotic stresses
were effectively removed. Over two seasons, (i) ambient and (ii) ambient plus 5 to 6°C (range 10- 24°C), night thermal conditions were imposed
from 1 wk prior to first flower to 2 wk after last effective flower. Day temperatures were the same.
Average ambient minimum temperature for the treatment period was 12.6°C (range 5.9-21.1 °C) and 10.2°C (range 2.6-21.0°C) in 2003 and
2004. Flowers were damaged by low ambient minimum temperatures occurring near anthesis, which led to shedding or lower seed number per boll which reduced boll size. The latter could be due to poor pollination and competition for assimilates. Shedding was correlated (p < 0.01) with minimum temperature at anthesis with < 40% survival when minima were < 6°C. Seed cotton yield was the same. It was concluded that the yield recovery from variable, low minimum
temperatures during flowering was (1) similar
to where damage to fruit was biotic with
com-pensation occurring on later flowering fruit -ing sites provided temperatures were warm;
and (2) unlikely to be impacted by damage to photosynthetic apparatus due to the minimum temperatures observed here.
M
inimum temperatures below the lowest reported base temperature for cotton development of12°C (Constable and Shaw, 1988) during flowering
might be detrimental to boll retention and growth. In tropical northwestern Australia, growing irrigated cotton during the dry or winter season (lat. 13 to 17° S) is being evaluated because key insect pests and
high temperatures during flowering are avoided.
However, the photothermal pattern of the dry season is the reverse of the wet (summer) season and that of spring-sown cotton in temperate latitudes. Cold night temperatures are possible mid season and high temperatures are likely early and late in the season (Yeates et al., 2010a).
Field experiments in the tropical winter season found a reduced retention of bolls and a lower
con-tribution to cotton yield from flowers when anthesis
coincided with the greatest frequency of cool minima (< 12°C) (Yeates et al., 2010a). In these experiments,
cool minima occurred early in flowering; hence flow
-ers on the first position on sympodia nearer the bot -tom of the plant were most affected. However, these crops also produced high lint yields (2,064 kg lint/ha)
due to an increased contribution from later flowers,
which occurred on upper and outer fruiting sites of the plant when temperatures warmed (Yeates et al., 2010a), and a larger biomass (Yeates et al., 2010b).
In a field environment it was difficult to determine
whether cool minimum temperatures were a factor in the early fruit loss as other possible causes such as insect pests, water logging, and nutrient stress can
occur. Moreover, in the field there was no “warm
night” control for comparison.
Less is known about the impact of cold minimum
temperatures during flowering and boll growth of
cotton than on early growth (Cothren, 1999; Mauney, 1986). In controlled environment studies where
fixed temperatures were used, there was a quadratic
22°C (mean of 25°C) with a rapid fall in boll weight when night temperature was below 16°C or above 25°C (Gipson and Ray, 1970; Hesketh and Low, 1968). Hesketh and Low (1968) also found boll
re-tention was correlated with minimum temperature, although square retention was more tolerant to cooler temperatures than bolls.
Controlled environment research might not be
completely transferable to field-grown crops be -cause most published studies of cotton have been
conducted with fixed day and/or night temperature
regimes (e.g., Gipson and Joham, 1968; Hesketh and Low, 1968; McDowell et al., 2007; Reddy et al., 1991, 1992). Moreover, many of these stud-ies have been run for a set calendar-day period and, hence, have not allowed for developmental thermal time differences between treatments when measuring boll weights in response to temperature. For example, Gipson and Joham (1968) measured the effect of night temperatures from 10°C to
26.5°C on boll growth for the first 45 d of boll growth. Reddy et al. (1991) used five different fixed minimum and maximum temperatures, the
coldest being 10-20°C, to measure boll weight 49
d after flowering. Not surprisingly boll weights
under cool temperatures were less at the time of measurement in both studies.
Low minimum temperatures can reduce boll growth and retention due to: (1) lower net photo-synthesis following reduced growth and respiration at night, which suppresses sink demand and inhib-its the export of starch from leaves (Warner et al., 1995), although this response can be negated when
acclimation to low temperatures occurs (Singh et al., 2005); (2) permanent injury to photosynthetic apparatus (Berry and Bjokman, 1980); (3) prevention of pollen germination and tube growth, where the minimum that stops growth or germination depended on genotype and ranged from 9.8 to 20.1°C (Kakani et al., 2005; Stewart, 1986).
The climate of the tropical dry season adds a further dimension to mid-season cold temperature effects because temperatures at sowing are hot then
fall until flowering when the coldest minima occur; temperatures then rise rapidly during late boll fill as
the days become longer (Yeates et al., 2010a). The positive correlation between yield and fruit on the upper and outer fruiting sites of the plant measured
in field experiments (Yeates et al., 2010a) suggest
climatic conditions were more favorable later in crop growth. Fruit removal studies elsewhere have found
that yield compensation might occur in cotton where climatic conditions become more favorable follow-ing removal (Kennedy et al., 1986; Pettigrew et al., 1992; Wilson et al., 2003). Minimum temperatures
are also variable during the dry season and there are not extended periods of extreme cold (Cook and Rus-sell, 1983). Hence, it is possible greater boll retention and growth might occur during periods when minima
are warm, which also can occur early in flowering.
The objective of these experiments was to measure the effects of variable, cold minimum
tem-peratures (averaging 10-12°C) during flowering on
cotton fruit growth, fruit retention, fruiting dynamics (compensation), and yield, while minimizing con-founding effects such as insects and disease.
MATERIALS AND METHODS
The experiments were performed at the Kather-ine Research Station, 4 km east of KatherKather-ine (14°28’ S, 132°18’ E), Northern Territory, Australia. Due to greater distance from the ocean, Katherine has a higher probability of lower dry season minimum temperatures than Ord River, Western Australia
(15°39’ S, 128°43’ E), where previous field experi -ments were located (Yeates et al., 2010a). Katherine also has similar maximum temperatures, photope-riod, and monthly solar radiation as Ord River (Cook and Russell, 1983). The project was conducted over two seasons with sowing occurring on 28 April 2003 and 30 April 2004.
Minimum temperature treatments were created by removing plants to a glasshouse at night during
the flowering phase (“warm” plants) and comparing
these with plants grown at ambient temperatures
(i.e., outside) at night during flowering (“cool”
plants). During the treatment period all plants were grown at ambient temperatures and solar radiation during the day.
The timing of plant growth stages and treat-ment period are shown in Table 1. To ensure plants were exposed to the same minimum temperatures
prior to flowering, all plants were grown outside until 6 and 7 d prior to first flower in 2003 and
2004, respectively. The treatment period then com-menced and the warm-night plants were removed to the glasshouse at night for the next 60 and 53 d in 2003 and 2004, respectively; that is at a
mini-mum of 15 d after flowering was completed. The
Glasshouse minimum temperatures were main-tained approximately 5°C above ambient to ensure similar daily variation in minimum temperature to plants grown at ambient temperatures. The only exceptions were when ambient temperatures were < 6°C; on these nights glasshouse temperatures were not permitted to fall below 10.3°C. When ambient temperatures were warm, glasshouse minimum temperatures did not exceed 24°C. The glasshouse used adjustable roof vents to regulate night temperatures.
In each year, three groups of two night tem-perature treatments (cool and warm) were grown, each group was physically separated. Cotton was grown in 17-L square pots (20-cm sides) contain-ing one plant per pot. Within a group, a tempera-ture treatment consisted of eight pots arranged in two rows of four, each on its own trolley with the
edges of the pots separated by ≤ 1cm. The groups
were aligned in an east-to-west direction to ensure even light interception, as the sun was most north-erly in the winter months, and to account for a dry easterly breeze that is common during the day during June to September. Temperature treatments were randomized within each group. The base of the pots were 15 cm above the ground, 1m sepa-rated each group, and there was a 1.5-m walkway between trolleys within a group. The walkway ensured that the treatment on the north side of each group did not shade the southern treatment. Shade cloth (80% radiation reduction) was placed on the north side of the trolleys to reduce solar heating of the pots., The cloth was perpendicular to the ground from the surface to 3 cm above the
lip of the pots with a 5-cm gap to allow air flow.
The soil surface below the pots was covered with
sabi (Urochloa mosambiencis (Hack). Dandy), dry weight approximately3 t/ha, killed 1 wk prior to
sowing, and mulched with a flail mower.
Four seeds of the Bt transgenic cultivar Siokra V-16B (containing the Monsanto Cry1Ac and Cry2Ab proteins) were sown per pot and thinned to one per plot 15 d later. This cultivar produced consistently high yields in cultivar comparisons made over the previous 6 yr in the dry season at Ord River (S.J. Yeates, unpublished data).
Movement in and out of the glasshouse was timed so plants were exposed to a temperature change of at most 2°C. Accordingly, plants were moved outside on the coldest mornings approximately 45 min after sunrise and returned 30 min prior to sunset. The same east-west di-rection of the trolleys was maintained at night. For the period when plants were inside after sunrise, 50% of ambient, photosynthetically active radiation passed through the glasshouse. The average conditions of each treatment (Fig. 1) were calculated using a model of potential photosynthesis (Constable, 1986). The addi-tional time inside the glasshouse accounted for less than 3% of daily photosynthesis because of cooler temperatures after sunrise. Within a trol-ley, pots were rotated clockwise weekly, from 15 d after sowing until approximately 1 month prior to picking as there was risk of damaging the plants and large bolls when moved. Tempera-tures were recorded (Tinytag Plus™, TGP-0050, Gemini Data Loggers, Chichester, West Sussex, UK; www.geminidataloggers.com) half hourly at canopy height inside and outside the glass-house with a logger also placed on a trolley. The glasshouse and trolley loggers were placed in an ACS50 Stevenson Screen (Gemini Data Log-gers) and the outside logger was placed inside a standard Stevenson Screen.
To determine the location within the glasshouse where temperature was least variable between the three groups of pots prior to commencement of the experiment, spatial variation in night temperature was logged within the glasshouse. Sensors were placed at 1-m separation in each direction from the center of the glasshouse at plant height. Plants were located within the middle section where temperatures varied less than 0.5°C and were at least 2 m from the walls. The most uniform area to locate the groups of pots was ±3 m east-west and ± 1.5 m north-south of the center of the glasshouse.
Table 1. Dates of plant growth stages and the timing of the
treatment period.
Growth Stage 2003 2004
Sow 30 April 30 April
1st Square 5 June 3 June
Start treatment period 23 June 21 June
1st Flower 29 June 28 June
Last effective flower
Warm Cool
24 July 29 July
22 July 29 July
End treatment period 20 August 13 August
Maturity Warm
Cool
26 September 30 September
applying insecticide when required; and (3) growing
of Bt cotton, which in field studies provided excellent
protection against the main local pests Helicoverpa armigera (Hübner), Helicoverpa punctigera (Wallen-gren), Earias huegeli Rog., and Earias vittella (Fab.) (Annells and Strickland, 2003; Yeates et al., 2010a).
Measurements. The plants were mapped for fruit retention weekly, from early squaring to the start of the
treatment period, then twice weekly from first flower to the end of flowering, then weekly to maturity. Fruit were characterized as squares, white flowers, pink flowers, and bolls. Fruit position on the plant was also
recorded, where for each sympodia, P1, P2, and P3
are first, second, and third fruiting positions laterally
from the main stem, respectively. Monopodia fruit were recorded for each node. The anthesis date was recorded for each fruit from the mapping data, where
a white flower denoted anthesis today, red flower
denoted anthesis 1 d ago, and a small boll (< 5 mm) with a withered petal denoted anthesis 2 d ago. These characterizations were based on experience from previous experiments in the tropical winter season (S. J. Yeates, unpublished data) and observations from spring-sown crops at temperate latitudes (Hake et al., 1996). It was observed that when minimum temperatures were < 10°C for at least three nights,
the red flower stage lasted 1 d longer (2 d total) than
when minimum temperatures were > 10°C; hence, in
estimating the day of anthesis for red flowers, a 2-d
period and withered petals at 3 d was recorded. At maturity, fruit retention, seed cotton weights, seed cotton weight per boll, and number of bolls and seeds were measured for each fruiting position on all plants. All plant data were combined for the eight plants on each trolley. The only exception was the
calculation of the proportion of flowers surviving to maturity on each day of the flowering period. To have a sufficient number of flowers to calculate survival,
all plants in the three trolleys of each temperature treatment (n = 24) were used and a 3-d moving average was calculated for each anthesis date. The
relationship between flower survival and minimum
temperate was then tested using the moving 3-d average for each variable.
Statistical analysis. Analysis of variance was made using Genstat, (Release 14.2; Lawes Agricul-tural Trust, IACR, Rothamsted, UK). The three groups of two trolleys can be regarded as three replicates, where the treatment provided to the warm trolleys was
to remove them to a glasshouse for specific periods
during the experiment. Running the experiment over Each pot was irrigated at 1000 h by a single 2-L/h
emitter until the drainage occurred from exit holes at
the base. From 14 d after first flower the plants were
watered twice daily, at 1000 h and 1500 h. The potting mix consisted of a mixture of sand, peat, and vermicu-lite at a ratio by volume of 6:5:1, respectively. Slow release fertilizer 45 g Ozmocote™ + Moeco™ 10 g/ pot (i.e., 8.4 g N, 1.8 g P, 5.1 g K, 1.1 g S, 0.5 g Mg, 0.1 g Ca, 0.2 g Fe, 9 mg Zn, 1 mg each of Cu, B, Mn, Mo) was incorporated with the potting mix. Aquasol™ liquid fertilizer 0.8 g was applied to the soil surface of each pot in 250 ml of water on three occasions 14 d apart in June and July each year (i.e., 184 mg N, 32 mg P, 144 mg K, 0.4 mg Zn, 0.48 mg Cu, 0.01 mg Mo, 1.2 mg Mn, 0.5 mg Fe, and 0.1 mg B per application).
Insect damage was prevented by: (1) the loca-tion at Katherine, which is not a cotton producloca-tion
area, so many cotton specific pests were not present
or present in low numbers due to the winter growing season; (2) scouting twice weekly for insect pests and
0 3 6 9 12 15 18 21 24 27
2003
T
m
in
(°C)
T
m
in
(°C)
Average Min. 15.3°C Average Min Cool = 12.6°C Average Min Warm = 17.4°C
20.3°C Average Max. 31.6°C 31.2°C 35.7°C
Average Min. 16.1°C Average Min Cool = 10.2°C Average Min Warm = 16.0°C
14.3°C Average Max. 31.2°C 29.8.2°C 34.1°C
0 3 6 9 12 15 18 21 24 27
29-Apr 13-May 27-May 10-Jun 24-Jun 8-Jul 22-Jul 5-Aug 19-Aug 2-Sep 16-Sep 30-Sep 29-Apr 13-May 27-May 10-Jun 24-Jun 8-Jul 22-Jul 5-Aug 19-Aug 2-Sep 16-Sep 30-Sep
2004
Figure 1. Observed daily minimum and average maximum temperatures; the box indicates when the temperature
treatments were imposed and the average minimum for this period. Broken and solid lines are ambient and glasshouse minimum temperatures respectively. Arrows show the period before, during and after the treatments were
imposed; average maximum and minimum temperature
2 yr provided replication. Because there were obser-vations for different parts of the same plants and we were looking for whether the ‘warm’ treatment was greater than the ‘cool’ treatment for certain parts, the temperature x plant-part interaction was calculated
to find out when warm > cool. Two separate analysis
were made: (1) the variables that were measured for the whole plants (e.g., seed cotton weight), were separated into the values measured from all P1, P2, P3 (sympodia), and MP (monopodia); and (2) the same variables measured from P1 fruit on individual main-stem nodes (5 to 14). The analysis of variance was structured as follows: Whole plant data: “Year” is
difference between the years (1 d.f.); “Time x Group”
is the difference between the three groups of two trolleys within each year, 2 d.f. for each year gives
4 d.f. “Temp” is the overall difference between cool and warm (1 d.f.); the “Year x Temp” interaction, that
is, whether the magnitude of the difference between
cool and warm is significantly different between years (1 d.f.); and “Residual” (4 d.f.). Within plant data: “Position” is the factor in the analysis for plant
positions, the interaction of interest being “Temp X
Position” (3 d.f.), that is, are the differences between warm and cool the same for all positions. The analysis description and philosophy for the P1 data measured on individual fruiting branches are the same as for whole plant analyses, except that there were 10 nodes
rather than four plant positions and the “Year x Temp
x Node” interaction (9 d.f.) was of most interest. Regression analysis using Statistical Analysis System (SAS, 2001) was used for the relationships between temperature and boll survival, and between seed cotton weight and seed number or boll number.
Regression coefficients calculated between the latter
three variables were tested for homogeneity. The correlations between yield components were from the combined bolls harvested at each node at each plant position.
RESULTS
Observed Temperatures. During the treatment period, ambient minimum temperatures (cool plants) averaged 12.6°C (range 5.9-21.1°C) and 10.2°C (range 2.6-20.1°C) in 2003 and 2004, respectively (Fig. 1). The minimum temperatures in the glass-house for the warm plants averaged at least 4.8°C higher during the treatment period, 17.4°C (range 12.3-23.4°C) and 16.0°C (range 10.3-23.4°C) in 2003 and 2004. Warm plants were also exposed to
average minimum temperatures that were at least 1 to 5°C (Fig. 1) above the reported base for cotton development of 12 to 15.5°C (Dippenaar et al., 1990; Hearn and Constable, 1984; Mauney, 1986; Viator et al., 2005). The number of ambient minima below 12°C during the treatment period was 22 and 38 compared with 0 and 8 for the warm plants in 2003 and 2004, respectively. Temperatures increased fol-lowing the treatment period (Fig. 1).
Ambient minimum temperatures were cold for
the first 10 d of the treatment period, which coincided with early flowering. The average minimum for the first 10 d of the treatment period in 2003 was 8.8°C
and 15.4°C, and in 2004 was 6.8°C and 13.4°C for the cool and warm plants, respectively.
Fruit Retention at Start of the Treatment Period. All plants were gown outside in ambient conditions until the start of the treatment period and
plant mapping confirmed there was no significant (p
< 0.05) difference between the treatments in fruit re-tention. Square retention was high for all treatments: 98.3% and 98.8% in 2003 and 2004, respectively.
There was also no significant difference in total
square number, or their location on the plant, or the average node number for the uppermost fruiting branch P1, P2, and P3 squares, which was 12, 10, and 7, respectively, for both years.
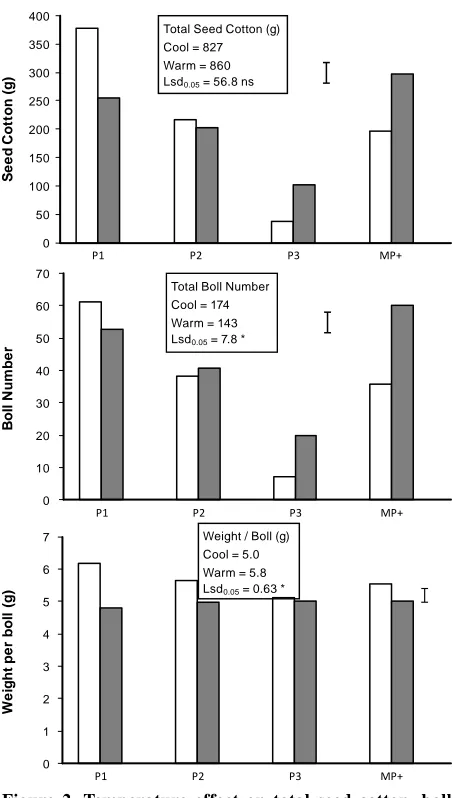
Yield and Boll Position on Plant. Surpris-ingly there was no seed cotton yield difference (p
< 0.05) between the cool and warm plants in both seasons (Table 2, Fig. 2). However, temperature
significantly (p < 0.05) changed the contribution of boll number and weight per boll to the yield (Table 2); the cool plants producing more bolls, whereas the warm plants had heavier bolls (Fig. 2). This was because the cool plants produced yield on dif-ferent fruiting positions than the warm plants. The temperature x position (within the plant)
interac-tion was highly significant for seed cotton weight,
boll number, and weight per boll (Table 2) and the means are shown in Fig. 2. The year x temperature
x position was not significant for these variables.
The temperature x position interaction was
sig-nificant and reflected the differences in average
temperature between the seasons (Fig. 1). For the warm plants, P1 bolls were the major contributor to seed cotton yield (46 %), whereas for cool plants
the contribution of P1 bolls was significantly less
position + adventitious bolls). The P3 and MP+ bolls accounted for 47% of seed cotton yield on the cool plants compared with 28% for the warm plants. The majority of the MP+ yield comprised monopodia bolls with the proportion of total seed cotton yield as adventitious and P4 bolls being 3% in the warm treatment and 6% in the cool treatment.
All adventitious flowers producing seed cotton were located on nodes 8 to 11 and flowered on the
same day as the P2 bolls at that node. Mature P4 bolls were only produced on the cool treatment on nodes 5 to 7 with their anthesis date coinciding with
the P1 flowers on nodes 12 to 14.
Flowers pollinated after 18 July contributed 60 to 70% of yield in the cool treatment compared with 15 to 30% of yield for the warm treatment (Fig. 4)
and these flowers were on fruiting sites on the outside
of the plant (Fig. 3). The slower accumulation of yield on the cool plants between 18 July and 25 July in 2004 coincided with much lower minima over the period, 7.8°C compared with 14.2°C in 2003 (Fig.
4), despite similar fruiting positions flowering at this
time in both seasons (Fig. 3).
Table 2. Analysis of variance for seed cotton yield, boll number, and boll weight. Variables calculated for all P1, P2, P3, and MP+ positions within plants. F values in parentheses when p > 0.0001. Where *, **, *** is p < 0.05, p < 0.01 and p < 0.0001 respectively. Means are shown in Fig. 2.
Source of variation
Variable
Seed Cotton Boll No. Boll Weight
Temperature ns (0.243) ** (0.003) ** (0.005)
Year x Temp. ns (0.968) ns (0.824) ns (0.918)
Boll Position *** *** * (0.033)
Year x Position *** *** ns (0.051)
Temp. x Position *** *** ** (0.001)
Year x Temp.
x Position ns (0.767) ns (0.431) ns (0.825)
Figure 2. Temperature effect on total seed cotton, boll number, and weight per boll (per 8 plants), and the
temperature x plant position interaction for these variables
on all P1, P2, P3, and MP+ (monopodia + P4 + adventitious)
bolls. Open bars are warm nights, filled bars are cool
nights, and error bar is lsd0.05.
0 10 20 30 40 50 60 70
P1 P2 P3 MP+
B
ol
l N
um
be
r
Total Boll Number Cool = 174 Warm = 143 Lsd0.05 = 7.8 *
0 1 2 3 4 5 6 7
P1 P2 P3 MP+
W
ei
gh
t p
er
b
ol
l (
g)
Weight / Boll (g) Cool = 5.0 Warm = 5.8 Lsd0.05 = 0.63 *
0 50 100 150 200 250 300 350 400
P1 P2 P3 MP+
Se
ed
C
ot
ton
(g
)
Total Seed Cotton (g) Cool = 827 Warm = 860 Lsd0.05 = 56.8 ns
The warm plants produced more P1 bolls that
were heavier than the cool plants. The significantly
higher seed cotton yield from P3 and MP+ bolls for the cool treatment were due to greater boll number (Fig. 2). Boll weight was generally less for the cool treatment at all fruiting positions. Although there
was no significant difference in the total yield from
P2 bolls between the temperature treatments (Fig. 2), the warm plants produced more seed cotton on nodes 5 to 8 but less seed cotton on nodes 9 to 13
that flowered later (data not presented).
Anthesis Date for Different Fruit Positions
and Yield Accumulation. As expected, due to the temperature difference between the treatments, the median anthesis date at the same fruiting position became greater as the treatment period progressed. Approximately 14 d after minimum temperature differences were imposed (6 July), the delay in
flowering was small; hence, there was only a 0- to 2-d delay in flowering of P1 bolls on the lowest four
nodes (Fig. 3). By late in July, the same fruiting
po-sition flowered 4 to 7 d later on the cool treatment.
For the cool treatment, many of the P3 + bolls (P3
+ monopodia + P4 + adventitious) flowered after 18
July and at least 45% of the monopodia yield was
P1 Yield and Its Components per Fruiting Branch Node. Seed cotton yield, boll number, and weight per boll. Whether minimum temperature im-pacted P1 yield on different nodes each season was of interest. The year x node x temperature interaction was
significant for P1 seed cotton yield and boll number
(Table 3); means are shown in Fig. 5. Node and
tem-perature x node interaction were significant for seed
cotton weight, boll number, and weight per boll (Table 3). The temperature main effect is the difference in total P1 bolls as shown in Fig. 2 except that seed cotton weight is calculated per node in Table 3. The P1 seed
cotton yield at each node was significantly less on the cool plants for nodes 6 to 11 in 2003, and 5 to12 in 2004 (Fig. 5). However, the contribution of boll number and weight per boll to P1 yield was different between nodes
(Fig. 5). In 2003, P1 boll weight was significantly less
on nodes 6, 9, 10, and 11 of the cool plants, whereas
on node 7, boll number and weight were significantly
reduced. After node 13, greater boll number and weight contributed to a higher P1 seed cotton yield in the cool treatment. In 2004, boll number explained P1 seed cotton yield differences on nodes 10 and above with a mixture of boll number and boll weight contributing to higher P1 seed cotton yield from nodes 5 to 9 on the warm plants. Examples of differences in P1 boll size due to minimum temperature are shown in Fig. 6.
0 1 2 3 4 5 6 7 8 9 10 11 12 13 14 15
28-Jun 2-Jul 6-Jul 10-Jul 14-Jul 18-Jul 22-Jul 26-Jul 30-Jul 3-Aug 7-Aug
No de Cool P1 Warm P1 Warm P2 Cool P2 Warm P3 Cool P3 16% 48% 6% 50% 44% Warm MP Cool MP 6% 30% A 0 1 2 3 4 5 6 7 8 9 10 11 12 13 14 15
28-Jun 2-Jul 6-Jul 10-Jul 14-Jul 18-Jul 22-Jul 26-Jul 30-Jul 3-Aug 7-Aug
Median anthesis date
No de 30% 45% 27% 18% 37% Warm MP Cool MP 25% 18% B
Table 3.Analysis of variance for P1 seed cotton yield, boll number, and boll weight from each node. F values in parentheses when p > 0.0001. Where *, **, *** is p < 0.05, p < 0.01 and p < 0.0001 respectively. Means are shown in Fig. 5.
Source of variation
Variable
Seed Cotton Boll No. Boll Weight
Temperature ** (0.004) ns (0.083) ***
Year x Temp. ns (0.533) ns (0.290) ns (0.522)
Node *** *** * (0.021)
Year x Node ns (0.336) ns (0.973) **(0.005)
Temp x Node *** *** * (0.033)
Year x Temp
x Node * (0.043) * (0.011) ns (0.067) Figure 3. The median anthesis date for P1, P2, and P3 flowers.
Horizontal lines show the range of anthesis dates for monopodial bolls (MP) and the percentage of the mature
MP bolls that flowered within these dates. For A) 2003 and
B) 2004. NB the range in anthesis dates for any fruiting position was ± 2 to 8 d from the median.
0 10 20 30 40 50 60 70 80 90 100
< 12 July 12 to 18 July 19 to 25 July 26 to 30 July > 30 July
Anthesis date of pickable bolls 2003
To ta l s ee d c ot to n y ie ld ( % ) Warm Cool 17.1oC
17.9oC
12.5oC
14.2oC
11.9oC
19.0oC
0 10 20 30 40 50 60 70 80 90 100
< 12 July 12 to 18 July 19 to 25 July 26 to 30 July > 30 July
Anthesis date of pickable bolls 2004
To ta l s ee d c ot to n y ie ld ( % )
11.3oC
13.4oC
16.9oC
7.4oC
13.0oC
17.9oC
Figure 4. The accumulation of seed cotton yield by the anthesis date of pickable bolls. Average minimum temperatures for each range of anthesis dates up to 30 July is also shown.
Comparison of early flowers when treatments overlapped for date of flowering. As there was little
dif-ference in the median flowering date between the tem -perature treatments for P1 bolls on nodes 5 to 7 and 5 to 8 in 2003 and 2004 (Fig. 3), these bolls were exposed to the same daily pattern of temperature changes early in growth. Flowering occurred prior to distal-position
yield at these nodes was significantly reduced on the
cool plants in both years, the only exception being node 5 in 2003 (Fig. 5). In 2004, the weight per boll and boll number was reduced, whereas in 2003, lower weight per boll contributed most to yield differences at node 6
and boll number and weight per boll were significantly
lower on the cool plants at node 7.
These differences in P1 seed cotton yield on each node could be explained by the minimum temperature
at flowering (Figs. 5, 6 and 7). In 2003, there was no
P1 yield difference between the warm and cool
treat-ments at node 5 and flowering coincided with higher
ambient minimum temperatures on 4 July. The lower P1 yield on the cool treatment on nodes 6 and 7 was associated with lower temperatures near anthesis, that is < 10°C on 5 and 6 July. These temperatures occurred
soon after anthesis at node 6 and boll weight was less in the cool treatment, whereas for node 7, the median anthesis date coincided with these cold temperatures and boll number and weight were reduced. In 2004,
P1 flowering of the cool treatment on nodes 5, 6, and 7 coincided with minimum temperatures ≤ 9°C and boll number was significantly less than the warm
treatment at these nodes. Warmer temperatures >
12°C on the later flowering cohort of bolls from 4 to
7 July would explain the greater boll weight on node 6. These warmer temperatures also coincided with
pollination of most surviving P1 flowers at node 8
and boll survival was equal to the warm treatment. After 7 July minimum ambient temperatures were <
8 °C and weight per boll at node 8 was significantly
less compared with the warm treatment.
Figure 5. Seed cotton weight, boll number, and average boll weight on the first position (P1) sympodium flower at each main-stem node; Open bars are warm nights, filled bars are cool nights, the bar is the Lsd0.05.The interaction between these factors and temperature and year is shown.
0 1 2 3 4 5 6 7 8
4 5 6 7 8 9 10 11 12 13 14
B ol l n um be r ( pe
r 8 p
la nt s 2 00 3) 0 1 2 3 4 5 6 7 8
4 5 6 7 8 9 10 11 12 13 14
B ol l n um be r ( pe
r 8 p
la nt s 2 00 4) 0 1 2 3 4 5 6 7 8
4 5 6 7 8 9 10 11 12 13 14
B ol l w ei gh t ( g/ bo ll) 2 00 3 Node 2003-cool 2003-warm 0 1 2 3 4 5 6 7 8
4 5 6 7 8 9 10 11 12 13 14
B ol l w ei gh t ( g/ bo ll) 2 00 4 Node 2004-cool 2004-warm 0 10 20 30 40 50 60
4 5 6 7 8 9 10 11 12 13 14
Se ed c ot to n ( g) 2 00 3 0 10 20 30 40 50 60
4 5 6 7 8 9 10 11 12 13 14
Seed number. Seed cotton yield was best ex-plained by seed number (r2 ≥ 0.97) (Table 4).The
relationship between seed number and seed cot-ton yield appears not to be affected by minimum temperature. Testing for homogeneity found no
significant (p < 0.05) difference in slopes of the
fitted lines between the P1 bolls exposed to warm
or cool minimum temperatures or the inclusion of bolls from non-P1 positions (e.g., P2 and P3). This contrasted with the relationship between boll number and seed cotton yield where the regression
coefficient with seed cotton yield was lower when minima were cool and slopes of fitted lines were
Table 4. The regression coefficients and fitted linear relationships between seed cotton weight (Sc) and seed number (Sn) or boll number (Bn), for P1 bolls and all fruiting positions. All regression coefficients were highly significant (p < 0.001); n = the sample number; standard errors of slope and intercept are in parentheses.
Fruiting Sites Sc v Bn Sc v Sn Bn v Sn
r2 function r2 Function r2 function
All - P1
(n=49) 0.89
y = 6.28x -3.47
(0.352) (1.92) 0.98
y = 0.193x +0.94
(0.0045) (0.719) 0.84
y = 0.026x +1.3
(0.0019) (0.295) Cool – P1
(n=26) 0.86
y = 5.2x -1.30
(0.473) (2.33) 0.97
y = 0.198x +0.57
(0.0075) (0.911) 0.79
y = 0.031x +1.2
(0.0039) (0.474) Warm – P1
(n=23) 0.94
y = 6.54x -1.83
(0.355) (2.10) 0.98
y = 0.193x +0.88
(0.0068) (1.291) 0.84
y = 0.027x +0.7
(0.0019) (0.371) All fruiting positions
(n=117) 0.90
y = 5.79x -1.61
(0.172) (0.84) 0.98
y = 0.191x +0.28
(0.0032) (0.455) 0.85
y = 0.030x +0.71
(0.0011)(0.162) Figure 6. Top: A P1 boll damaged by low ambient minimum
temperature. Bottom: the adjacent P2 boll flowered in
warmer temperatures+.
Figure 7. Warm treatment plants showing large P1 bolls in the lower canopy.
significantly different. The regression coefficient
between boll number and seed number was less than the relationship either component had with seed cotton yield, although the slopes of the regression
lines were not significantly different.
Effect of Minimum Temperature on Flower Survival. The survival of flowers to become harvest
-able bolls was significantly (p < 0.01) correlated with minimum temperature near anthesis (Fig. 8). The
relationship was curvilinear with a rapid fall in flower
survival when minima were < 11°C, with survival
of between 20 and 40% of flowers when minimum
DISCUSSION
These experiments indicate that low minimum temperatures during early boll growth and not biotic causes such as pests, contributed to the reduced
yield from early first-position flowers observed in
the tropical winter season (Yeates et al., 2010a). The ambient minimum temperatures observed during
flowering were below those observed in the experi -ments of Yeates et al. (2010a). Hence, these experi-ments also demonstrate that full yield recovery from
daily minima < 6°C during flowering was possible
provided such minima are episodic.
Yield compensation from cold minima during
flowering occurred via two processes. First, early in flowering plants capitalized on periods of warmer minima by retaining more flowers (Fig 8). Second,
the general increase in temperature and radiation
later in flowering that typifies the tropical dry sea -son (Yeates et al., 2010a), favored the retention and
growth of later pollinated flowers (Fig. 5). When temperatures are warmer early in flowering, boll
retention would be higher, and later fruiting sites
would not have been produced or their flowers shed
because of competition for assimilate from the earlier pollinated bolls (Hearn, 1994). This was the case for the warm night temperature treatment in these experiments.
The full-yield recovery from low minimum tem-peratures observed in these experiments was similar to the recovery reported when fruit removal was biotic (i.e., insect pests, real and simulated) (Holman and Oosterhuis, 1999; Jones et al., 1996; Kennedy et al., 1986; Kletter and Wallach, 1982; Lei and Gaff, 2003; Pettigrew et al., 1992; Wilson et al., 2003). These studies and our experiments demonstrated
lost fruits were replaced with later flowering fruit
Proportion surviving = -0.0031Tmn2 + 0.1168Tmn - 0.1744
R2 = 0.67**
0.0 0.1 0.2 0.3 0.4 0.5 0.6 0.7 0.8 0.9 1.0
0 1 2 3 4 5 6 7 8 9 10 11 12 13 14 15 16 17 18 19 20
Minimum temperature (°C)
Pr
op
or
tio
n o
f f
lo
we
rs
s
ur
vi
viin
g
Figure 8. The effect of minimum temperature (Tmn) near
anthesis on the proportion of flowers from all fruiting
sites surviving to produce pickable bolls. Where minimum temperature was calculated as the average for the day of anthesis plus 2 d.
from other sites, with recovery greatest when tem-peratures remained favorable for boll growth later in the growing season. However, a key difference between our experiments and the aforementioned experiments was that damage to fruit was abiotic and vegetative organs were also exposed to the low minimum temperatures.
The full-yield recovery suggests that any damage to photosynthetic apparatus by the low minimum temperatures observed was minor. This is consistent with controlled temperature studies by McDowell
et al. (2007), where fixed minimum temperatures
from 5 to 10°C for two and 20 nights, respectively, did not reduce photosynthetic capacity. Only a 2°C minimum for two nights of 16 h duration caused permanent damage to photosynthetic apparatus. In our study, the lowest recorded temperature was 2.6°C, however, being an ambient temperature this minimum was only sustained for the hour prior to sunrise.
For the warm treatment we were able to generate
minimum temperatures during flowering that were
less detrimental to early fruit retention or growth than when temperatures were cool (ambient). This was shown by the higher contribution to yield by P1 and P2 bolls on warm plants (Fig. 2). There was greater than 70% yield from P1 and P2 bolls on the warm plants, which was similar to that reported for cotton sown in spring at temperate latitudes and hav-ing similar minimum temperatures (Heitholt, 1993; Mauney, 1986).
Seed number per boll reflects the number of ovules and their fertilization efficiency (Stewart,
1986). Cold night temperatures are likely to have reduced seed number in two ways. First, by prevent-ing ovule fertilization, as many of the minimum
temperatures observed during flowering were below
11.1 and 9.8°C, the lowest temperatures where pollen germination and tube growth was prevented in in vitro studies (Kakani et al., 2005). Second, by reduc-ing assimilate supply to ovules. Net photosynthesis also could have been lower during cold minimum temperatures (Burke et al., 1988; Hearn and Con-stable, 1984; Lu et al., 1997; Reddy et al., 1992), and combined with competition from other bolls, the number of surviving ovules per boll would have been reduced. For example, the lower weight per boll from
the flowers on distal fruiting sites and on monopodia
which could prevent pollination, combined with
lower assimilate supply to individual flowers could explain the low flower survival to maturity when minimum temperatures were ≤ 6°C (Fig. 8).
The delay in maturity due to cool minima (Table 1) was due to the combined impact of slower heat
unit accumulation and the extended flowering period
required for compensation from boll shedding and damage. This delay was 16 d in the coolest season (2004) when damage to early fruit was greatest. The implications for crop management will be broadly similar to when compensation from insect pest dam-age occurs. First, the period of crop water use will be longer, which could require additional irrigation. However, unlike pest damage, cool temperatures will also reduce evaporative demand, so any additional water requirement might be less. Further research is required to measure water use of crops compensating for cool temperatures. Second, achieving a balance between yield compensation via fruiting sites toward the top and outside of the plant and appropriate vegetative growth will require careful management.
Over use of growth regulators or insufficient irriga
-tion or nutrient deficiency will inhibit compensatory
growth and reduce yield. On the other hand, ample supply of water and/or nutrients combined with an
insufficient amount of growth regulator could lead
to excessive or rank vegetative growth. Concurrent growth regulator research has shown that avoidance of high doses of mepiquat chloride during fruiting site production is essential to permit compensation via the production of additional fruiting sites (Yeates et al., 2002). Third, in regions where late season pests
can occur later, flowering delays to maturity might
increase pest control costs.
CONCLUSIONS
Low minimum temperatures during early flower -ing (< 9°C) contributed to a reduced proportion of
yield from early first-position fruiting sites. Flowers
produced on these sites were more likely to be shed or produce smaller bolls.Yield recovery from
vari-able, low minimum temperatures during flowering was: (1) enhanced by plants retaining more flowers
during periods when minima were higher; (2) similar to where damage to fruit was biotic, with
compensa-tion occurring on later flowering fruiting sites pro -vided temperatures were warm; and (3) unlikely to be impacted by damage to photosynthetic apparatus
due to observed minimum temperatures.
ACKNOWLEDGMENTS
This work was supported by the Australian Cot-ton Catchment Communities CRC. We also thank the NT Department of Resources for the provision of the glasshouse at Katherine Research Station and Dr. Greg Constable, CSIRO, in simulating potential photosynthesis to determine optimum time to re-move the plants from the glasshouse and for helpful suggestions to the document. This work forms part of a PhD study by the senior author and the contri-bution of Professor Shu Fukai of the University of Queensland is acknowledged.
REFERENCES
Annells, A.J., and G.A. Strickland. 2003. Assessing the Feasibility for Cotton Production in Tropical Australia: Systems for Helicoverpa spp. Management. p. 905–912
In A. Swanepoel (ed.), Proceedings of the World Cotton Research Conference-3: Cotton Production for the New Millennium. 9-13 March 2003, Cape Town, South Africa.
Berry, J., and O. Bjorkman. 1980. Photosynthetic response and adaptation to temperature in higher plants. Ann. Rev. Plant Physiol. 31:491–543.
Burke, J.J., J.L. Hatfield, and J.R. Mahan. 1988. Cotton specific thermal kinetic windows in relation to wheat and
cotton biomass production. Agron J. 80:553–556.
Constable, G.A. 1986. Growth and light receipt by mainstem
cotton leaves in relation to plant density in the field.
Agric. For. Meteorol. 37:279–292.
Constable, G.A., and A.J. Shaw. 1988. Temperature require-ments for cotton. Agfact P5.3.5, Department of Agricul-ture NSW, Australia.
Cook, L.J., and J.S. Russell. 1983. The climate of seven
CSIRO field stations in northern Australia. Tech. Paper
No. 25, Division of Tropical Crops and Pastures, CSIRO, Australia.
Cothren, J.T. 1999. Physiology of the cotton plant. p. 207–268
In W.C. Smith and J.T. Cothren (eds.) Cotton: Origin, History, Technology and Production. John Wiley & Sons, Inc, New York, NY.
Gipson, J.R., and H.E. Joham. 1968. Influence of night
temperature on growth and development of cotton (Gossypium hirsutum L.). II. Fiber properties. Agron. J., 60:296–298.
Gipson, J.R., and L.L. Ray, 1970. Temperature-cultivar
inter-relationships in cotton. 1. Boll and fiber development.
Cotton Grow. Rev. 47:257–271.
Hake, S.J., K.D. Hake, and T.A. Kerby. 1996. Early- to mid-bloom decisions. p. 51 In S.J. Hake, T.A. Kerby, K.D. Hake (eds.). Cotton Production Manual. Univ. California, Oakland.
Hearn, A.B. 1994. OZCOT: A simulation model for cotton crop management. Agric. Sys.44:257–299.
Hearn, A.B., and G.A. Constable. 1984. Cotton. p. 495–527
In P.R. Goldsworthy and N.M. Fisher (eds.) The Physiology of Tropical Food Crops. John Wiley & Sons, Chichester, UK.
Heitholt, J.J. 1993. Cotton boll retention and its relationship to lint yield. Crop Sci. 33:486–490.
Hesketh, J.D., and A. Low. 1968. Effect of temperature on
components of yield and fibre quality of cotton varieties
of diverse origin. Cotton Grow. Rev. 45:243–257.
Holman, E.M., and D.M. Oosterhuis. 1999. Cotton
photosyn-thesis and carbon partitioning in response to floral bud
loss due to insect damage. Crop Sci. 39:1347–1351.
Jones, M.A., R. Wells, and D.S. Guthrie. 1996. Cotton
re-sponse to seasonal patterns of flower removal: II growth
and dry matter allocation. Crop Sci. 36:639–645.
Kakani ,V.G., K.R. Reddy, S. Kotti, T.P. Wallace, V.V. Prasad, V.R. Reddy, and D. Zhao. 2005. Differences in in-vitro pollen germination and pollen tube growth of cotton cultivars in response to high temperature. Ann. Bot. 96:59–67.
Kennedy, C.W., W.C. Smith Jr., and J.E. Jones. 1986. Effect of early season square removal on three leaf types of cot-ton. Crop Sci. 26:139–145.
Kletter, E., and D. Wallach. 1982. Effects of fruiting form re-moval on cotton reproductive development. Field Crops Res. 5:69–84.
Lei T.T., and N. Gaff. 2003. Recovery from terminal and fruit damage by dry season cotton crops in tropical Australia. J. Econ. Entomol. 96:730–736.
Lu, Z., J. Chen, R.G. Percy, and E. Zeiger. 1997. Photosyn-thetic rate, stomatial conductance and leaf area in two cotton species (Gossypium barbadense and Gossypium hirsuitum) and their relation with heat resistance and yield. Aust. J. Plant Physiol. 24:693–700.
Mauney, J.R. 1986. Vegetative growth and development of fruiting sites. p. 11–28 In J.R. Mauney, and J.McD. Stewart (eds.). Cotton Physiology. The Cotton Founda-tion, Memphis, TN.
McDowell, A.J., M.P. Bange, and D.K.Y. Tan. 2007. Cold temperature exposure at 10 degrees C for 10 and 20 nights does not reduce tissue viability in vegetative
and early flowering cotton plants. Aust. J. Exp. Agric.
47(2):198–207.
Pettigrew, W.T., J.J. Heitholt, and W.R. Meredith, Jr. 1992.
Early season floral bud removal and cotton growth, yield and fiber quality. Agron. J. 84:209–214.
Reddy, V.R., K.R. Reddy, and D.N. Baker.1991. Temperature effect on growth and development of cotton during the fruiting period. Agron. J. 83:211–217.
Reddy, K.R., H.F. Hodges, and V.R. Reddy. 1992. Tempera-ture effects on cotton fruit retention. Agron. J. 84:26–30.
SAS. 2001. The SAS system for windows. Release 8.0. SAS Inst., Cary, NC.
Singh, B., L. Haley, J. Nightingale, W.H. Kan, C.H. Haigler, and A.S. Holaday. 2005. Long-term night chilling of cot-ton (Gossypium hirsutum) does not result in reduced CO2 assimilation. Functional Plant Biol. 32:655–666.
Stewart, J.M., 1986. Integrated events in the flower and fruit.
p. 297 In J.R. Mauney and J.McD. Stewart (eds.). Cotton Physiology. The Cotton Foundation, Memphis, TN.
Viator, R.P., R.C. Nuti, K.L. Edminsten, and R.Wells. 2005. Predicting cotton boll maturation period using degree days and other climatic factors. Agron. J. 97:494–499.
Warner, D.A., A.S. Holaday, and J.J. Burke. 1995. Response of carbon metabolism to night temperature in cotton. Agron. J. 87:1193–1197.
Wilson, L.J., V.O. Sadras, S.C. Heimoana, and D. Gibb. 2003. How to succeed by doing nothing: cotton competition after simulated early season pest damage. Crop Sci. 43:2125–2134.
Yeates, S.J., G.A. Constable, and T. McCumstie. 2010a. Ir-rigated cotton in the tropical dry season. I. Yield, its components and crop development. Field Crops Res. 116:278–289
Yeates, S.J., G.A. Constable, and T. McCumstie. 2010b. Ir-rigated cotton in the tropical dry season. II. Biomass accumulation, partitioning and RUE. Field Crops Res. 116:290–299.